

- within Immigration topic(s)
- in United Kingdom
- with readers working within the Business & Consumer Services industries
- within Immigration topic(s)
- with Senior Company Executives and HR
The Australian Labour Market for Migrants report by Jobs and Skills Australia highlights several migrant employment trends observed nationally over the 12 months to February 2026.
Key findings from the report:
- Migrant workers made up the largest share of the workforce in Western Australia compared to other states and territories.
- As migrants spend more time in Australia, their employment rates typically increase, reflecting greater labour market integration.
- The Net Overseas Migration (NOM) distribution was the highest in New South Wales and Victoria.
Interstaff examines these migrant employment, participation, and distribution trends in greater detail.
We also share insights from the International Labour Market Update report, which indicate Australia’s competitiveness as a skilled migrant destination.
Australian Labour Market for Migrants Report
Overall, the report indicates the Australian economy and labour market remain resilient.
Unless otherwise stated, data from the report are derived from the Australian Bureau of Statistics Labour Force Survey, February 2026.
Migrant employment by state/territory
Migrant workers made up the largest share of the workforce in Western Australia (42.4%), Australian Capital Territory (38.1%), Victoria (37.9%) and New South Wales (37.2%), and the smallest share in Tasmania (19.6%) and South Australia (27.5%).
These differences highlight varying workforce needs across states and territories and their reliance on skilled migration to meet those needs.
Percentage of migrant employment by state/territory
| WA | SA | NSW | VIC | QLD | TAS | NT | ACT |
|---|---|---|---|---|---|---|---|
| 42.4% | 27.5% | 37.2% | 37.9% | 32.1% | 19.6% | 37.1% | 38.1% |
Remaining percentage per state/territory refers to Australian-born employment. For example, WA has 42.4% migrant employment and 57.6% Australian-born employment.
Migrant participation in the labour market
Data indicates that employment rates increase with time spent in Australia, with established migrants generally more likely to be employed than recent arrivals.
Patterns of migrant participation in the labour market are influenced by factors such as skill level, age, English language proficiency, recent and relevant work experience, and length of time in Australia.
Australia’s skilled migration programs are designed to support higher migrant workforce participation by setting eligibility requirements for many of these factors.
Net Overseas Migration (NOM) distribution by state/territory
Net Overseas Migration (NOM)
Refers to population changes driven by the net difference between the number of international arrivals and departures over a 12-month period.
A positive number means more people moved to a country than left. It includes all travellers, including temporary visa holders, permanent residents, and citizens.
The Australian Labour Market for Migrants report indicates the total NOM to Australia was 304,812 in 2024-25.
The report also outlines the NOM distribution by state and territory, providing insight into where migrants and visa holders tend to live or settle.
The NOM was the highest in New South Wales and Victoria (receiving 90,226 and 87,159 people respectively) and the lowest in Tasmania (3,023 people) and the Northern Territory (3,753 people).
NOM distribution by state/territory
| WA | SA | NSW | VIC | QLD | TAS | NT | ACT |
|---|---|---|---|---|---|---|---|
| 41,057 | 19,069 | 90,226 | 87,159 | 55,673 | 3,023 | 3,753 | 4,819 |
International Labour Market Update
According to Jobs and Skills Australia’s International Labour Market Update May 2026, Australia also continues to perform strongly compared to other advanced economies.
Several indicators, such as low unemployment, labour participation levels, and sustained demand for workers provide insight into Australia’s attractiveness as a skilled migrant destination.
Unemployment
Australia recorded only a small rise over the year to March 2026, keeping it aligned with strong performers such as the USA and Japan and well below the Organisation for Economic Development and Cooperation (OECD) February 2026 unemployment rate of 5%.
Labour force participation
Australia saw a small 0.1pp (percentage point) decline between Nov 2025 and Feb 2026, while NZ (+0.2pp), Japan (+0.1pp) and Canada (+0.1pp) increased and the UK, France and USA were unchanged.
Despite the slight dip, Australia remains well above low‑participation economies.
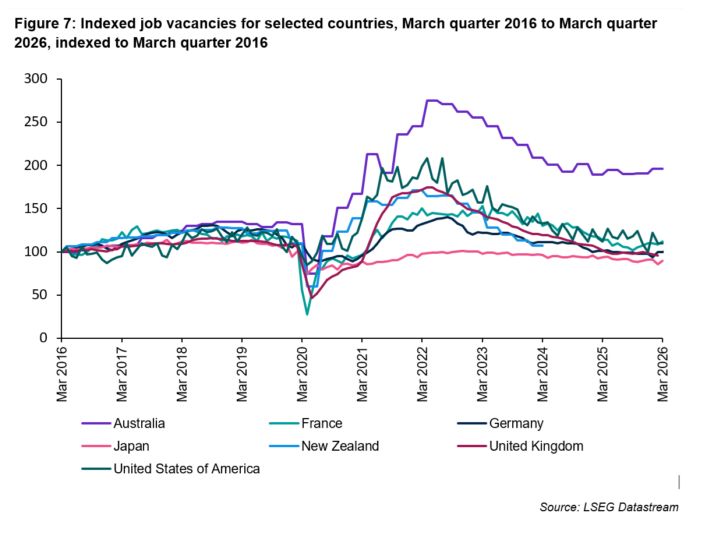
Job vacancies
Job vacancy rates fell across most advanced economies throughout 2025–26, except for Australia, indicating a continued strong demand for workers.
Sustainable people strategy: Global talent
Various other national and state labour market trends are captured in Jobs and Skills Australia’s Australian Labour Market for Migrants report and International Labour Market Update May 2026 that may interest employers.
These include occupation, industry and gendered workforce trends, earnings and labour cost reviews, and productivity/economic outlooks.
Australian Labour Market for Migrants Report – April 2026
International Labour Market Update – May 2026
Interstaff’s Registered Migration Agents support employers requiring sustainable global talent strategy to strengthen workforce capabilities.
Access our immigration insights to explore:
- Migrant workforce and labour market updates
- Work rights and visa conditions
- Temporary and permanent visa pathways
Sources:
Interstaff’s Registered Migration Agents, MARN: 0533879
Australian Labour Market for Migrants Report, April 2026 – Jobs and Skills Australia
International Labour Market Update, May 2026 – Jobs and Skills Australia
Migration Institute of Australia
The content of this article is intended to provide a general guide to the subject matter. Specialist advice should be sought about your specific circumstances.
