

Tesco PLC is currently confronted with a shareholder revolt after the Company's remuneration committee inflated executive bonuses by removing Ocado from the peer group used to estimate its performance. The Annual General Meeting (AGM) of Tesco is scheduled for June 26, 2020, and is set to expect a higher percentage of negative votes against the directors' remuneration report, particularly following Glass Lewis' advice to investors to vote against Tesco's remuneration report.
The removal of Ocado from Tesco's peer index
Tesco's remuneration committee decided to remove Ocado from the custom peer index1 used to measure its relative Total Shareholder Return (TSR) for the 2017 Performance Share Plan (PSP) after May 16, 2018. The argument behind this action, according to Tesco's report:
"Ocado has experienced significant share price growth which analysis shows is directly correlated to the sales of its technology platform as opposed to its food business. This was when Ocado signed its third major technology deal, establishing a clear pattern of pursuing a technology strategy. As a result of Ocado's divergence from the retail market (and hence as a direct comparator for Tesco)2".
As a result, the impact of the removal of Ocado from the peer group contributed to changing the actual performance from underperforming the custom index by 4.2% to over-perform the custom index by 3.3%. If Tesco's TSR was below the custom index as it was before removing Ocado, the TSR metric, which is weighted at 0.5 of the PSP, would have been zero.
However, omitting Ocado resulted to a share vesting equal to 33.4% of the maximum PSP. The long-term incentive payments to the CEO and CFO were approximately boosted by GBP 1.6 million and GBP 0.87 million, respectively.
Historical remuneration report outcome
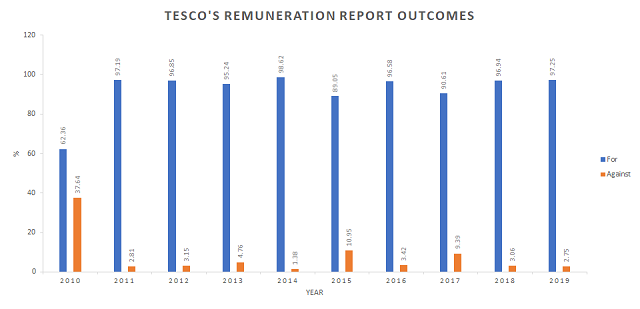
Figure 1 below illustrates the outcomes of voting of historical director remuneration reports at the AGMs of Tesco between 2010-2019. The three largest negative outcomes against the directors' remuneration report took place in 2010, 2015 and 2017.
In 2010, the remuneration report received the most negative votes with more than one-third of the total votes against. The cause which led to this shareholder revolt against the directors' remuneration report in 2010 was the director's excessive pay in relation to poor company performance in the US.
Sir Terry Leahy, the CEO at the time, received GBP 10 million and Tim Mason, who was responsible for the US market, received about GBP 7 million.
Five years later, in 2015, almost 11% failed to back Tesco's remuneration report. This was due to a huge payment of GBP 4.13 million to the newly arrived CEO for just six months' work at Tesco and a slightly more that GBP 1 million to the former CEO, who oversaw negative sales and profits.
Finally, in 2017, 9.4% voted against the directors' remuneration report due to excessive relocation costs to the current CEO, which is not considered appropriate.
Fast-forwarding to 2020 and the upcoming AGM, it is expected that another big shareholder revolt will be recorded after the company's remuneration committee inflated executive bonuses by approximately GBP 1.6 million by removing Ocado from the peer group. According to the Sunday Times, Glass Lewis, the proxy advisor, expressed their "severe reservations" with regards to the exclusion of the online grocer from its calculations. Moreover, Glass Lewis advised investors to vote against Tesco's remuneration report at Tescos' upcoming 2020 AGM, arguing that such "discretionary" actions "undermined the idea of transparent, target-based pay".
Source: CGLytics Data and Analytics
Tesco's descriptive statistic of 2019 compared to the past 10 years
The table below (Table 1) presents the average remuneration of Tesco's CEO and performance measures from 2010-2019. The average realized pay to Tesco's CEO is slightly more than GBP 6 million, of which 21% is base salary, 39% STI and 55% LTI. The average Return on Assets (ROA) and the average Return on Equity (ROE) have positive results over time. However, the average three-year TSR is negative. Tesco's CEO total realized pay in 2019 is GBP 6.8 million, which is 11.6% higher than the average total realized pay over the past 10 years. Comparing the performance measures in 2019 to the past 10 years combined, ROA (2.8%) underperform the average values and ROE (10.4%) and TSR (3Y) (29.7%) overperform the average.

Tesco's CEO compensations against its peer group (including Ocado)
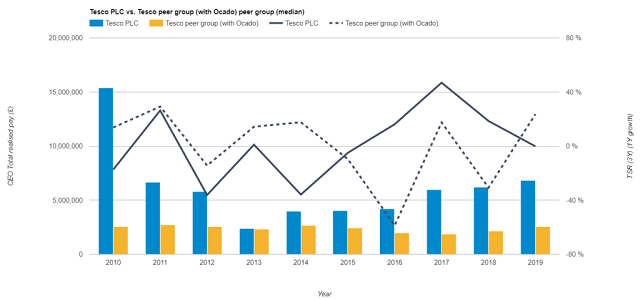
Figure 2 shows Tesco's CEO total realized pay and Tesco's change in TSR (3Y) 3 against its peer group4. Between 2010-2019, Tesco overpaid its CEO compared to its industry peers, particularly in 2010 and 2019 when Tesco awarded the highest total realized pay to its CEO. Moreover, the first five years it is observed that the peer group has higher change in TSR (3Y) when compared to Tesco. However from 2015 Tesco overperformed the peer group until 2018. Again, in 2019, the change in TSR (3Y) of Tesco's peer group is higher. Therefore, Tesco's higher payments to its CEO did not guaranty better performance.
Source: CGLytics Data and Analytics
Comparing Tesco's CEO pay and change in TSR (3Y) against peer group with and without Ocado
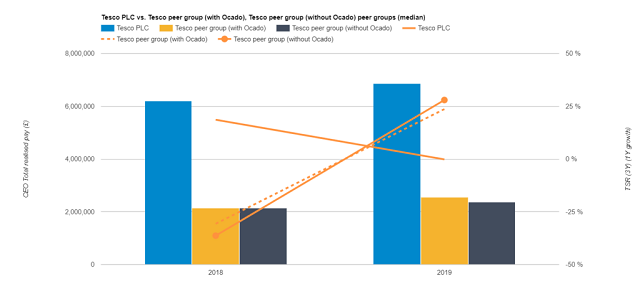
This section describes the impact of omitting Ocado from Tesco's peer group. Figure 3 illustrates Tesco's CEO total realized pay and Tesco's change TSR (3Y) against its peer group with and without Ocado. It is clear from the figure that the change in TSR (3Y) is higher in the peer group that includes Ocado, compared to the peer group without Ocado, with a difference of 4.3%.
Therefore, the omission of Ocado from the peer group provides lower change TSR (3Y) value, which in its turn lowers the threshold. Thus, as a result of this omission, Tesco's executive payments based on TSR – a total payment of approximately GBP 2.47 million – could be justified, whilst otherwise would have ended up with zero.
Source: CGLytics Data and Analytics
Where does Tesco's CEO Pay for Performance rank?
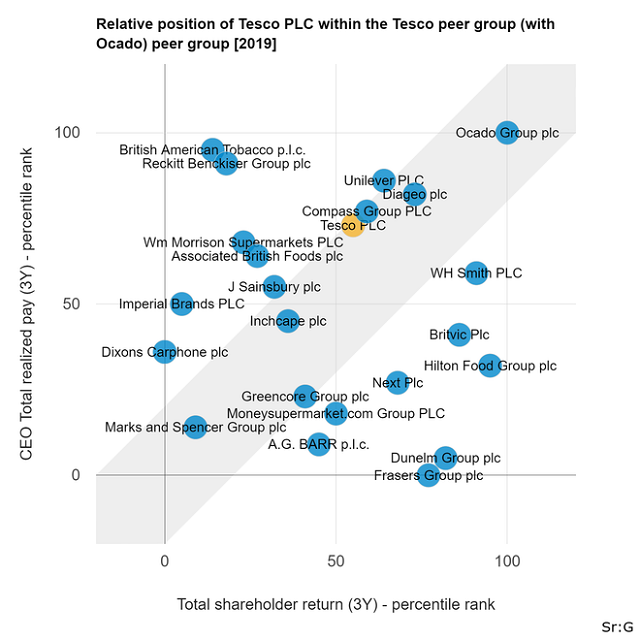
The Long-Term Incentive Plan of Tesco in 2017 was weighted as TSR equal to 0.5, cumulative cash generation equal to 0.3, and key stakeholder measures equal to 0.2 over a three-year performance period. Comparing Tesco's CEO pay practice in relation to its peer group (including Ocado) using CGLytics' Pay for Performance model, we observe a misalignment between the CEO's total realized pay and TSR (3Y).
Hence, Tesco's CEO 2019 total realized pay ranks slightly lower than the upper quartile at the 73rd percentile, while its TSR (3Y) ranks slightly higher than the median at the 55th percentile. Thus, the results of the test we conducted, using CGLytics Pay for Performance modeler, in Figure 4 suggest that Tesco is over-paying its CEO relative to its peer group.
Source: CGLytics Data and Analytics
Upcoming Tesco AGM
Looking back at Tesco's history, shareholder revolts may not be a new incident and they may also be expected during the upcoming AGM, especially given the observations that Ocado's omission from the peer group led to an inflation of the executive payments. The real question now is to see whether the shareholders will consider Ocado as a direct competitor or not, and as to whether they will follow Glass Lewis' advice to vote against Tesco's remuneration report. Moreover, this analysis brings to the front that Tesco's pay practices were much higher over the recent years compared to its peer group, recording its 2nd highest payment in 2019, when looking at the period between 2010 and 2019. Evidently, this may be a signal that Tesco's remuneration policy must be reviewed, re-evaluated and perhaps change soon.
Would you like to see how your executive compensation is viewed by leading independent proxy advisor Glass Lewis?
Click here to learn more about the Glass Lewis CEO compensation analysis and peer group modeling for Say on Pay engagement, available exclusively via CGLytics. Make data-driven decisions this proxy season with CGLytics.
Footnotes
1 "Benchmark index made up of FTSE 350 Food and Drug Retailers and FTSE 350 General Retailers weighted 85% and 15%, respectively". Tesco's Annual Report 2019 [ https://www.tescoplc.com/media/755761/tes006_ar2020_web_updated_200505.pdf].
2 Reference: Tesco's Annual Report 2019 [ https://www.tescoplc.com/media/755761/tes006_ar2020_web_updated_200505.pdf].
3 Change TSR (3Y) refers to one-year growth of the three-year TSR.
4 This analysis attempts to simulate Tesco's custom peer group, which includes 34 UK companies in the same industry as Tesco from the FTSE-100 and FTSE-250.
Originally published 10 June, 2020
The content of this article is intended to provide a general guide to the subject matter. Specialist advice should be sought about your specific circumstances.
