
For the past two weeks, we've been reviewing the data on the Supreme Court's experience with amicus briefs, asking whether petitioners or respondents tend to average more amicus support. Now, as a further step towards modeling the impact of amicus briefs, let's look at whether winning or losing petitioners or respondents average more amicus support.
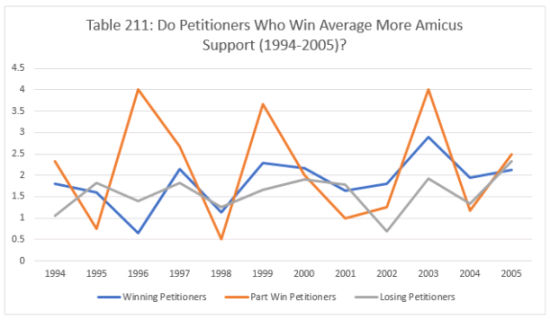
In Table 211, we report the data for the years 1994-2005 for petitioners in reversals, cases which were affirmed in part and reversed in part, and affirmances. The data does not strongly suggest that, for these years, winners were more likely to have more amicus support. Winning petitioners only averaged more amicus briefs in seven of the first twelve years of our period. In 1994, winning petitioners averaged 1.81 amicus briefs, while losing petitioners averaged 1.06. In 1997, winning petitioners averaged 2.15 briefs to 1.83 for losers. In 1999, winning petitioners averaged 2.29 briefs to 1.67 for losing petitioners. The next year, winning petitioners averaged 2.17 briefs to 1.9 for losers. In 2002, winning petitioners averaged 1.81 amicus briefs to 0.68 briefs for petitioners in affirmances. The next year, winning petitioners averaged 2.89 amicus briefs to 1.92 for petitioners. In 2004, winning petitioners averaged 1.95 amicus briefs to 1.33 extra briefs for losing petitioners.
In six of the twelve years of the period, petitioners in cases which ended in partial affirmances and partial reversals averaged more amicus briefs than either winning or losing petitioners (albeit with a smaller sample of cases). In 1994, petitioners who won in part averaged 2.33 amicus briefs to 1.81 for winners and 1.06 for losing petitioners. Two years later, petitioners who won in part averaged four amicus briefs to 1.4 for losing petitioners and 0.65 for losing petitioners. In 1997, petitioners who scored a partial win averaged 2.67 briefs to 2.15 for winners and 1.83 for losing petitioners. In 1999, petitioners who scored a partial win averaged 3.67 amicus briefs to 2.29 for winners and 1.67 for petitioners in affirmances. In 2003, petitioners who prevailed in part averaged 4 amicus briefs to 2.89 extra briefs for petitioners who prevailed and 1.92 to petitioners who lost. In 2005, petitioners in partial affirmances averaged 2.5 briefs, while petitioners in affirmances averaged 2.33 briefs and 2.13 briefs for petitioners in reversals.
In contrast, respondents who won affirmances generally averaged more amicus support than losing respondents for these years. Winning respondents averaged more amicus support than losers from 1995 through 2001 and in 2003. In 1995, winning respondents averaged 2.17 amicus briefs to 0.92 for losers. In 1996, winning respondents averaged 1.7 extra briefs to 0.71 for losers. In 1997, winning respondents averaged 1.44 amicus briefs to 1.12 for losing respondents. The next year, winning respondents averaged 1.7 briefs to 0.88 for losing respondents. In 1999, winning respondents averaged almost twice as many briefs as losing respondents – 1.81 to 0.96. For 2000, respondents averaged 1.65 amicus briefs in affirmances to 1.25 for respondents in reversals. In 2001, respondents in affirmances averaged 1.63 briefs to 1.04 for respondents in reversals. Finally, in 2003 respondents who won averaged 1.67 amicus briefs to 1.48 briefs for losers.
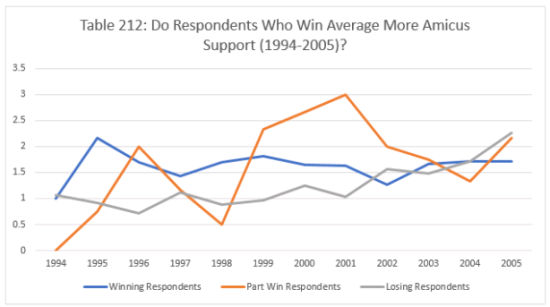
Once again, parties who scored partial wins averaged more briefs than either clear winners or losers. In 1996, respondents who scored a partial win averaged 2 amicus briefs to 1.7 for winners and 0.71 for losers. In 1999, respondents in partial affirmances and reversals averaged 2.33 amicus briefs to 1.81 extra briefs for winning respondents and 0.96 for losing respondents. The following year, respondents who scored partial wins averaged 2.67 amicus briefs to 1.65 for winning respondents and 1.25 for losing respondents. In 2001, respondents who won in part averaged 3 amicus briefs to 1.63 for winners and 1.04 for losing respondents. The next year, partial winners averaged 2 amicus briefs to 1.57 for losing respondents and 1.26 for winning respondents.
Join us back here tomorrow as we look at the data from 2006 through 2016.
The content of this article is intended to provide a general guide to the subject matter. Specialist advice should be sought about your specific circumstances.