- within Transport, Law Department Performance and Consumer Protection topic(s)
- with Senior Company Executives, HR and Inhouse Counsel
- in Canada
- with readers working within the Technology industries
As global M&A activity continues to suffer from generally high interest rates and economic uncertainty, dealmakers in the United States and Canada may have had reason to hope their cross-border deal flow would provide some relief.
Half the year remains for this promise to materialize, but signs at the half-year mark are mixed.
Inbound investment into the U.S.
Global M&A deal value and volumes are down substantially for the first half of 2023 versus H1 and H2 of 2022, and global deal flow into the United States reflects that trend. Annualized numbers project a significant year-over-year decline in deals—from 2,264 deals in 2022 to 1,964 deals in 2023, and deal value of US$236 billion in 2022 to just US$188 billion projected in 20231.
Canadian investment into the U.S. dovetails with the global trend. So far this year, investment from Canada into the U.S. is down (see Figure 1). Deal count for Canadian acquisitions of U.S. targets is projected to end the year at 518 deals, down from 646 deals in 2022 and a whopping 911 deals in 2021. Aggregate deal value is projected to decline even more significantly—to US$47 billion in 2023, down from US$81 billion in 2022 and US$119 billion in 2021.
When it comes to the value of inbound deals from Canada into the U.S., the most notable data point from H1 2023 is the moderate decline of mid-market deals as a proportion of all deals—from 4% in 2022 to just 1% this year (see Figure 2).
Figure 1 - Deal value and count (Canadian acquirers of U.S. targets)
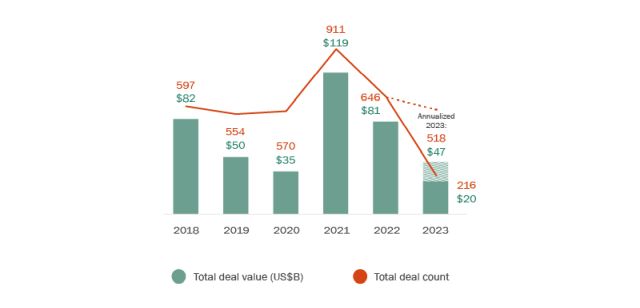
Source: Bloomberg. Based on M&A deals announced during Jan. 1, 2018 - May 31, 2023. Excludes terminated and withdrawn deals.
Figure 2 - Deal value ranges (Canadian acquirers of U.S. targets
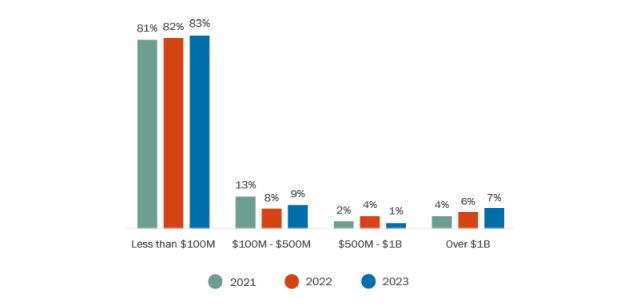
Source: Bloomberg. Based on M&A deals announced during Jan. 1, 2018 - May 31, 2023. Excludes terminated and withdrawn deals.
Canadian sector interest in the U.S. paints an interesting and in some ways counter-intuitive picture as to the focus of Canadian acquirers. Bucking the general trend, the relative portion of Canadian acquisitions of U.S. technology firms actually increased for the first half of 2023, while deals for the consumer non-cyclical sector were down (see Figure 3). Less surprising, Canadian acquisitions of U.S. financial sector companies were substantially down from prior years, while Canadian acquisitions of U.S. industrials and consumer cyclical companies were up proportionately relative to other sectors.
Significantly, basic materials represent a greater share (by five percentage points) of Canadian acquisitions in the U.S. than last year, which may be spurred by Canadian strategics' need to invest in critical minerals and otherwise fortify their supply chains in light of recently announced restrictions on doing business with "non-likeminded regimes" (a term used by the Canadian government; the general policy thrust is shared by both the Canadian and U.S. governments). Late last year, Canada went so far as to order three Chinese companies to divest recently acquired interests in critical mineral assets, while both Canada and the U.S. are in the process of establishing incentive programs to encourage the development of critical mineral assets, including with foreign investment from friendly nations.
Figure 3 - Industry breakdown (Canadian acquirers of U.S. targets)
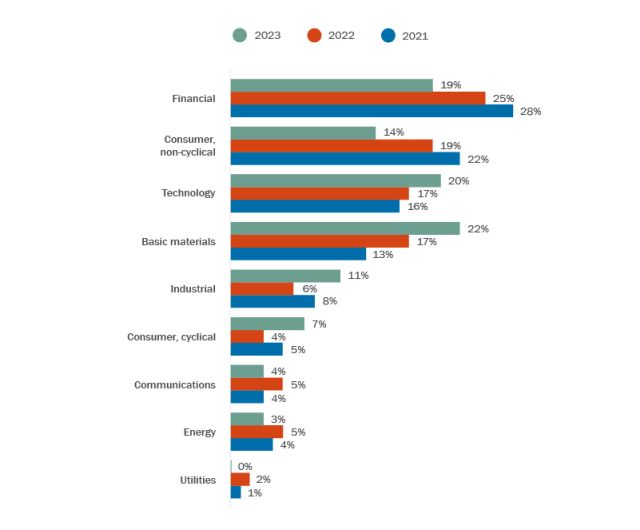
Source: Bloomberg. Based on M&A deals announced during Jan. 1, 2018 - May 31, 2023. Excludes terminated and withdrawn deals, and deals with no disclosed value.
Inbound investment into Canada
Canada continues to represent a valuable market for investors, with a weaker Canadian dollar playing in its favour. Global investment into Canada has increased in 2023, with annualized deal count projected to rise moderately from 692 deals in 2022 to 721 deals in 2023. However, the annualized value of deals has skyrocketed, from C$37 billion in 2022 to C$131 billion in 2023. This projected number for end-of-year 2023 is skewed in part by one high-value deal: Glencore's proposal to acquire Teck Resources for C$36.4 billion2.
The volume of U.S. investment into Canada is not entirely consistent with the general trend. Based on annualized numbers, the number of U.S. acquisitions of Canadian companies is projected to decline moderately from 479 deals in 2022 to 418 deals in 2023 (see Figure 4). However, total deal value for 2023 is projected to increase from US$22 billion in 2022 to US$31 billion. This also outstrips total deal value of US$30 billion in 2021 and US$19 billion in 2020, though it is less than 2019's total deal value of US$36 billion.
The decrease in deal volume coupled with the increase in value signals a moderate shift in the distribution of different deal sizes. It would seem to indicate that U.S. buyers of Canadian assets are focusing on larger M&A deals. However, while the percentage of larger deals greater than $500 million has increased slightly, so has the percentage of smaller deals less than $100 million. In reality, it is the decrease in mid-market deals—those valued between $100 million and $500 million—that is fueling this shift, with mid-market deals declining by 10%, from 29% to 19% of all deals (see Figure 5).
Figure 4 - Deal value and count (U.S. acquirers of Canadian targets)
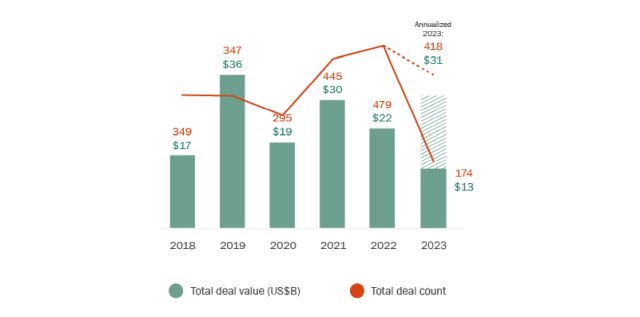
Source: Bloomberg. Based on M&A deals announced during Jan. 1, 2018 - May 31, 2023. Excludes terminated and withdrawn deals.
Figure 5 - Deal value ranges (U.S. acquirers of Canadian targets)
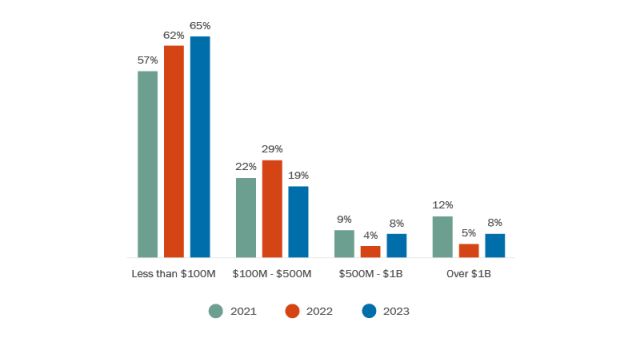
Source: Bloomberg. Based on M&A deals announced during Jan. 1, 2018 - May 31, 2023. Excludes terminated and withdrawn deals.
The current economic environment is having a significant impact on the sector-by-sector focus of U.S. acquisitions of Canadian companies. With interest rates high and stock market performance uneven, activity among acquirers has shifted from riskier technology acquisitions to more defensive plays.
Thus, technology M&A has declined as a percentage of U.S. deals into Canada—down both from last year and the year prior—reflecting a challenging environment for tech generally (see Figure 6). At the same time, deal activity in defensive sectors such as consumer non-cyclicals has ticked up slightly, and industrials have surged to almost one in five deals so far this year. Further, the financial industry, which typically benefits from a high-interest-rate environment, has also grown as a percentage of cross-border investments into Canada.
Figure 6 - Industry breakdown (U.S. acquirers of Canadian targets)
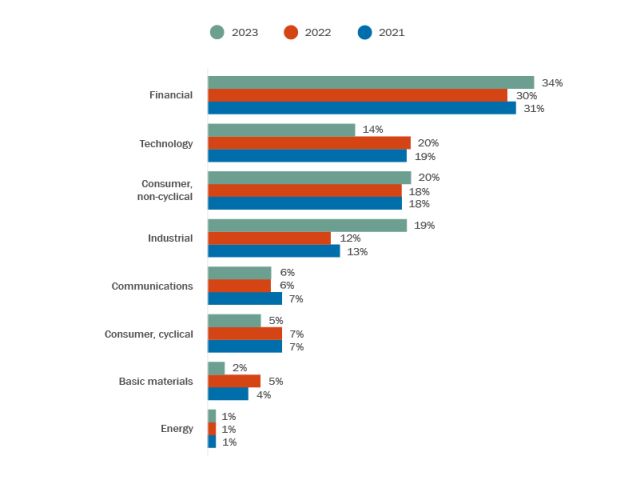
Source: Bloomberg. Based on M&A deals announced during Jan. 1, 2018 - May 31, 2023. Excludes terminated and withdrawn deals, and deals with no disclosed value.
Meanwhile, further abroad, Japan is an example of an economy providing strong Canadian (and U.S.) inbound investment activity year-to-date—with total deal count annualizing close to the same level as for the full year for 2022. This is despite the weakened value of the Japanese yen.
Japan, which is bucking the global trend of rising interest rates, is providing investors with access to much cheaper capital, spurring outbound investment activity as Japanese buyers look for investment opportunities outside the country to diversify their supply chain away from China, and to address the projected lack of domestic growth due to a rapidly declining population. The trend of Japanese companies repositioning their portfolios and selling foreign assets is also continuing. Canada's industrial and resource sectors remain the top target for Japanese investors, accounting for over 60% of overall activity year-to-date (vs. 43% in 2022). (See Figure 7.)
Figure 7 - Industry breakdown (Japanese acquirers of Canadian targets)
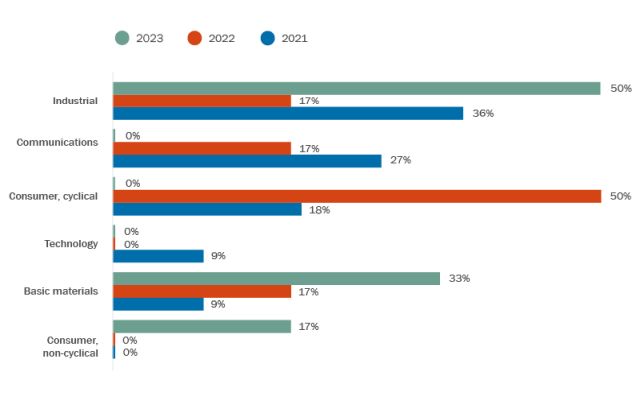
Source: Bloomberg. Based on M&A deals announced during Jan. 1, 2018 – June 19, 2023. Excludes terminated and withdrawn deals. Note: some deals include acquirers from multiple countries.
The year of the strategic buyer?
This year's high interest rates globally (Japan being the most notable exception) have given strategic buyers a potential leg up on their private equity counterparts. With some cash-rich strategics less dependent on raising capital to fund deals, they are less impacted by changes in the financing markets.
The numbers bear this out. According to a Q2 report focused on U.S. midmarket deals, strategics accounted for almost 6 out of 7 deals (83.9%), with financial buyers representing just 1 in 7 (16.1%)3.
That being said, overall strategic M&A remains down 40% year over year in the first half of 20234. Private equity dealmakers remain primed to purchase, with high levels of dry powder of recent years yet to be exploited fully. This follows data from last year indicating greater optimism for deals in the PE community than among strategics.
While the interest rate environment favours strategic buyers for the time being, both private equity and strategic buyers will benefit from the ongoing decline in deal multiples. Globally, corporate dealmakers have already benefited from the dip in median purchase price multiples, which are down by 24.3% from their peak in 2021. Private equity deal multiples are decreasing like those of their corporate counterparts: for Q1 2023, the median multiple in announced private equity deals was 1.7x, as compared to 2.5x in 2021 and 2.4x in 20225.
Conclusion
The current high-interest-rate environment and other macroeconomic factors have posed some challenges for dealmakers throughout the first half of the year. Seller expectations remain high, and seller-buyer valuation gaps persist. On the other hand, declining deal multiples may help spur further deal activity in the coming months. For investors navigating the market, there will be opportunities to utilize dealmaking expertise to win in competitive auctions for good assets.
Footnotes
1. Bloomberg. Based on M&A deals announced during Jan 1, 2022 - Jun 19, 2023. Excludes terminated and withdrawn deals.
2. Bloomberg. Based on M&A deals announced during Jan 1, 2022 - Jun 19, 2023. Excludes terminated and withdrawn deals.
3. https://greenwichgp.com/wp-content/uploads/2022/07/GCG-Q2-2022-Middle-Market-Update.pdf.
4. https://www.bain.com/insights/m-and-a-midyear-report-2023-it-takes-two-to-make-a-market/.
5. See pages 4-6: https://files.pitchbook.com/website/files/pdf/Q1_2023_Global_MA_Report.pdf. Comparison of multiples reflects 12 months ending March 31, 2023.
The content of this article is intended to provide a general guide to the subject matter. Specialist advice should be sought about your specific circumstances.