

- within Law Department Performance and Real Estate and Construction topic(s)
Introduction
Welcome to the Manatt State Cost Containment Update, a digital publication produced with generous support from the Robert Wood Johnson Foundation and in collaboration with the Peterson-Milbank Program for Sustainable Health Care Costs. This Manatt series, to be released quarterly through 2022, shares the latest updates on state cost growth benchmarking programs and other data-driven initiatives states are undertaking to contain health care cost growth. In each edition, we also feature a spotlight issue that speaks to how state benchmarking programs are collectively evolving to meet new regulatory or landscape needs. Below are our October updates.
October Spotlights
In each edition, Manatt will feature "deep dive" topics that share new cross-cutting benchmarking program developments as states seek to evolve and advance their cost growth benchmarking programs to meet new regulatory and landscape needs. In this issue, Manatt examines recent program changes in accountability and consumer affordability.
Accountability
The takeaway. State cost growth benchmarking programs are building on their market reporting to more rigorously define unjustified spending growth and what actions states should take to address entities driving such growth.
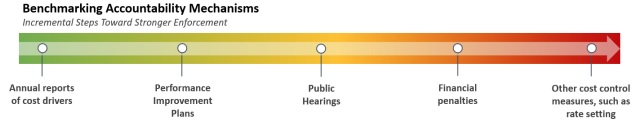
What it is. State cost growth benchmarking programs collect health care data that can help policymakers, regulators and stakeholders better understand the cost centers and cost drivers in their markets. Programs include a cost growth benchmark that annual health care cost growth should not exceed. States have a continuum of mechanisms for holding payers and providers accountable for unjustified spending above benchmarks, as illustrated in Figure 1. Where spending exceeds benchmarks, states are discussing two issues: First, how do we identify cases where the excess spending merits more aggressive action than public transparency? Second, what kind of escalating actions are appropriate to address unjustified spending above the benchmark?
Figure I. The Continuum of Benchmarking Accountability Mechanisms
What it means. Three states exceeded their cost growth benchmarks during 2019: Delaware, Massachusetts, and Rhode Island - by 4.0, 1.2, and 0.9 percentage points, respectively. 1,2,3 While all three programs have largely relied on public transparency to support cost growth containment, the tactic alone has not been a powerful enough deterrent to keep overall cost growth beneath established thresholds, spurring reviews of how excessive cost growth is identified and can be responded to.
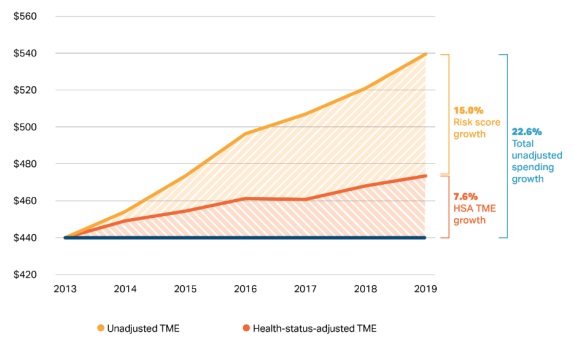
States are exploring strategies to better understand cost drivers and refine the methods they use to identify unjustified or excessive cost growth. For example, Massachusetts has traditionally assessed entity accountability to the cost growth benchmark on a "health status"-adjusted basis, generally holding entities accountable for factors over which they have more influence: health service utilization (by working with individuals to identify conditions and health needs earlier) and health service prices (by negotiating contracts that hold service spending growth beneath required levels and steering patients to more appropriate, lower-cost service settings where possible). But cost growth due to the changing health of members (i.e., illness burden and expected resource use) has been largely exempt from measurement, with payers providing health status-adjusted growth rates in their reporting.
However, recent analyses by the Massachusetts Health Policy Commission (HPC) identified unexplained inflation in payer-provided health status adjustment values - potentially caused by changing methodologies, upcoding of health status indicators, or broader improvements in health status indicators (i.e., stronger identification of previously observed but not recorded population health concerns) - and likely indicating chronic and continual underassessment of cost growth against which individual payers and providers should be held accountable. The HPC is assessing whether to modify health status adjustment methodology requirements or base future payer/provider accountability against unadjusted cost growth measures.
Figure II. Total Unadjusted Spending Growth in Massachusetts, 2013-20194
Oregon, similarly grappling with the question of when excess spending should spur enforcement, has proposed a different approach. The Oregon Implementation Committee Recommendations Report recommended statistical criteria for determining whether payers and providers in Oregon would be subject to certain accountability measures. 5 These include:
- In any given year, per capita cost growth exceeds the cost growth benchmark with 95% confidence; or
- Across two consecutive years, per capita cost growth exceeds the benchmark in both years with 80% confidence; or,
- For three out of five consecutive years (each independently assessed), per capita cost growth exceeds the cost growth target with 80% confidence.
Entities that "unreasonably" exceed the cost growth target during any performance year with statistical certainty for one or more markets would be automatically subject to a performance improvement plan (PIP). Connecticut's Cost Growth Benchmark Technical Team has similarly recommended incorporating into its own cost growth benchmark a statistical methodology for determining entity accountability.6
Oregon's HB 2081 builds on the accountability recommendations articulated in the Recommendation Report. 7 This includes charging the Oregon Health Authority (OHA) with adopting rule criteria for imposing financial penalties for entities that exceed the cost growth target "without reasonable cause" in three out of five calendar years beginning in 2026, as part of the "escalating accountability mechanism" recommended by the Implementation Committee. The law does not specify the financial penalty amount, but does specify that it must be based on "the degree to which the provider or payer exceeded the target and other factors," including but not limited to:
- The size of the provider or payer organization;
- The good faith efforts of the provider or payer to address health care costs;
- The provider's or payer's cooperation with the authority or the department;
- Overlapping penalties that may be imposed for failing to meet the target, such as requirements relating to medical loss ratios; and
- A provider's or payer's overall performance in reducing cost across all markets served by the provider or payer.
The law also sets new financial penalties of up to $500 per day for entities that fail to report cost growth data and/or fail to develop and implement a PIP if required.
Even in states with accountability measures already incorporated into their benchmarking programs, holding specific entities accountable for exceeding cost growth has not been widespread. For example, while Massachusetts' HPC has the authority to impose PIPs and financial penalties of up to $500,0008 under Chapter 224 of the Acts of 2012, it has not yet exercised either option, though it has indicated an increasing willingness to do so.9 Notably, the HPC's 2021 Annual Cost Trends Report puts forth a recommendation that demonstrates a willingness to increase accountability and address excessive provider price increases by establishing price caps for the highest-priced providers in the state.10
Footnotes
1 Delaware's per capita cost increased from $7,814 in 2018 to $8,424 in 2019, or 7.8% - more than twice as high as the 3.8% target. Available here: https://news.delaware.gov/2021/04/01/state-releases-first-health-care-benchmark-trend-report-for-201/#:~:text=Latest%20Step%20in%20Effort%20to,Quality%20of%20Care%20in%20Delaware&text=The%20per%2Dcapita%20c ost%20increased,high%20as%20the%203.8%25%20target.
2 From 2018 to 2019, the per capita growth in total health care expenditures in Massachusetts was 4.3%, exceeding the health care cost growth benchmark of 3.1% set by the HPC. Available here: https://www.mass.gov/info-details/health-care-cost-growth-benchmark.
3 Rhode Island's per capita health care spending grew 4.1% between 2018 and 2019, exceeding the state's 3.2% health care cost growth target. Available here: http://www.ohic.ri.gov/documents/2021/April/Cost%20Trends/steering%20committee%20meeting%202021%204- 29%20for%20sharing.pdf.
4 "The Next Evolution of Healthcare Cost Growth Benchmarking Models," NAHDO 36th Annual Conference. Presented September 28, 2021. Chart sources: Massachusetts CHIA TME databooks.
5 "Oregon Implementation Committee Recommendations Report," Oregon Health Authority. January 25, 2021. Available here: https://www.oregon.gov/oha/HPA/HP/HCCGBDocs/Cost%20Growth%20Target%20Committee%20Recommendations%20Repo rt%20FINAL%2001.25.21.pdf.
6 Cost Growth Benchmark Technical Team February 21, 2021, Meeting Notes, stating "the Technical Team recommended that OHS perform calculations of statistical significance when reporting benchmark performance to ensure the accuracy of findings," Connecticut Office of Health Strategy. Available here: https://portal.ct.gov/-/media/OHS/Cost-Growth-Benchmark/CGB-TT-Information/CGB--TT-Meetings-2021/February-22-2021/CT-OHS---Technical-Team-Meeting---Minutes-2021-2-22.pdf.
7 House Bill 2081. Available here: https://olis.oregonlegislature.gov/liz/2021R1/Downloads/MeasureDocument/HB2081/Enrolled.
8 Under Chapter 224 of the Acts of 2012, if the HPC determines a health care entity has willfully neglected to file a PIP, failed to file an acceptable PIP in good faith, failed to implement the PIP in good faith, or knowingly failed to provide or falsified information required by the HPC, the HPC may assess a civil penalty to the health care entity of up to $500,000 as a last resort. Available here: https://malegislature.gov/laws/sessionlaws/acts/2012/chapter22%204.
9 "As premiums rise, Health Policy Commission mulls adding accountability measures," MetroWest Daily News. July 15, 2021. Available here: https://www.metrowestdailynews.com/story/news/2021/07/15/massachusetts-family-health-insurance-premiums-21-424-average-2019/7977321002/.
10 2021 Annual Cost Trends Report, Massachusetts Health Policy Commission. September 2021. Available here: https://www.mass.gov/doc/2021-health-care-cost-trends-report/download.
To read the full article click here
The content of this article is intended to provide a general guide to the subject matter. Specialist advice should be sought about your specific circumstances.
