- with readers working within the Retail & Leisure industries
This time, we're reviewing the reversal rates in civil cases from 1990 to 2020 for the areas of California outside of Los Angeles' Second District - the First District (San Francisco) and the Third, Fourth, Fifth and Sixth Districts.
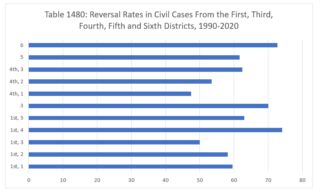
Division 4 of the First District had the worst reversal rate in this group - 74.07%. The Sixth District had a reversal rate of 72.72%. In the Third District, the reversal rate was 70.09%. Division 5 of the First District was at 63.04%. Division 3 of the Fourth District had a reversal rate of 62.5%. The Fifth District's reversal rate was 61.67%. Division 1 of the First District was at 59.57%. Division 2 was right behind at 58.18%. The reversal rate in Division 2 of the Fourth was 53.52%. Half the civil cases from Division 3 of the First District were reversed. The reversal rate in Division 1 of the Fourth District was 47.52%.
The two busiest courts during the 1990-2020 period were the Third District, which contributed 117 civil cases to the Court's docket, and the Fourth at 101. Division 2 of the Fourth District had 80 cases. Division 1 of the Fourth contributed 71. The Sixth District had 66 cases and the Fifth had 60. Division 2 of the First District contributed 55 cases. There were 54 from Division 4, 47 from Division 1, 46 from Division 5 and 42 cases from Division 3 of the First District.
Division 4 of the First District had the highest reversal rate from 1990 to 1999: 73.91%. The Sixth District was next at 73.08%, followed by Division 3 of the Fourth at 70%. Division 5 of the First District was at 68.75%. Division 2 was at 64.29%. The Third District had a reversal rate of 63.16%. The reversal rate in Division 2 of the Fourth District was 60.87%. The Fifth District had a reversal rate for these years of 58.33%. Division 1 of the First was at 55.56%, and Division 1 of the Fourth was at 51.52%. Division 3 of the First District fared best with a reversal rate of 45%.
The Sixth District fared worst between 2000 and 2009, with a civil reversal rate of 81.82%. The Third District was next at 73.21%. Division 4 of the First District and the Fifth District were tied with a reversal rate of two-thirds. Division 2 of the First District was close behind: 64.71%. Divisions 1 and 5 of the First District were tied at 52.63%. Division 3 of the First District and Division 3 of the Fourth were also tied: 46.15%. Division 2 of the Fourth had a reversal rate of 45.45%. Division 1 of the Fourth District had the best reversal rate for the decade: 43.59%.
Two Divisions of the First District have been reversed over eighty percent of the time between 2010 and 2020: Division 4 (81.25%) and Division 1 (80%). The Third District was at 73.91% and Division 5 of the First had a reversal rate of 72.73%. The reversal rate in Division 3 of the Fourth was 70.83%. Division 3 of the First District was reversed two-thirds of the time, and two courts had a reversal rate of 60%: Division 2 of the Fourth District and the Fifth District. Division 1 of the Fourth District had a reversal rate of 48.28%. Division 2 of the First performed best in the past eleven years: 30%.
Image courtesy of Pixabay by Foundry (no changes).
The content of this article is intended to provide a general guide to the subject matter. Specialist advice should be sought about your specific circumstances.