
For three years in a row, Earth's largest ocean has been stuck in its La Niña configuration. Now the Pacific has flipped to El Niño, businesses should prepare for record-high temperatures, weird weather, & slower economic growth.
The tropical Pacific Ocean has been remarkably dependable these past few years. Since the start of 2020, the trade winds have blown west across the equator in their usual fashion, pushing warm water away from South America and toward Indonesia and Papua New Guinea. This arrangement of air and ocean currents has been unusually vigorous over this period, with energized winds and even hotter water in the west. This situation is named La Niña and the uncommon persistence of this latest 'triple dip' event has set the table for global climate three years running. But La Niña has now exited the stage, and the spotlight is about to be taken by its mirror opposite.
...because the tropical Pacific Ocean is so enormous and holds so much heat, El Niño has a reach far beyond the confines of the basin itself.
The Pacific's other way of being is called El Niño. Under its oversight, the trade winds slacken and the massive pool of warm water in the west slouches eastward, taking up a position in the central Pacific. Normally the atmosphere above the Pacific forms a single loop, where air rises in the west, tracks eastward at higher altitudes, sinks back down off the coast of South America, and then rejoins the trade winds. During an El Niño, that single cell is split in two. The grand column of convection rises from the middle of the Pacific rather than its western arm, and air is pushed both east and west from that central location (Figure 1).
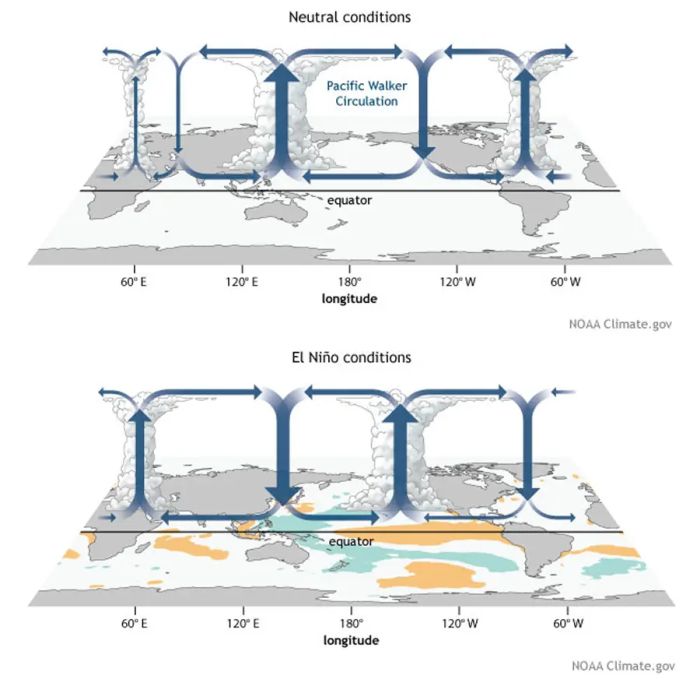
Figure 1. Generalized Walker Circulation
(December-February) during ENSO-neutral conditions and Generalized
Walker Circulation (December–February) anomaly during El
Niño events, overlaid on map of average sea surface
temperature anomalies.
Source : NASA Earth Observatory. La Niña times
three1. (2022).
These rearrangements and reversals toss the tropical Pacific's weather upside down. El Niño brings drought and wildfire to Indonesia, conducts surprise rainstorms and floods into the normally dry areas of Ecuador and Peru, and causes the marine food web surrounding the Galapagos Islands to collapse. But because the tropical Pacific Ocean is so enormous and holds so much heat, El Niño has a reach far beyond the confines of the basin itself.
Extratropical reverberations
El Niño and La Niña are the single leading cause of year-to-year changes in weather and climate across the planet.
El Niño and La Niña are the single leading cause of year-to-year changes in weather and climate across the planet.
How is it that ripple effects from the Pacific Ocean echo so far afield? One thread follows the Rossby waves, enormous planet-spanning twists and turns in Earth's atmosphere that guide heat and moisture away from the Equator and towards the poles. During El Niño, Rossby waves adopt a more meandering path and alter the trajectory of the jet streams (and therefore storm systems) over the continents. What's more, the atmosphere absorbs more heat while the ocean takes up less, and so two to three months after the event begins, global surface temperatures take an additional step upwards. That's the reason why major El Niño years are among the hottest ever recorded, including the current record holder, 20162.
All El Niños are alike in their general structure but each one also has its own peculiarities.
All El Niños are alike in their general structure but each one also has its own peculiarities. Some events, for instance, feature unusually warm water only in the central equatorial Pacific and do not involve much change in the eastern part of the ocean, where El Niño events generally are born. In the same fashion, while their impacts on the ground are not identical from event to event, overall there are consistent patterns that tend to repeat. A bog standard El Niño brings drought to Indonesia, Australia, Central America and northern South America, and heavy rains to the southern United States, southern South America, and the Horn of Africa3.
They can also conjure up more unusual reactions through their interference with the jet stream. For air travel between Hawaii and the continental United States, El Niño can lengthen or shorten flight durations by more than 30 minutes, depending on whether the flight is eastward or westward4. Farther downstream, El Niño causes ground-level winds to weaken across large swathes of Canada and the northern United States, sometimes for months at a time5. As the leading cause of 'wind drought' in North America, an impending El Niño is an ill omen for renewable energy production.
In total, the knock-on effects of El Niño extract a massive toll on the global economy.
In total, the knock-on effects of El Niño extract a massive toll on the global economy. A recent study from Dartmouth University put the global price tag of the major 1983 and 1998 events at nearly $4.1 trillion and $5.7 trillion, respectively6. That analysis argued the macroeconomic effects of El Niño are both abrupt and chronic. Extreme weather during the event itself causes loss of life, property damage, and wild fluctuations in crop prices. But El Niño also reduces economic growth in the long term, particularly in tropical countries where its imprint is strong (including Ecuador, Brazil, and Indonesia), and that stagnation can persist for five years or more after the initial event.
A whisper or a thunderclap?
By reading the signs in the tropical Pacific, climate scientists are able to spot El Niño and La Niña on the horizon three to six months in advance. Currently these long-term forecasts are made in one of three ways.
The first and oldest approach builds statistical models that predict an index of the El Niño/La Niña system based on other measured aspects of the tropical Pacific (such as deep ocean temperatures, air pressure patterns, or even the state of the index in previous months).
The second approach — dynamical modeling — uses high-performance computers to simulate the physical behavior of the ocean and atmosphere over the coming months.
The third (and newest) technique searches the huge database of climate model output to find all cases where the simulation closely resembles the current state of the Pacific Ocean7. Researchers can then trace how those lookalikes evolved over the next several months within the simulation and use that behavior to forecast El Niño in the real world.
The dynamical models are calling for a very strong event, perhaps one of the biggest of the past three decades.
As of mid-June 20238, nearly all models predict that El Niño will be in force past the end of the year but they disagree quite a lot about its strength. The dynamical models are calling for a very strong event, perhaps one of the biggest of the past three decades.
The statistical models are much more cautious, suggesting the tropical Pacific will just barely exceed the threshold to qualify as an El Niño. And the analog forecasts sit in the middle — an El Niño, but not a particularly strong one9.
Seasonal forecasting, even when tied to a phenomenon as intensively studied as El Niño, is still enormously challenging.
Seasonal forecasting, even when tied to a phenomenon as intensively studied as El Niño, is still enormously challenging. That challenge is made more difficult because El Niño is itself part of our changing global climate. As noted by the Woodwell Climate Research Center's Dr. Jennifer Francis10, we've never had a strong El Niño under such high global temperatures and, perhaps more crucially, record heat content in the oceans. Because our forecasting techniques are operating in uncharted waters, we should perhaps be cautious about our ability to predict El Niño and anticipate its impacts. But if the Pacific does manifest an El Niño by the end of the year, we should appreciate its potential to redraw the global climate map and, to borrow the words of Dr. Francis, to "expect chaos" in its wake.
Footnotes
1. NASA Earth Observatory. La Niña times three. (2022).
2. National Oceanographic and Atmospheric Administration. 2020 was Earth's 2nd-hottest year, just behind 2016. (2021).
3. Lenssen et al. Seasonal forecast skill of ENSO teleconnection maps, Weather and Forecasting 35: 2387-2406.
4. Karnauskas et al. Coupling between air travel and climate, Nature Climate Change 5: 1068-1073. (2015).
5. St. George and Wolfe. El Niño stills winter winds across the southern Canadian Prairies, Geophysical Research Letters 36.
6. Callahan and Mankin. Persistent effect of El Niño on global economic growth, Science.
7. Cooperative Institute for Research in Environmental Sciences. Mining climate models for seasonal forecasts. (2019).
8. International Research Institute for Climate and Society. ENSO forecast. (2023).
9. National Oceanographic and Atmospheric Administration. Model-Analogs (MA) and Linear Inverse Model (LIM) forecasts for Months 1-24. (2023).
10. ClimateGenn. Dr Jennifer Francis– 2023's symptoms of climate chaos, El Niño, ocean heatwaves, and arctic sea ice lows.
Download
The content of this article is intended to provide a general guide to the subject matter. Specialist advice should be sought about your specific circumstances.