

- within Employment and HR topic(s)
- with Senior Company Executives, HR and Finance and Tax Executives
- in Canada
- with readers working within the Business & Consumer Services, Insurance and Healthcare industries
Australia’s labour market is sending clear signals. The question is whether your organisation is reading them in time to act.
The latest Occupation and Industry Profiles, released March 2026 with data through February 2026, bring together the most comprehensive picture of the Australian workforce currently available. Across hundreds of occupations and every major industry, they cover wages, employment growth, workforce age, gender composition, and hours worked.
For leaders responsible for workforce planning, the data is both a diagnostic and a prompt. Whether you are making decisions about hiring strategy, compensation, international talent pipelines, or long-range organisational design, the numbers below are directly relevant, and some of them will be uncomfortable.
The National Baseline
To put your organisation in context, a few figures define the overall workforce picture.
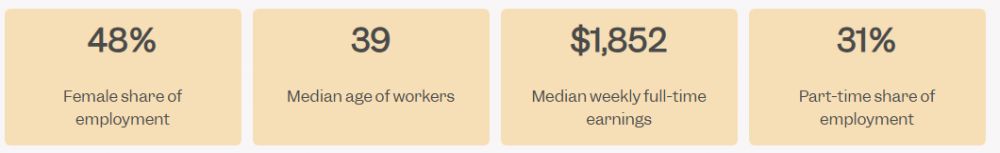
These figures are useful calibration points. If your workforce skews significantly older, more male, or more part-time than the national average, those divergences are worth understanding. They shape where your talent risks concentrate and where your attraction strategy may need work.
The Growth Occupations Are Telling You Where the Competition Is
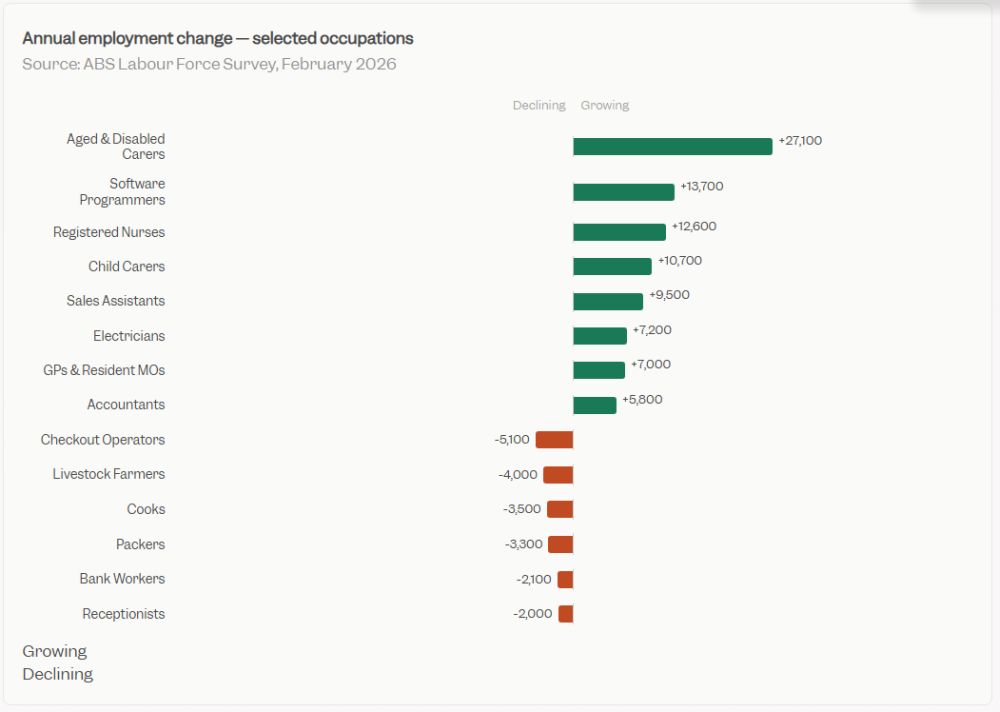
The fastest-growing occupation in Australia right now is Aged and Disabled Carers, which added 27,100 workers over the past year to reach 376,300 employed. Registered Nurses grew by 12,600. Child Carers by 10,700.
This is not a sector-specific story. The care economy is drawing from a shared labour pool, workers who might otherwise be in administration, customer service, or operations support. If you are seeing increased pressure in those roles, the structural shift toward care work is part of the explanation.
The other significant growth story is technology. Software and Applications Programmers added 13,700 workers in a year to reach 203,200 employed, a figure that reflects both sustained demand and a tight supply of qualified candidates. ICT Managers added 4,100 roles and command a median weekly wage of $3,310.
For business leaders considering skilled migration to address technology shortfalls, these occupation figures are directly relevant. Software development, systems administration, and ICT security are among the roles where domestic supply continues to fall short of demand, and where employer-sponsored visas remain a practical option.
On the other side of the ledger, Checkout Operators and Office Cashiers shed 5,100 jobs in the past year. Bank Workers fell by 2,100. Receptionists by 2,000. These are not temporary fluctuations. They reflect automation and structural change, and organisations that still rely heavily on these roles should be actively thinking about workforce transition.
Wages: The Gap Between Industries Is Wide and Widening
The industry earnings data is some of the starkest in the entire dataset, and it has direct implications for retention and recruitment regardless of your sector.
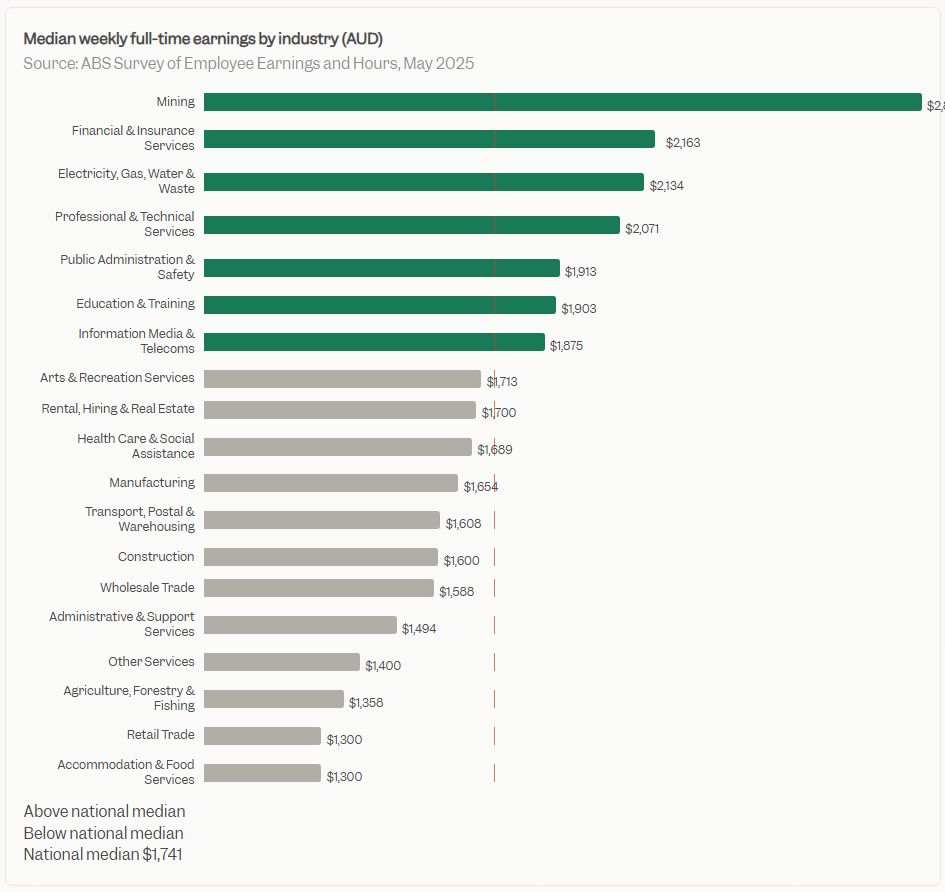
Mining workers earn a median of $2,832 per week, more than double the $1,300 median in both Retail Trade and Accommodation and Food Services. Financial and Insurance Services sit at $2,163 per week. Professional, Scientific and Technical Services at $2,071.
For business leaders in high-wage industries, these figures set a floor your compensation strategy needs to clear. For those in lower-wage industries, they explain why retention is structurally harder. Workers in retail, hospitality, and administration can see clearly what peers in adjacent sectors earn, and the gap is significant enough that non-financial benefits alone rarely bridge it.
Mining workers earn more than double the median wage of workers in retail or hospitality. That gap shapes every retention conversation in lower-wage sectors.
At the occupational level, the premium for specialist roles is striking. Anaesthetists earn a median of $8,293 per week. Surgeons earn $3,905. Outside healthcare, Construction Managers earn $3,751 per week and Engineering Managers $3,519. These are full-time non-managerial rates, genuine market benchmarks rather than executive outliers.
For those benchmarking professional and technical roles against the broader market, the pattern is consistent: mid-tier specialist positions command premiums that have increased meaningfully, and salary expectations from candidates in these fields reflect that. HR Managers earn a median of $2,768 per week, placing the function solidly in the upper third of the earnings distribution, which is useful context when making the internal case for people and culture investment.
The Ageing Workforce: A Succession Risk That Is Already Overdue
Some of the most important data in this release sits in the age profiles, and it deserves more executive attention than it typically receives.
Livestock Farmers have a median age of 60. Beef Cattle Farmers are at 62. Sheep Farmers at 60. Agriculture is facing a generational cliff, with no deep graduate pipeline and limited migration pathways into these specialised roles.
The ageing pattern extends beyond farming. Judges and Tribunal Members have a median age of 60. Crossing Supervisors sit at 64. These are niche occupations, but they illustrate a wider pattern: experience-heavy roles across multiple sectors are held by workers approaching retirement, and succession planning in these areas is already urgent rather than merely important.
For CEOs and COOs thinking about organisational risk, the question is not just demographic. It is about knowledge transfer. Where are the roles in your organisation where a decade of institutional knowledge walks out the door when a senior person leaves? The national data suggests these concentrations are more common, and more imminent, than most succession plans account for.
Full-Time or Flexible: Industry Patterns That Affect Your Talent Pool
Mining is Australia’s most full-time industry by a significant margin, with 95% of its workforce working full-time hours. The nature of the work, remote rosters, shift structures, and site-based operations, makes part-time arrangements the exception rather than the rule.
At the other extreme, Accommodation and Food Services has 61% of its workforce in part-time roles. Retail Trade sits at 50% part-time. Arts and Recreation Services at 48%.
For business leaders, these patterns matter for two reasons. First, the part-time share of a workforce affects your total labour cost structure and your scheduling flexibility. Second, and more importantly for attraction strategy, the flexibility or inflexibility of your industry norm shapes who is available to you as a candidate. Industries with high part-time rates tend to have more women, more younger workers, and more workers managing other commitments. Understanding this shapes how you build an effective employer value proposition.
Twenty Years of Industry Growth and What It Predicts
The industry dataset includes a 20-year employment series, and it is the most valuable tool in this release for strategic workforce planning. Long-run patterns are more reliable than short-term signals, and these are about as clear as data gets.
Health Care and Social Assistance has grown 134% over 20 years, from roughly 1 million workers to 2.4 million today. It is now the single largest employing industry in Australia, representing 16.3% of total employment. Mining has grown 154%. Professional, Scientific and Technical Services has grown 96.5%. Education and Training has expanded 79.4%.
Meanwhile, Information Media and Telecommunications has contracted by 23.6% over the same period. Manufacturing has shed 14.4% of its workforce. Agriculture, Forestry and Fishing has contracted by 16.1%.
The strategic implication is direct: the industries growing now have been growing consistently for two decades. The industries contracting are doing so for structural reasons that have not changed and are unlikely to. If your business sits in a contracting sector, or draws talent from one, the talent pool you compete in is shrinking, and the case for exploring international talent pipelines is stronger than it might appear in a good quarter.
International Talent: What the Occupation Data Tells You
For leaders actively sponsoring overseas workers, or considering whether to start, the occupation and industry data in this release maps closely onto Australia’s skilled migration framework.
The roles with the strongest domestic demand and the most visible supply shortages, including software development, nursing, aged care, engineering, and specialist construction, are largely the same roles that appear on occupation lists for employer-sponsored visas. The wage data matters here too: the Temporary Skilled Migration Income Threshold (TSMIT) sets a floor for sponsored workers, and understanding where your nominated roles sit relative to median market rates is a compliance requirement, not just a planning consideration.
For C-suite leaders, the migration question is increasingly a strategic one rather than an operational one. Tight domestic supply in technology, health, and professional services roles is not a short-term condition. The 20-year industry growth data, the ageing workforce profiles, and the wage premiums in high-demand occupations all point to the same conclusion: international talent is part of a long-term solution, not a stopgap.
A Note on the Data
This February 2026 release is the final update of the ANZSCO-based occupation profiles. The ABS is modernising the Labour Force Survey, and future occupation data will be published under a new classification, the Occupation Standard Classification of Australia (OSCA). New OSCA-based profiles are expected in mid-2026. Planning cycles that rely on occupation-level data should factor in a temporary gap in comparable figures during this transition period.
Ready to Review Your Workforce and Immigration Strategy?
For mid-sized Australian businesses navigating a tightening labour market, a clear-eyed look at your workforce composition, mapped against both the national data and your visa sponsorship options, is a worthwhile exercise. The occupation and industry profiles above give you the external picture. We can help you work through what it means for your organisation specifically.
The content of this article is intended to provide a general guide to the subject matter. Specialist advice should be sought about your specific circumstances.
[View Source]