
- within Corporate/Commercial Law topic(s)
- with readers working within the Oil & Gas industries
- within Accounting and Audit topic(s)
- in Turkey
Data-driven decision making is one of the trends that has been emerging since the early 2000s. In the modern business world collecting business data has become increasingly easy. However, the human mind struggles to comprehend data in a 2-dimensional format, such as an Excel file or database. By providing visual representations for the data through graphs, charts, and maps help to understand the information contained in the data better.
What is the purpose of a Dashboard?
A dashboard is a visual display of the most valuable information, though predefined Key Performance Indicators (KPI). It allows quick visibility into the business and tells a story about business performance.
"The goal is to turn data into information, and information into insight."
- Carly Fiorini (American Business Executive and former presidential candidate)
Having all information in one dashboard saves time by removing the necessity to search for a certain metric in various reports or numerous spreadsheets. The consolidation of business data helps to find trends and identify patterns over time. This allows organizations to capitalize on opportunities or course-correct before issues escalate. Additionally, it offers the possibility of integrating live data. This provides real-time insights, allowing not just reactions to trend analysis, but also for immediate decision-making.
Why BI dashboards are superior to Excel reporting
BI Dashboards are not the only solution to implement data driven decision making. The most popular reporting tool to this day is Microsoft Excel®. However, creating BI dashboards displays significant advantages:
- Data Size and Complexity: BI Dashboards can handle large datasets and complex calculations efficiently without performance issues.
- Data Sources: Easily integrate with various data sources such as databases, cloud services and API (Application Programming Interface). They automatically update with the latest data, ensuring that users always have access to current information.
- Data Visualization (Storytelling): Advanced visualization tools allow to create interactive and dynamic visualizations. These visualizations help in effectively communicating insights to shareholders and tell a data-driven story.
- Collaboration and Sharing: Convenient sharing and cooperation among team members. The dashboard allows for real-time interaction, viewing, and access by multiple users, ensuring that everyone is informed.
- Access Management: The use of permissions also makes it possible to precisely limit user access to content.
Importance of ETL – Extract, Transform & Load
When creating a dashboard, it is essential to recognize the critical role of ETL (Extract, Transform, Load) processes. While dashboards often celebrated for their visual appeal and ability to provide real-time insights, the underlying ETL process is the unsung hero that ensures data quality and reliability. ETL extracts data from various sources, transforms it into a consistent format, and loads it into a centralized repository. This streamlining not only guarantees that the data displayed on the dashboard is accurate and up to date, but it also lays the foundation for robust data management practices.
By implementing a well-structured ETL process, businesses can ensure that their BI dashboards are not only visually impressive but also backed by clean, high-quality data, ultimately leading to more informed decision-making and efficient operations.
Reasons why BI Dashboards are valuable for businesses
The saying of "garbage in – garbage out" holds true when working with data. Even the best though-out and implemented data management strategy might not save businesses from inadequate quality data. The importance of data quality is often overlooked, as it is not deemed important, or it gets lost in "business as usual" activities.
Poor data quality is prevalent in almost all organizations. The problems arise because of ineffective end-user training and incorrect systems configurations. Recent studies from IBM and Cork University have shown that:
- Businesses lose as much as 20% of revenue due to poor data quality
- Employees waste up to 50% of their time dealing with data quality issues
- Only 16% of companies characterize their data in use as "very good"
According to a study cited by NASA, human errors are responsible for 60-80% of failures and incidents in high-risk sectors. Process Automation from data collection until reporting will massively reduce the number of errors and increase precision of reporting:
- BI Dashboards facilitate communication. Cloud based BI dashboards can be shared easily between team members, the user-friendly interface allows non-technical users to get a better understanding of the business process.
- Automated data collection, real-time updates and the automated generation and distribution of reports increases efficiency, and thereby saves time.
- BI Dashboards consolidate data from various sources acting as central source of information. The visualization of patterns and trends improves the data knowledge and understanding even for non-technical users.
- The interactivity of dashboard visuals and filters helps to understand the connection between different parameters. Additionally, drill down capabilities allow a detailed view, into the variety of business processes that can be visualized, this increases visibility and transparency into business processes.
- Identify relevant KPI to track business progress towards goals and objectives. Real-time updates allow the users to always stay up to date, allowing continuous monitoring of current performance.
- BI Dashboards use historical analysis to understand long term trends, data anomalies can be identified quickly through threshold analysis. Get instant notifications when threshold is exceeded.
- Predictive analytics can forecast expected development and thus aid decision makers, combined with statistical analysis this makes for a valid foundation for business decisions.
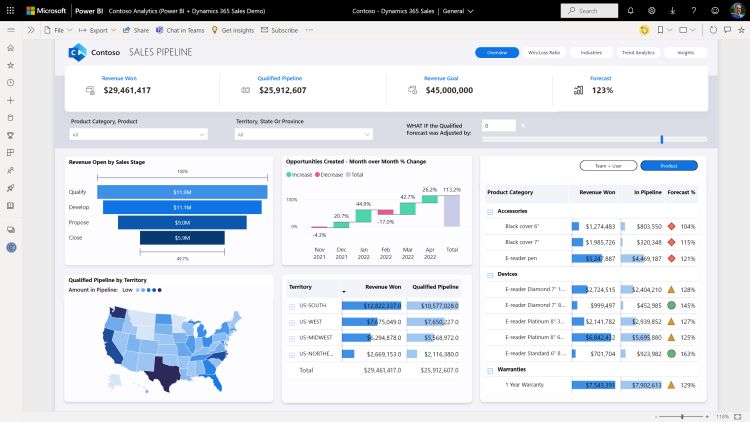
https://powerbi.microsoft.com/en-us/guidedtour/power-platform/power-bi/4/1
Next Steps: Building a Dashboard
Creating an effective dashboard involves several key steps to ensure the final product meets business needs and enhances decision-making. The process begins with a robust ETL process to ensure the accuracy and reliability of the data. Once that foundation is in place, businesses can follow these key steps to develop a dashboard that effectively meets business needs:
- Define Goals and Objectives: Conduction of in-depth interviews to understand processes, identify stakeholders, and alignment of the dashboard goals with businesses strategic objectives.
- Outline Users/Audience and Permissions: Identification of user roles and their data needs to set up the appropriate permission environment, ensuring easy access and a user-friendly service.
- Identify the Right KPI/Metrics: Selection of the right metrics to accurately track business performance, ensuring they align with a deep understanding of the underlying business processes.
- Gather the Data: Review of existing data and integration of data from multiple sources, setting up automated systems to ensure real-time updates on the dashboard.
- Continuous Monitoring: Implementation of the dashboard in the environment, establishing of metrics to track performance, and provide additional documentation, training, and troubleshooting support as needed.
By centralizing and visualizing data in a dashboard, it is possible to enhance clarity and efficiency in various processes such as e.g., reporting, sales, audit tracking, and process mining. Following these steps ensures that the dashboard is both powerful and user-friendly, driving better decision-making and operational efficiency:
- In reporting, the automated data compilation and real-time data updates of a BI dashboard guarantees that the reporting is accurate and timely.
- For sales, BI dashboards help to track important performance metrics and trends, this facilitates data-driven decisions and strategic planning.
- For audit tracking, BI dashboards give a transparent and continuous compliance overview, enabling the identification of inconsistencies and outliers.
- Visualizing process mining in a BI Dashboard allows an overview of the process in different detail. This helps to optimize the operational process, identify bottlenecks, and leads to an overall increase in efficiency.
In recent times, e.g. newly enacted EU laws have increased the demands on business analytics, and BI dashboards can play a crucial role in meeting these requirements. For, e.g. the German Supply Chain Act – a topic of rapidly growing importance – BI dashboards can monitor and ensure compliance with legal requirements related to human rights and environmental standards in the supply chain. This ensures transparency and accountability, helping organizations meet regulatory demands and avoid potential penalties.
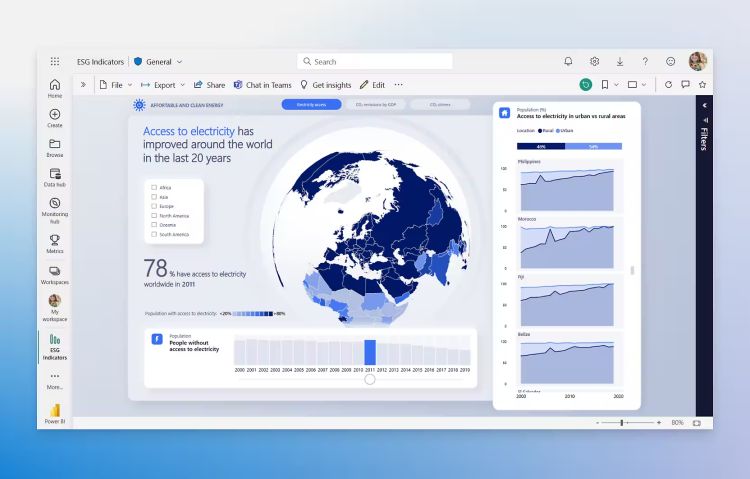
https://www.microsoft.com/de-de/power-platform/products/power-bi
For ESG (Environmental, Social & Governance) tracking, another increasingly critical area, BI dashboards offer a comprehensive view of an organization's sustainability and ethical practices. They track key ESG metrics, allowing companies to monitor their impact, report progress to stakeholders, and make informed decisions to improve their ESG performance.
Summary & Conclusion
BI Dashboards represent an essential tool in modern digitalization efforts, offering a centralized platform to visualize and monitor key performance indicators (KPI). By consolidating data from various sources into one accessible platform, BI dashboards provide a comprehensive view of organizational performance in real-time. This centralized approach not only enhances data visibility but also streamlines decision-making processes by presenting complex information through more intuitive visualizations.
Working with big data comes with bigger challenges than before. It is impossible for a human to scroll and read millions of lines of data. Special software and techniques are needed to aggregate the information, and to make it meaningful. This is where ETL processes come into play. ETL ensures that data is clean, consistent, and readily available for the dashboard, providing a solid foundation for accurate and reliable insights.
Identifying the right KPI is crucial to transform data into valuable insight. With the right KPI, BI dashboards are a powerful tool that offers a great insight into business processes. ETL processes streamline the integration of these KPI, ensuring that the data feeding the dashboard is high-quality and up to date. Consequently, BI dashboards serve as a catalyst for continuous improvement by fostering data-driven decision making.
Beyond traditional business metrics, BI dashboards are increasingly valuable for addressing contemporary issues such as ESG criteria and compliance with regulations like the Supply Chain Act. For ESG, BI dashboards can track metrics related to carbon emissions, energy consumption, diversity, and other sustainability goals, providing transparency and helping organizations meet their ESG commitments. Similarly, BI dashboards can monitor supplier compliance, track the origin of goods, and ensure that ethical standards are maintained throughout the supply chain. By centralizing this data, organizations can more easily identify risks, ensure compliance, and make informed decisions that align with both legal requirements and corporate social responsibility goals.
In conclusion, BI dashboards are not just tools for monitoring business performance but are also essential for addressing and managing the critical and complex challenges of today's business environment.
The content of this article is intended to provide a general guide to the subject matter. Specialist advice should be sought about your specific circumstances.