
- within Corporate/Commercial Law topic(s)
- with readers working within the Retail & Leisure industries
- with readers working within the Retail & Leisure and Securities & Investment industries
- within Employment and HR topic(s)
US Market Review and Outlook
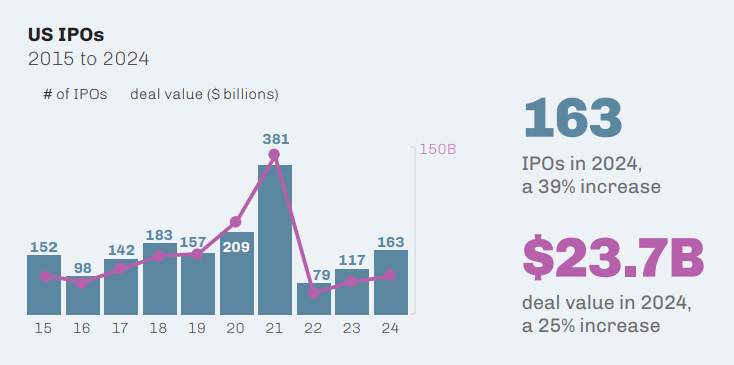
Steady capital market gains, the paring of interest rates by the Federal Reserve, and a decline in inflation all contributed to an environment conducive to increased IPO activity from recent lows.
The number of US IPOs increased in 2024. With 163 IPOs in 2024, deal activity increased by 39% from the 117 IPOs completed in 2023, surpassing the 157 IPOs completed in 2019 before the recent market peak in 2020 and 2021.
Total gross proceeds for IPOs completed in 2024 were $23.7 billion, up 25% from $19.0 billion in 2023. Despite the increase, total gross proceeds in 2024 were still more than $20 billion below the figure for 2019 notwithstanding a comparable number of IPOs in both years.
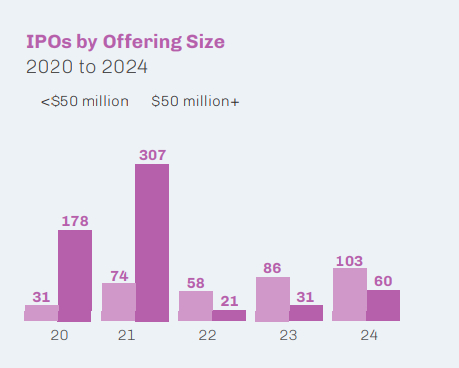
The overall composition of the IPO market as measured by offering size remains very different than five years ago. In 2020, there were 20 IPOs with gross proceeds of less than $25 million, 44 IPOs with gross proceeds between $25 and $100 million and 145 IPOs with gross proceeds of greater than $100 million. By contrast, in 2024, the number of IPOs with gross proceeds of less than $25 million ballooned to 99; IPOs with gross proceeds between $25 and $100 million dwindled to 11; and there were only 53 IPOs with gross proceeds of greater than $100 million.
While the number of IPOs with gross proceeds of greater than $100 million did almost double from the prior year, the 2024 figure is still only half of the median figure (103) for the five-year period from 2017 to 2021.
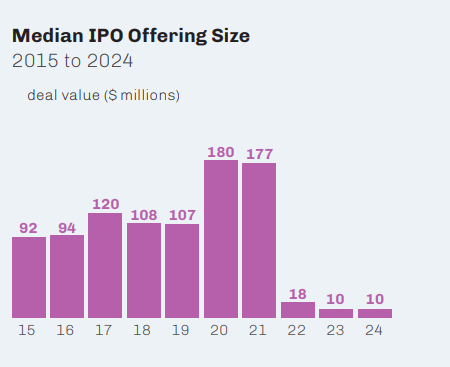
The median offering size for IPOs in 2024 was unchanged from $10 million in 2023 and is a fraction of the $144.2 million median that prevailed over the fiveyear period from 2017 to 2021.
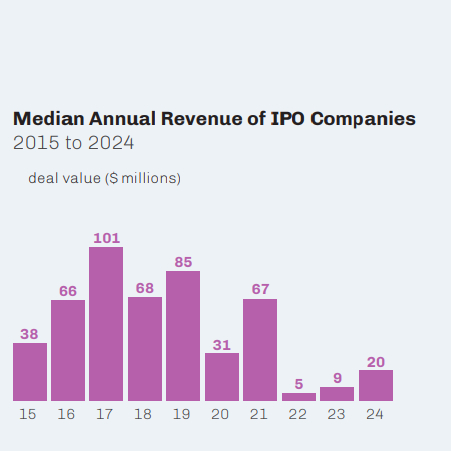
The median annual revenue of IPO companies in 2024 was $19.6 million, more than double the $9.0 million median in 2023, but well below the $66.9 million median that prevailed during the five-year period from 2017 to 2021.
In 2024, 45% of life sciences IPO companies had revenue, up from 33% for 2023 and almost identical to the figure (46%) for the five-year period from 2017 to 2021.
The median annual revenue of non-life sciences IPO companies in 2024 was $29.0 million, up by almost one-third from $21.9 million in 2023, but well short of the $192.7 million median from 2017 to 2021.
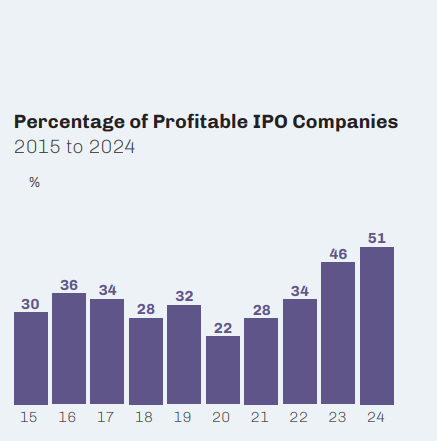
The percentage of profitable IPO companies increased to 51% in 2024 from 46% in 2023 and from 28% of all IPO companies between 2017 and 2021. Three of the 31 life sciences IPO companies in 2024 (10%) were profitable, compared to 61% of the non-life sciences IPO companies—the highest percentage for non-life sciences IPO companies since 2012.
Looking at just those IPOs with gross proceeds of at least $100 million, three of the 18 life sciences companies in 2024 (17%) were profitable, compared to 49% of the nonlife sciences companies.
IPOs by emerging growth companies (EGCs) accounted for 90% of the year's IPOs, compared to 91% in 2023 and the 89% average that has prevailed since enactment of the JOBS Act in 2012.
There were four billion-dollar IPOs in 2024, led by the $1.54 billion offering by Viking Holdings and the $1.44 billion offering by StandardAero. The 2024 billion-dollar IPO count is well below the 20 billion-dollar IPOs in 2020 and 26 in 2021 but also trails the nine in both 2018 and 2019.
The number of IPOs with gross proceeds of at least $500 million compares more favorably. Those increased from seven in 2023 to 15 in 2024; and the 2024 count trails the median over the ten-year period from 2012 to 2021 of 19 by only four.
The median IPO company in 2024 ended its first day of trading up less than one percent from its offering price. In comparison, the median IPO company in 2023 ended its first day of trading unchanged from its offering price. Over the five-year period from 2017 to 2021, the median IPO company produced a first-day gain of 13%.
DIRECT LISTINGS
There was a single direct listing in 2024, down from four in 2023. In total, there have been less than 20 direct listings since 2018—the year of the first direct listing (Spotify). Direct listings will continue to be a relevant option for well-established companies that seek to provide liquidity for existing shareholders but do not require an infusion of new capital because the listed shares are sold by existing shareholders.
There were five "moonshots" (IPOs in which the stock price doubles on the opening day) in 2024, compared to six in 2023. Mirroring 2023, only one of 2024's moonshot IPOs ended the year above its offering price. The other four ended the year down a median of 84% from their offering price.
The percentage of "broken" IPOs (in which the stock closes below the offering price on the first trading day) declined to 42% in 2024 from 50% in 2023. In comparison, 24% of IPOs over the five-year period from 2017 to 2021 were broken. A slightly higher percentage of 2024 life sciences IPOs (45%) than non-life sciences IPOs (41%) were broken.
2024 IPO companies ended the year trading a median of 17% below their offering price. While this represents an improvement from the statistics for 2022 (the median decline from offering price to end of year was 55%) and 2023 (a 56% median decline), these returns stand in contrast to performance in the stock market at large, where the Dow ended 2024 up 13%, and the Nasdaq and S&P 500 were up 29% and 23%, respectively.
Closer examination of the 2024 IPOs, however, yields a more nuanced picture. The median 2024 IPO company that raised gross proceeds of less than $25 million (99 companies) ended the year down 44% from its offering price. The median 2024 IPO company that raised gross proceeds of at least $100 million ended the year with a gain of 7%, IPOs with gross proceeds of at least $200 million ended the year with a median gain of 19%, and IPOs with gross proceeds of at least $500 million ended the year with a median gain of 62%.
The year's best-performing IPOs were by Nano Nuclear Energy (trading 522% above its offering price at yearend), Reddit (up 381%), Unusual Machines (up 321%), LandBridge (up 280%) and Astera Labs (up 268%).
At the end of 2024, only 36% of all the year's IPO companies were trading above their offering price. For IPOs with gross proceeds of less than $25 million in 2024, 74% were trading below their offering at year-end. Larger IPOs fared better. 56% of IPOs that raised gross proceeds of at least $100 million in 2024 were trading above their offering price at year-end and 77% of IPOs that raised at least $500 million were trading up.
To view the full article click here
The content of this article is intended to provide a general guide to the subject matter. Specialist advice should be sought about your specific circumstances.