

- in United States
Inside this issue...
The electronic contract manufacturing services (ECMS) sector saw lackluster equity performance throughout 2024, despite a banner year for the broader S&P 500 market. Public equity investor sentiments were mirrored by a lull in M&A activity. ECMS equities outperformed public markets throughout the first half of 2023, largely driven by gains in the medical device segment, but have failed to keep up with the wider market bull run since. Overall sentiment of industry participants continues to be cautious or pessimistic, with 42% of participants reporting declining profit margins – compared with 10% reporting margin expansion, and 50% of participants citing rising labor costs as a key factor.
ECMS M&A transaction volume in 2024 declined modestly from 2023, decreasing 7% year-over-year. As large publicly traded electronic contract manufacturers have seen steady multiple expansion since 2022, middle market players have faced increasing waves of competitive pressure around new customer acquisition and bargaining power vis-à-vis suppliers. As pressure mounts for middle market companies, some have reached distress scenarios and have been acquired by larger competitors, who have used their more stable balance sheets to strengthen their market position. As economies of scale continue to influence industry dynamics, intra-industry M&A activity continues to be a viable option both for struggling smaller players, as well as expansionary larger players in a consolidating industry environment.
Despite optimistic public trading activity, lighter valuations in the private lower middle market have discouraged smaller players from seeking M&A transactions where not essential. Lessening ECMS transaction volume in recent years can also be attributed to a higher interest rate environment and larger players continuing to tighten their belts following a flurry of M&A investments in 2021, some of which left buyers disinclined towards future M&A activity.
The Technology Design & Manufacturing Service (TDMS) subvertical of the broader ECMS space has continued to attract interest from buyers. Industry shifts toward Internet of Things (IoT) connectivity has continued to drive demand for TDMS company outputs, with larger ECMS players placing a premium on TDMS companies given their specialized highertouch capabilities. TDMS sector stocks underperformed the S&P 500 in 2024, rising 1.8% versus a 24.0% increase for the broader market. Price to Earnings ("P/E") ratios were led by the Healthcare / Life Sciences end market at 38.4x valuation versus the broader TDMS Index valuation of 26.7x
SECTOR M&A ACTIVITY
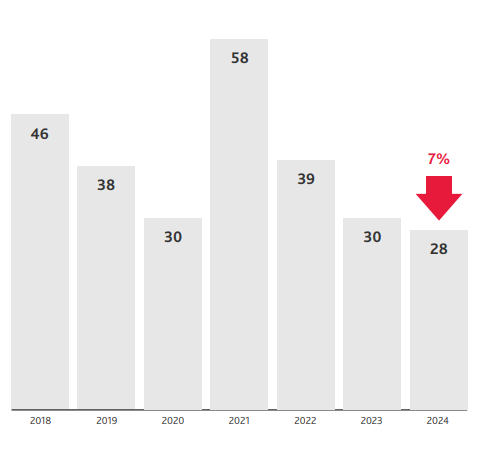
M&A Transaction Volume: U.S. Electronic Contract Manufacturing Services Industry
- Activity in the U.S. ECMS M&A market has cooled over the past two years, coming out of a solid 2022 and an especially robust year in 2021, which saw the closing of a glut of pent-up transactions, stalled during 2020 due to COVID. From 2018 to 2024, the average annual transaction volume was 39.
- Total 2024 transaction volume stood at 28 transactions, a 7% decrease year-over-year.
Source: S&P Capital IQ
EQUITY TRADING TRENDS
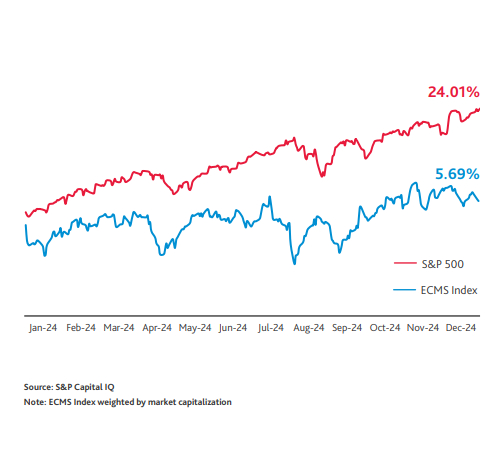
S&P 500 vs. Electronic Contract Manufacturing Services Index
Commentary
- The ECMS Index gained approximately 6% in 2024 compared to a gain of 24% in the S&P 500.
- Despite strong ECMS sector public equity performance in 2021, driven by margin expansions related to global trade interruptions and shortages of electronic goods, the sector has overall lagged the broader S&P 500 index from 2022 onwards.
- As international trade has normalized and heavy investments in manufacturing capability have come on-line, declining margins have driven investor skepticism in the sector.
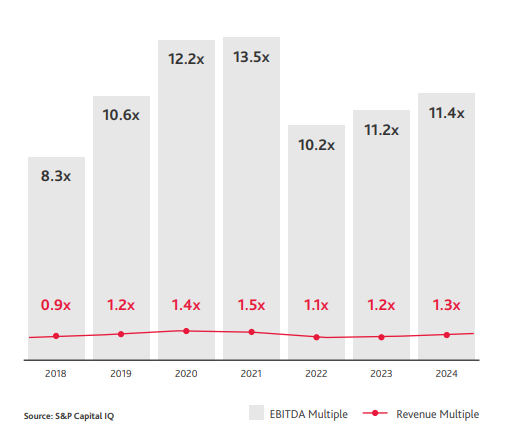
Electronic Contract Manufacturing Services Public Trading Multiples
Commentary
- Poor stock performance and fears of a recession put a damper on trading multiples in 2022, with the ECMS Index declining to 10.2x EV/ EBITDA. Multiples have continued to rebound throughout 2023 and 2024, but remain shy of 2021 highs.
- The average EV/EBITDA trading multiple of 11.4x at 2024 yearend represents a continued increase from 2023, in line with broader public equity multiple expansion.
- 2024 EV/EBITDA trading multiples were led by the Healthcare / Life Sciences end market at 17.9x.
EQUITY TRADING OVERVIEW
The ECMS industry has five distinct end markets including Automotive, Communications, Consumer, Healthcare / Life Sciences, Industrial, and Aerospace & Defense. The ECMS Index has seen a 24 month decrease in revenue of (0.1%), driven by declines in the Communications (-10.7%) and Industrial, Aerospace & Defense (-10.1%) end markets. Yearend 2024 EV/EBITDA multiples stood at an average of 11.4x, led by Healthcare / Life Sciences (17.9x) and Consumer (12.8x). On a P/E basis, the Healthcare / Life Sciences end market leads the broader Index at 38.4x versus 23.3x overall.
Key Trading Statistics

SECTOR SPOTLIGHT: TECHNOLOGY DESIGN & MANUFACTURING SERVICE COMPANIES
A notable sub-sector of the broader ECMS space is the Technology Design & Manufacturing Service (TDMS) vertical. In addition to offering contract manufacturing services, these organizations often function as turnkey solution providers. TDMS companies assist customers with all stages of the product lifecycle, including design & development, manufacturing, and aftermarket services.
TDMS companies have historically traded at a premium to the ECMS space, given the bespoke services they can provide customers. By offering cutting edge design services, TDMS companies de-commoditize the typical outsourced manufacturing process. This paves the way for stickier relationships with customers that are underpinned by innovation via design partnerships, rather than manufacturing bandwidth and legacy product assembly.
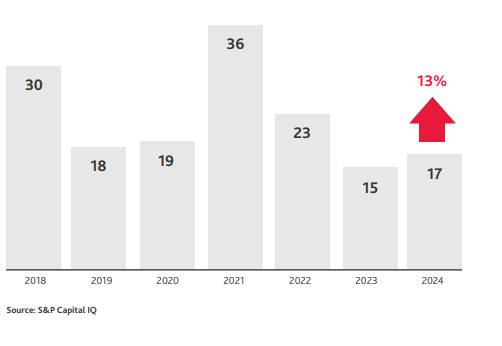
M&A Transaction Volume: U.S. Technology Design & Manufacturing Service Industry
Commentary
- Between 2018 and 2024, approximately 59% of all ECMS transactions were companies in the TDMS vertical.
- TDMS transactions increased 13% from 2023 to 2024 despite an overall decrease in ECMS M&A, as buyers have prioritized the more specialized capabilities of smaller TDMS competitors
SECTOR SPOTLIGHT: TECHNOLOGY DESIGN & MANUFACTURING SERVICE COMPANIES
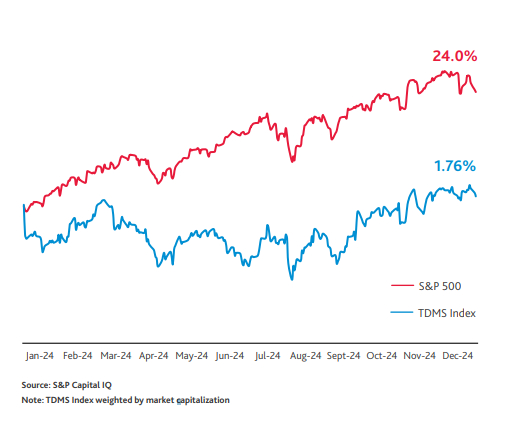
S&P 500 vs. Technology Design & Manufacturing Service Companies Index
Commentary
- TDMS equities rose approximately 2% in 2024 compared to a gain of 24% in the S&P 500 during the same period.
- In 2024 the TDMS end markets with the highest percentage share price increases were Healthcare / Life Sciences (+32%) and Industrial (+21%) though these gains were largely negated by losses in the Automotive segment (-31%).
- Gains in the TDMS index during Q4 2024 were driven by the Consumer sector which rose +15% during that time period.
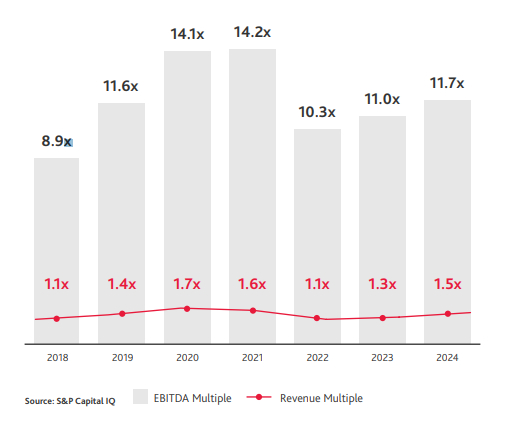
Technology Design & Manufacturing Service Companies Index Multiples
Commentary
- TDMS companies have historically garnered higher valuations than traditional ECMS providers due to their value-added design capabilities. From 2018 - 2024, TDMS companies traded on average 0.6x higher than the broader ECMS market.
- The average EV/EBITDA trading multiple as of December 2024 increased to 11.7x from 11.0x in 2023, an increase of approximately 7%
- 2024 EV/EBITDA trading multiples were led by the Healthcare / Life Sciences end market at 17.9x.
SECTOR SPOTLIGHT: TECHNOLOGY DESIGN & MANUFACTURING SERVICE COMPANIES
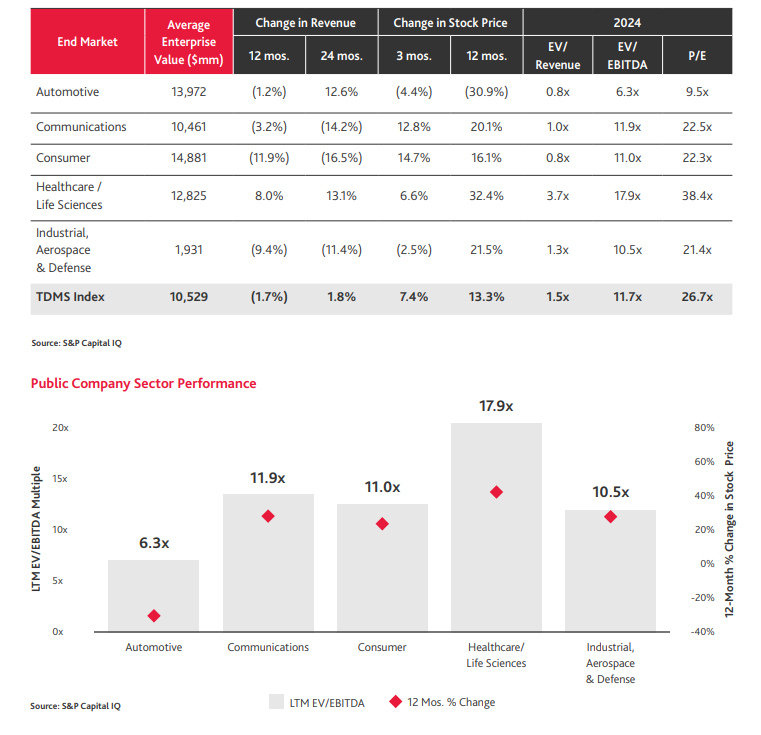
The TDMS Index is broken into five end markets including Automotive, Communications, Consumer, Healthcare / Life Sciences, Industrial, and Aerospace & Defense. The TDMS Index has seen a 24 month increase in revenue of 1.8%, driven by the Healthcare / Life Sciences (+13.1%) and Automotive (+12.6%) end markets with downturns in the Consumer segment (-16.5%). At yearend 2024, TDMS EV/EBITDA multiples averaged 11.7x, led by the Healthcare / Life Sciences (17.9x) and Communications (11.9x) sectors. On a P/E basis, the TDMS Index traded at 26.7x, led by the Healthcare / Life Sciences (38.4x) end market.
Equity Trading Statistics
BDO CAPITAL ADVISORS SERVICES
Sellside Advisory
- Company Sales
- Family Businesses
- Entrepreneur-Owned Companies
- Recapitalizations / Private Equity
- Partial / Minority Sales
- Corporate Carve-Outs
- Cross-Border Transactions
- ESOPs
Buyside Advisory
- Valuation
- Structuring
- Negotiation
- Acquisition Financing
- Management Buyouts
- Acquisition Search
ESOP Advisory
- Feasibility, Valuation and Tax Analyses
- Assistance with the Selection of an ESOP Trustee
- Capital Raising for Leveraged ESOPs
- Benefit Plan Design and Analyses*
- M&A Comparative Analyses
- Tax and Accounting*
- Plan Administration*
Capital Raising
- Capital Raising
- Debt
- Mezzanine
- Equity
*Services provided with the assistance of BDO USA, P.C.
The content of this article is intended to provide a general guide to the subject matter. Specialist advice should be sought about your specific circumstances.
