Market Trends:
- 2021 U.S. PE Market Trends in Review
- Goodwin Private Equity Deal Database - Reverse Break Fees
- R&W Insurance - Rate on Line and Insurer Appetite
Key Transaction Considerations:
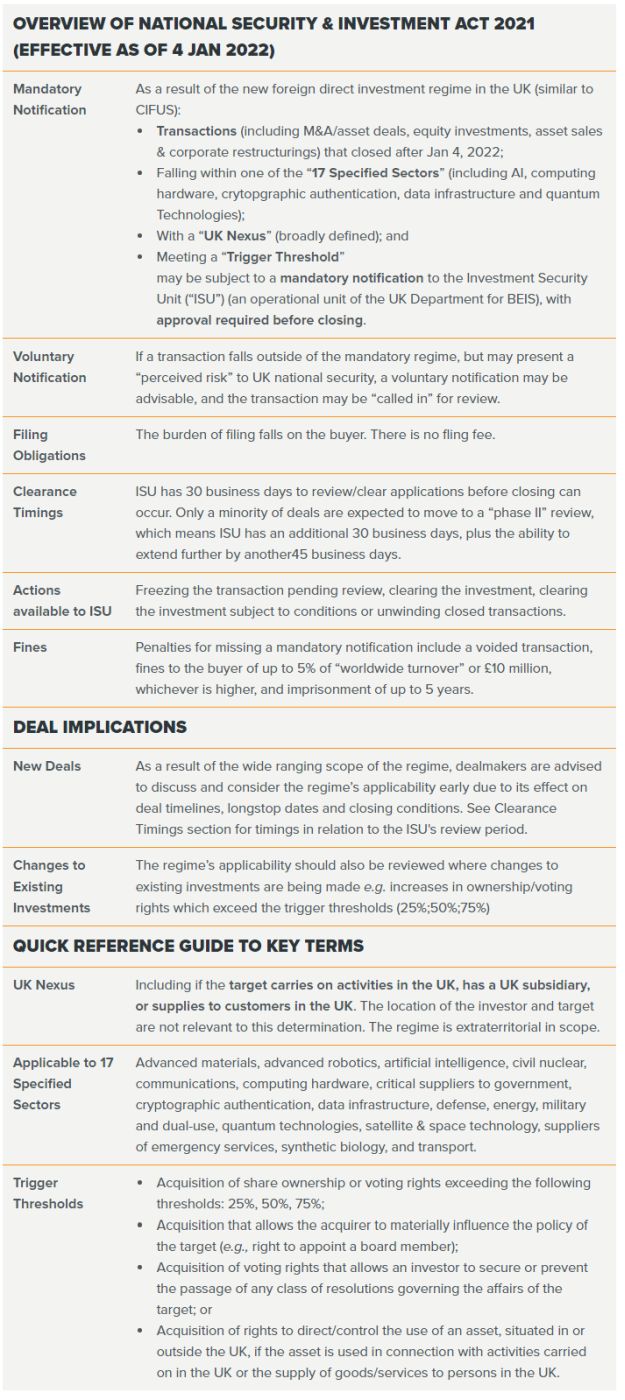
- Impact of New UK Foreign Direct Investment Regime on U.S. Transactions with UK Nexus
- Changes to HSR Thresholds Announced
- ESG Data Convergence Project formed by LPs and GPs representing $4 trillion in AUM
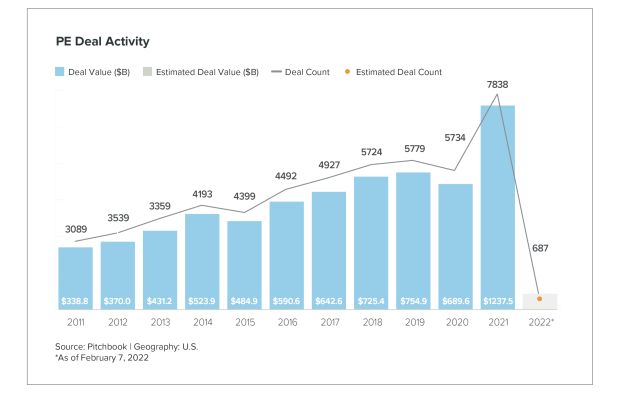
2021 PE Market Trends in Review
U.S. private equity dealmaking in 2021 set several new highs totaling $1.2 trillion,1 and is anticipated to continue in 2022, due to increased capital allocations to private equity.
M&A Drivers: Low interest rates; cheap LBO financing; potential changes to capital gains tax; desire to deploy capital to raise additional funds and high exit valuations.
M&A Challenges: Inflation; labor shortages; supply chain bottlenecks; regulatory headwinds; competition for assets and uncertainty due to the ongoing pandemic.
Investment Strategy: Private equity add-ons and buy and build strategies remained popular due to the attractiveness of multiple arbitrage and high valuations, representing 67.9%2 of middle market deal flow. In healthcare, fintech and financial services, the proportion was even higher.3
Exit Activity: Public markets remained buoyant and the number of U.S. private equity-backed middle market exits via IPO increased significantly - from 13.64% in 2020 to 21.17% in 20214. IPO exit valuations grew the most compared to all other exit types5.
To view a larger version, please click here.
Goodwin Private Equity Deal Database
- Launch: In order to continue leveraging our unique and unparalleled view of the market, we have recently updated and upgraded the way we analyze our transaction and market data via the Goodwin Private Equity Deal Database. Our database tracks deal terms for U.S. private M&A transactions completed and advised upon by the Goodwin Private Equity Group over a rolling 18-month period so as to continually remain reflective of the latest market terms. As of today, the Goodwin Private Equity Deal Database reflects an aggregate transaction value of $59 billion across 200+ deals and approximately 147 clients, with an average transaction size of $285 million.
- Terms Tracked: The terms tracked reflect the complexity of our private equity M&A/buy-out deals, and include rollover terms, earnout metrics, purchase price adjustment mechanics, closing conditions, use of R&W insurance, post-closing remedies, and many more.
- Data Utilization: Our database provides pinpointed data and analytics to inform deal negotiations and the identification of market updates and trends in real time.
- Current Market Insights:
-
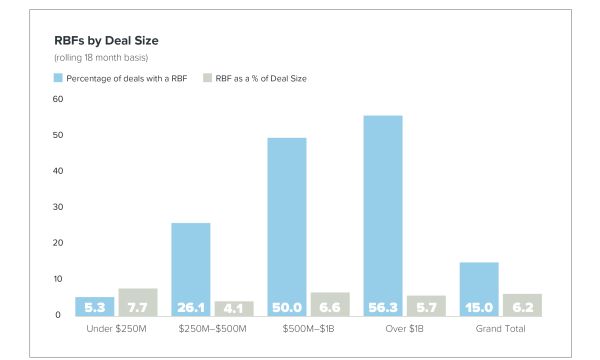
- Reverse Break Fees ("RBFs") paid by buyers are commonly found in private equity M&A/buy-out deals, and our data shows that their frequency greatly increases with the increase in deal size.
- The Average RBF size across all deals was 6.2%6, with some variation in this percentage when looking at the data by deal size. (see the RBF graph below for a detailed breakdown).
To view a larger version, please click here.
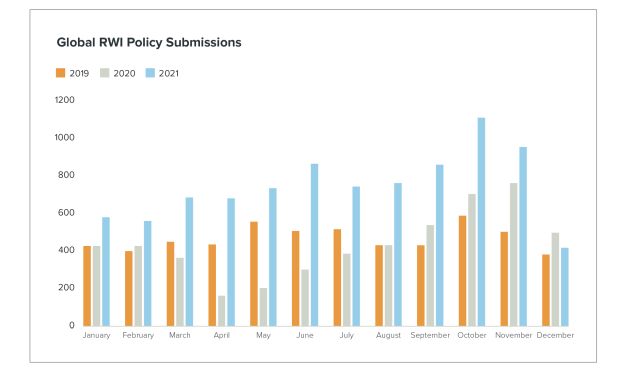
R&W Insurance
The record volume of M&A deals seeking R&W insurance in 20217 shifted the market dynamic from one in which multiple insurers competed to insure a deal to one in which numerous deals competed over insurers' bandwidth. While the ROL ("rate on line", i.e., premium divided by the policy limit) was still in the 3% range at the beginning of 2021, as the year went on, it climbed into 4% and 5% ranges (or even higher) with a wider pricing spread.
The reduced number of quotes received per deal tended to limit buyers' ability to avoid higher pricing or more conservative coverage terms in quotes, while the outcome of the underwriting process stayed the same as before. Toward the end of the year, smaller deals (e.g., sub-$50 million) and healthcare deals, among others, were more likely than before to forego R&W insurance and revert to a traditional indemnity structure.
To view a larger version, please click here.
Since the new year, the market dynamic is beginning to improve. Internally, some insurers have reset8 on pricing and terms, and externally a higher number of quotes per deal is creating greater competition and more choices for the buyer.
Key Transaction Considerations
M&A: Effect of New UK Foreign Investment Regime - U.S. Transactions with UK Nexus in Specified Sectors.
Anti-trust: 2022 HSR Thresholds Announced
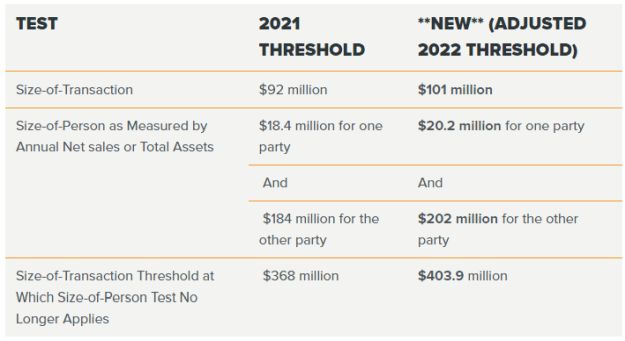
As required by the HSR Act, on January 21, 2022, the U.S. Federal Trade Commission released its annual adjustments to the reporting thresholds. Generally, transactions valued in excess of $101 million must be reported and cleared by federal antitrust authorities before the transaction may close. This is an increase from the $92 million threshold in 2021. The new thresholds will become effective on February 23, 2022. The revised thresholds will apply to all transactions that close on or after the effective date.
Below are the current and new thresholds:
The current premerger filing fee schedule is:
- $45,000 for transactions valued in excess of $101 million, but less than $202 million;
- $125,000 for transactions valued at $202 million or more, but less than $1.0098 billion; and
- $280,000 for transactions valued at $1.0098 billion or more.
The interlocking directorate thresholds under Section 8 of the Clayton Act have also been adjusted to account for changes in the gross national product (unlike the HSR Act thresholds, these adjusted thresholds take effect immediately). Section 8 may preclude a person from serving as an officer or director of two competing corporations when (1) each of the competing corporations has capital, surplus, and undivided profits aggregating more than $41,034,000, and (2) each corporation's competitive sales are at least $4,103,400.
ESG Transaction Considerations: Private Equity Coalition advances Data Convergence Project
For the first time, a number of global LPs and GPs (representing more than $4 trillion in AUM) have partnered to create the ESG Data Convergence Project hosted by ILPA, with the aim of "streamlining the private equity industry's historically fragmented approach to collecting and reporting ESG data in order to create a critical mass of meaningful, performance-based, comparable ESG data from private companies."9 The industry collaboration was led by CalPERS and Carlyle, participating LPs include AlpInvest Partners, APG, CalPERS, CPP Investments, Employees' Retirement System of Rhode Island, PGGM, PSP Investments, The Pictet Group, Wellcome Trust. Participating GPs include: Blackstone, Bridgepoint Group Plc, CVC, EQT, AB, Permira, and TowerBrook. To learn more about the collaboration, its reporting framework, metrics and the data collection process, click here to access the full Goodwin SG update.
2022 Private Equity Rollover and Incentive Equity Terms Survey
Periodically since 2013, we have surveyed sponsors in the middle market relative to their practices with rollover investments and equity incentive plans, two key parts of winning and structuring deals. The central idea of the survey is that there are many studies of M&A terms that are cited to make sure parties are acting within the bounds of normal M&A behavior, but very little market feedback on what is "market" in the important areas of equity rollovers and management equity inventive pools.
We are conducting the survey again this year, and would very much appreciate it if you would complete the confidential survey (or have someone at your firm complete it) by clicking here. A copy of our 2018 survey is available here. We will be sure to send you the results of this year's survey when completed. Thank you in advance for your on help on this, and we look forward to working with you in the year to come.
Footnotes
1. Source: PitchBook.
2. Source: PitchBook US PE Middle Market Report, January 11, 2022
3. Source: US PE Middle Market Report: Q3 2021
4. Source: PitchBook data.
5. Source: PitchBook Quantitive Perspectives: US PE: Recovery & Beyond: Q4 2021 (pg32)
6. Note: Based on rolling 18 months.
7. Source: Euclid Transactional. Data includes ex-US deals.
8. Goodwin In-house R&W Team
9. https://ilpa.org/ilpa_esg_roadmap/esg_data_convergence_project/
The content of this article is intended to provide a general guide to the subject matter. Specialist advice should be sought about your specific circumstances.
