This report has been reprinted from the 2006 report by Stores Magazine. STORES is the magazine of the National Retail Federation (NRF), the world’s largest retail trade association.
Beyond retail therapy
Managing risk and reward: New challenges for retail leadership
Deloitte, in conjunction with Stores Magazine, are pleased to present the ninth annual Global Powers of Retailing. This report identifies the 250 largest retailers around the world based on publicly available data for the companies’ fiscal year 2004 (July 1, 2004 – June 30, 2005). It also provides an outlook for the global economy and an analysis of retail stock price performance. New this year is a discussion of the major risks facing today’s retailers.
The global economy has continued to perform reasonably well, lifting retail sales and profitability. However, heightened concern about the growing risks facing retailers is changing the management agenda from one of managing for profitable growth to one of managing and mitigating risk. A whole portfolio of risks is making global sourcing and operations not only much more complex, but also much more precarious. As a result, there is growing awareness among senior management and corporate directors in the retail industry – whose risk management agendas have heretofore been focused primarily on financial integrity issues – of the non-financial risks confronting their organisations.
As retailers raise their exposure in global markets, they must contend with the many inherent and well-known problems of doing business in international markets, including currency fluctuations, reporting and tax rules, poor infrastructure, potential for sudden political change, and uneven economic growth. Long-distance sales and distribution processes become more difficult to manage. Local consumer preferences need to be considered. Barriers to entry need to be overcome.
However, retailers also face increasing risks in other areas that are less well-recognised or understood. The nature of global commerce now requires retailers to take into consideration a number of serious issues that did not exist, at least not on the same scale, only a few years ago. Being a good global citizen – minimising a company’s impact on the environment and maximising benefits to the communities in which it operates – is becoming an increasingly important topic on the corporate risk management agenda. Food safety concerns and product counterfeiting are having significant repercussions throughout the global supply chain. The proliferation of own brand products is requiring retailers to take on financial and reputation risks associated with their private brands. Retailers with strong brand names and global profiles are at greater risk from terrorists and must develop plans for business continuity should an attack occur. Being big in itself means closer scrutiny of operations from the outside, including being subject to increasing anti-trust legislation and shifts in public perception. All of this added "sand in the gears" will make the achievement of profitable growth much more difficult for retailers in the years ahead. The cost of managing risk will be high, which will eat into short-term profits. In the longer term, greater risk aversion will likely inhibit growth. Retailers that don’t take the risks will not reap the rewards.
To succeed in this intensely competitive and increasingly consolidated marketplace, the world’s leading retailers will need powerful brands, compelling consumer value propositions, sophisticated customer management systems, and flexible and efficient supply chains that will allow them to take advantage of global expansion opportunities. Equally, if not more important, they will need strong risk management skills to navigate the minefields as globalisation adds ever greater complexity to the retail business model.
Global powers top 250 highlights
Global economy remains buoyant
The global economy remained relatively strong in fiscal 2004, the financial period covered in this year’s report on the world’s 250 largest retailers. Many markets saw big increases in home prices that added to consumer perception of wealth. This stimulated spending – especially home-related spending – contributing to retail strength. Inflation remained low in most parts of the world.
The resilient US consumer continued to spend, with rising home values providing a boost. A big increase in exports gave the Japanese economy a much needed lift in 2004, leading to a pick-up in consumer spending. The UK economy remained strong in 2004, although it has slowed over the past year. Among the emerging markets, the big ones did mostly quite well. China, India and Russia all experienced robust consumer spending growth. Continental Europe, which saw slow growth and high unemployment persist, remained the major exception to an overall buoyant global environment for retailing.
Sales and profits for the top 250 retailers generally improved over 2003 results. As a group, retail sales totaled $2.84 trillion in fiscal 2004, or nearly one-third of an estimated $9 trillion global retail marketplace. This represents an increase of 8.9% over the top 250’s prior-year sales. The average profit margin for the 187 companies that disclosed their net income/loss figures was 2.7%. Among the 170 companies that were profitable, net income averaged 3.6% of sales in fiscal 2004, up from 3.3% the prior year.
To earn a spot on this year’s list, a company needed retail sales of at least $2.3 billion, up from last year’s $2.2 billion. The list continues to be dominated by Wal-Mart, which alone accounted for 10% of the top 250’s combined sales. While Wal-Mart’s $285 billion in retail sales is more than three times the size of its biggest rival (Carrefour), competition for a spot toward the bottom of the list remains intense. The largest retailers continue to increase their market share, albeit more modestly than in prior years. The top 10 generated combined sales of $817 billion, or 28.8% of the top 250’s total sales. This compares to 28.4% last year.
As the big get bigger and their market penetration increases around the globe, competition among the major players is having a significant macro-economic impact. Intensifying competition is exerting downward pressure on prices. In addition, these companies are reinvesting the cost savings resulting from increased scale and efficiency improvements to reduce retail prices. The decline in overall consumer prices means a substantial increase in consumer buying power. Continued expansion by the leading global retailers is also having a big impact on the supplier base. Suppliers are being forced to consolidate and rationalise their brand portfolios in an effort to operate more efficiently.
Tesco and Costco continue to climb
The top 10 retailers remain the same as last year with a slight change in the order. Tesco, which rose to 6th place in 2003 from 8th place the year before, climbed another notch to surpass Kroger at No.5 on the list. Costco ascended the ranks from 9th place to 7th, moving ahead of Target and Ahold. Target’s drop is due to the sale of its Marshall Field’s and Mervyn’s department store divisions. Troubled Dutch retailer Ahold continues to sell off numerous operations around the world in a bid to remain competitive.
The merger of Sears and Kmart, which was finalised in March 2005, is not reflected in this year’s ranking, where the companies are listed separately. After being absent from the top 10 for several years, the combined companies are expected to return next year as Sears Holdings Corp.
Mergers and acquisitions shake up rankings
Among the rest of the top 250, there was considerable movement in the ranks. Fifty-three retailers improved their ranking by more than 10 places. Most of this was achieved through merger and acquisition activity, which generated large sales gains for the acquiring companies. For example, Canadian drug store retailer Jean Coutu Group benefited from the acquisition of the 1549-store Eckerd chain from J.C. Penney in August 2004. UK supermarket retailer Wm. Morrison more than doubled in size from its March 2004 acquisition of Safeway Plc. In both of these examples, as well as many others, sales growth came at a price. Earnings were hit hard by integration and conversion costs, and the companies have struggled to extract maximum value from their acquisitions.
Currency appreciation against the US dollar also played a role in shaking things up. In 2004, the dollar fell against the euro and the British pound, leading to increased dollar-based sales and thus higher rankings for European retailers. Twenty-two (42%) of the big gainers are European companies.
Fastest-growing companies are small, focused
A review of the fastest-growing retailers over the 1999-2004 period shows that strong growth doesn’t necessarily equate with being a global player. Nearly two-thirds of the 50 fastest-growing retailers operate in only one or two (generally contiguous) countries. For the most part, these companies have not yet faced saturation in their domestic markets.
Because it is easier to post rapid growth from a smaller base, most of the 50 fastest-growing retailers can be found in the top 250’s bottom half. Only 15 are among the top 100 largest retailers, with Schwarz Group (Lidl), at No.11, the only one whose entry into the top 10 appears imminent. Compared to the top 250 as a whole, these fast-growing companies tend to be more focused, often operating only a single retail format such as drug stores, supermarkets, convenience stores, or specialty stores.
On average, the 50 fastest-growing retailers saw sales increase at a compound annual rate of 23.8% from 1999-2004, compared with 8.4% for the top 250 as a whole. For the ten fastest-growing retailers, sales soared 41% per year. In contrast, the ten largest retailers grew only 8.3% per year – on a par with the top 250 average. At this rate, it is only a matter of time before some of these rising stars join the ranks of the top 10.
US dominance waning
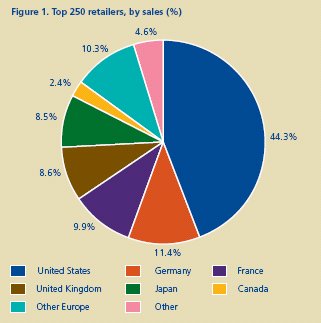
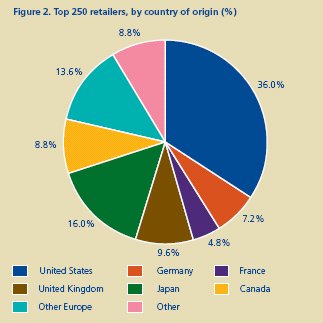
The top 250 are a geographically diverse group, based in 27 different countries. US-based retailers continue to dominate the list, with 90 companies representing 36.0% of top 250 retailers and 44.3% of top 250 retail sales volume. However, the US share of both measures is down from previous years.
Japan, the world’s second-largest retail market, is home to 40 of the top 250 retailers. Most of these retailers are relatively small, falling in the bottom half of the list, and many operate only in Japan. Despite Japan’s large and well-developed retail sector, most of these companies will not be able to rely on their depressed domestic retail market for continued growth.
Europe’s largest economies account for a significant number of top 250 retailers: 24 are based in the UK, 18 in Germany, and 12 in France. French and German companies tend to be larger with their share of sales far exceeding their share of companies. Anemic consumer spending and intense competition, coupled with a tough regulatory environment, have forced these retailers to look beyond their domestic borders for growth.
As US dominance wanes, a number of countries can be expected to make incremental gains in the years ahead. China, in particular, will likely have an increasing presence on the top 250 list as its domestic retailers expand through both organic growth and acquisition in an effort to impede foreign competition.
Global retailers in food fight
The predominant operational formats continue to be food-related. Nearly 60% of the top 250, and nine of the top 10 retailers, sell food, with most operating a variety of formats including supermarkets, hypermarkets/supercenters, hard discount stores, cash & carry/warehouse clubs, and convenience stores.
Although saturated in certain markets, hypermarkets/supercenters remain a leading format with considerable potential in emerging economies. Discount stores have continued their rapid expansion, following the hypermarkets and forcing them to lower their prices. Convenience stores are also registering robust growth. As a result, supermarkets, the most popular format among the top 250 retailers, are starting to feel the squeeze from the proliferation of both larger and smaller formats.
Over half of the top 250 operate specialty retailing concepts. In particular, retailers specialising in homegoods categories have flourished as a strong housing market and a burgeoning middle class around the world boost demand for consumer electronics, home improvement products and services, and home furnishings.
Multi-channel retailing continues to grow, with more retailers developing an e-commerce capability. In this study, however, the non-store format is designated only if non-store channels accounted for at least 20% of a company’s total retail sales.
Globalisation slowly accelerates
Globalisation appears to be accelerating following a slowdown in the early part of the decade. In fiscal 2004, the top 250 retailers were doing business in a total of 118 different countries, with an average of 5.5 countries.
Although international sales are becoming increasingly important to many large retailers’ growth strategies, foreign operations still generate a relatively small share of overall sales and profits for most of these companies. Indeed, many of the world’s largest retailers have not yet expanded beyond their own borders. Of the top 250, 104 have no international operations at all. Over half the US-based companies are single-country operators. Sixty percent of Japanese retailers on the list do business only in Japan. An additional 39 companies operate in just two countries.
Conversely, 44 of the top 250 operate in 10 or more countries. Spain’s Inditex is the most international with stores in 56 countries, followed by Carrefour with 35 countries on its international roster, and IKEA with 33. Among the most globally active are retailers based in relatively small markets that provide limited domestic expansion opportunities. As noted above, French and German retailers are also among the most globally ambitious.
Big emerging markets attract foreign investment
China remains of interest to nearly all retailers, mostly because it represents a market of 1.3 billion people. China’s high economic growth rates, recent entry into the World Tourism Organisation (WTO), and the opening up of its markets offer retailers numerous opportunities for growth. Among the top 250, 29 non-Chinese retailers were doing business in China in 2004, and a battle for market share is underway.
Russia is the largest and fastest-growing retail market opportunity among the Central and Eastern European economies. However, investment risk resulting from poor infrastructure, corruption, and regulatory hurdles has discouraged many retailers from investing in Russia until recently. Twelve companies among the top 250 included Russia on their international expansion list in 2004. Continued efforts to reduce investment risk will attract more foreign retailers looking to tap the country’s huge potential.
India represents another strong retail market opportunity that has been hampered by restrictions on foreign ownership of retail establishments. For now, foreign retailers are restricted to franchise operations and wholesaling. Although only five of the world’s largest retailers were operating in India in 2004, the country is opening up its market. The government has recently expressed support for foreign direct investment in food retailing, which will put India on the map for many more foreign retailers.
Study methodology and data sources
Companies are included in the top 250 Global Powers of Retailing list based on their non-auto retail sales for fiscal year 2004 (encompasses fiscal years ended through June 2005). In a change from prior reports, motor vehicle dealers and food service/restaurant companies have been excluded from this year’s list.
A number of sources were consulted to develop the top 250 list. The principal data sources for financial and other company information were annual reports, Securities and Exchange Commission (SEC) filings, and information found in companies’ press releases, fact sheets, or websites. If company issued information was not available, other public-domain sources were used, including trade journal estimates, industry analysts’ reports, and various business information databases. Data for non-U.S. companies were provided by Planet Retail. Planet Retail, a leading provider of online retail intelligence, offers industry news, analysis, and digital media to decision-makers across all sectors. Covering over 1,800 grocery retailers and 4,000 banner operations in over 130 countries, Planet Retail has offices in London, Frankfurt and Tokyo.
Group Sales reflect the consolidated net sales of a retailer’s parent company, whether or not that company itself is primarily a retailer. Similarly, the income/loss figure also reflects the results of the parent company organisation.
For retailers that are part of a larger conglomerate, Retail sales reflect only the retail portion of the company’s consolidated net sales. Retail sales exclude separate food service operations and wholesale or other business-to-business revenue (except where such sales are made from retail stores), where it was possible to break them out.
Sales figures do not include the retail banner sales of franchised, licensed, or independent cooperative member stores. They do include royalties and franchising or licensing fees. Group Sales include wholesale sales to such networked operations – both member stores and other supplied stores. Sales figures do not include operations in which the company has only a minority interest.
In order to provide a common base from which to rank companies by their Retail Sales results, fiscal year 2004 sales for non-US companies were converted to US dollars. Exchange rates, therefore, have an impact on the results. OANDA.com is the source for the exchange rates. The average daily exchange rate corresponding to each company’s fiscal year was used to convert that company’s fiscal year 2004 sales to US dollars. The 1999-2004 compound annual growth rate (CAGR) for Retail sales, however, was calculated in the company’s local currency.
This report received invaluable guidance from leadership at Deloitte:
Ed Carey
Chairman, Global Consumer Business Practice
Gilles Goldenberg
Vice Chairman, Global Consumer Business Practice
Lawrence Hutter
Managing Partner, Global Consumer Business Practice
Ira Kalish
Director of Global Economics & Consumer Business, Deloitte Research
To view 50 Fastest growing retailers, 1999 – 2004,Top 250 Global retailers and Top 250 retailers alphabetical listing please click here.
Share or share alike?
Driving shareholder value in the current environment
The current business environment is characterised by declining costs of sourcing, intense price competition, increasing similarity in the quality of merchandise at all price points, and prickly consumers driven by value and convenience rather than brand, reputation and prestige. Consumers increasingly seek the lowest price and the fastest and easiest shopping experience. As such, their loyalty to retailers, formats and brands is diminishing. All of this amounts to the commoditisation of the retail experience. Shopping for food, clothing and home products becomes no more distinctive than shopping for gasoline.
In such an environment, the challenge for many retailers is to stand out from the crowd. Differentiation is critical, and branding is the method by which differentiation is clearly communicated to the consumer. Those retailers that offer a differentiated shopping experience and/or mix of products are likely to have some pricing power and, therefore, better than average margins. Such retailers can provide superior returns to their shareholders.
For those retailers unable to clearly differentiate, the key to success is simply to be the best value provider. This means maintaining low costs and offering consumers the lowest prices. Successful execution of such a strategy will lead to higher customer traffic, lower unit costs, and strong returns for shareholders.
Spotting the best prospects
The question arises as to how best to spot those companies best prepared to succeed in this business environment. There are many financial metrics used to measure current or anticipated strength. These include the rise in share price relative to the market, the price-earnings ratio, and various measures of profitability including return on assets.
In this section, another measure is examined which best highlights the ability of companies to avoid the commoditisation that is wracking the retailing industry. It is the q-ratio, the ratio of a company’s market capitalisation (share price times number of shares) to the replacement cost of the company’s assets.
Understanding q
The late Nobel Prize winning economist James Tobin suggested that the market value of corporate assets should roughly equal their replacement cost. In other words, he believed that the ratio of market capitalisation to asset value should be one. Tobin dubbed this the "q-ratio." He conjectured that, if market capitalisation exceeds the cost of assets, investors would buy the assets rather than the shares, thus driving the q-ratio back down to one. On the other hand, if market capitalisation is below asset value, then investors would purchase shares thereby driving the ratio back up to one.
Yet despite his expectation, he found that this ratio is usually different than one. How can this be explained? If, for a particular company, the market capitalisation is greater than the value of the company’s assets (the q-ratio is greater than one), it could be that the company is overvalued or the market is factoring in future growth opportunities. More likely, a q-ratio greater than one is probably due to the perceived value of non-tangible assets such as brand equity, the value of intellectual property, or the benefits of market dominance. Thus, the higher a company’s q-ratio the greater the relative market value of a company’s non-tangible assets and, most likely, the greater its prospects in a world where avoiding commoditisation is key to survival.
|
Top 50 retailers by Q-ratio |
Top 50 retailers by market capitalisation |
|
1 Hennes & Mauritz ‘B’ (H&M) 6.720 |
1 Walmart Stores 196,937 |
|
2 Amazon.com 5.569 |
2 Home Depot 87,839 |
|
3 Bed bath & beyond 3.766 |
3 Dell 76,430 |
|
4 Inditex 3.656 |
4 Target 49,267 |
|
5 Fast Retailing 3.592 |
5 Lowe’s Companies 47,380 |
|
6 Walgreen 3.458 |
6 Walgreen 46,137 |
|
7 Dell 3.293 |
7 Tesco 41,786 |
|
8 Shimamura 3.177 |
8 LVMH 39,640 |
|
9 Avon Products 3.152 |
9 Carrefour 31,333 |
|
10 Publix Super Markets 2.675 |
10 East Japan Railway 23,710 |
|
11 Next 2.652 |
11 Hennes & Mauritz ‘B’ 23,707 |
|
12 Dairy Farm Intl. 2.609 |
12 Costco Wholesale 23,179 |
|
13 Williams Sonoma 2.608 |
13 Best Buy 21,796 |
|
14 Colruyt 2.492 |
14 Liberty Media SR.A 21,370 |
|
15 Shoppers Drug Mart 2.393 |
15 CVS 19,843 |
|
16 Staples 2.362 |
16 Inditex 18,433 |
|
17 Yamada Denki 2.336 |
17 Staples 16,703 |
|
18 Ross Stores 2.276 |
18 Kohls 16,589 |
|
19 Home Depot 2.258 |
19 Amazon.com 16,521 |
|
20 Lowe’s Companies 2.234 |
20 Federated Dept.Strs. 16,252 |
|
21 Dollar General 2.196 |
21 Publix Supermarkets 15,952 |
|
22 Pick n Pay Stores 2.179 |
22 Loblaw 15,604 |
|
23 Best Buy 2.125 |
23 Gus 15,207 |
|
24 Michaels Stores 2.122 |
24 Gap 15,172 |
|
25 Petsmart 2.117 |
25 Aeon 14,956 |
|
26 Kohls 2.079 |
26 Metro 14,659 |
|
27 Nordstrom 2.057 |
27 Kroger 14,425 |
|
28 Woolworths 2.033 |
28 Woolworths 13,202 |
|
29 Luxottica 2.026 |
29 Penny JC 12,821 |
|
30 TJX cos. 1.976 |
30 PPR 12,645 |
|
31 Adv.Auto Parts 1.864 |
31 Avon Products 12,372 |
|
32 Wesfarmers 1.860 |
32 Marks & Spencer Group 12,272 |
|
33 LVMH 1.724 |
33 Bed Bath & Beyond 12,052 |
|
34 Foodland Associated 1.688 |
34 Luxottica 11,058 |
|
35 Family Dollar Stores 1.684 |
35 Ahold Kon. 10,841 |
|
36 HMV Group 1.684 |
36 Safeway 10,451 |
|
37 President Chain Store 1.663 |
37 Wesfarmers 10,084 |
|
38 Walmart Stores 1.638 |
38 TJX cos. 10,031 |
|
39 Marks & Spencer Group 1.618 |
39 Whole Foods Market 9,697 |
|
40 Falabella 1.584 |
40 Nordstrom 9,472 |
|
41 Axfood 1.547 |
41 Coles Myer 9,324 |
|
42 Costco Wholesale 1.536 |
42 Albertsons 9,251 |
|
43 Gap 1.531 |
43 Kingfisher 8,815 |
|
44 Target 1.526 |
44 Office Depot 8,503 |
|
45 Massmart 1.523 |
45 Sainsbury (J) 8,406 |
|
46 Autozone 1.471 |
46 Limited Brands 8,030 |
|
47 Coles Myer 1.429 |
47 IAC/InteractiveCorp 7,911 |
|
48 Loblaw 1.411 |
48 Boots Group 7,877 |
|
49 Carphone Whse.Gp. 1.387 |
49 Morrison(WM)Spmkts. 7,696 |
|
50 Sherwin-Williams 1.382 |
50 Yamada Denki 7,520 |
To understand this better, the q-ratio has been calculated for those companies on the list of the world’s top 250 retailers for which data is available. Obviously, such a calculation cannot be made for privately held companies. The 50 companies with the highest q-ratios are shown above.
For all 148 companies on the q-ratio list, the average q-ratio is 1.25. The composite q-ratio (that is, the ratio calculated by taking the ratio of the combined market capitalisation of all companies divided by the combined asset value) is 1.33.
US-based retailers had the highest average q-ratio at 1.479. Other averages were 1.067 for UK retailers, 1.035 for other EU retailers, 0.939 for Canadian retailers, and 0.855 for Japanese retailers. There is no discernible relationship between the size of a retailer and its q-ratio, or between the performance of a retailer’s stock price and its q-ratio. Among the retailers with the highest q-ratios, the best ratios are held by those retailers specialising in apparel and accessory products, as well as those retailers which sell predominantly on the internet.
Most importantly, and not surprisingly, it appears that the highest q-ratio retailers are those that either have very strong brand names such as H&M, Zara (Inditex), Uniqlo (Fast Retailing), Avon, Dell and Amazon, as well as those that offer an especially strong value proposition such as Ross, Kohl’s, Dollar General, Family Dollar and Wal-Mart.
A world of opportunity
Global powers economic outlook 2006
The world economy is performing reasonably well. Growth in the US, China, Russia, and India is strong. Inflation in most major countries remains low by historical standards, and long-term interest rates are unusually and surprisingly low. Even long-suffering Japan has seen relatively good performance lately, the result of strong demand from neighboring China. And although some of the biggest countries of the European continent are stagnating, others are doing quite nicely. Finally, although the price of oil has risen substantially, oil consuming nations seem to have absorbed this shock reasonably well.
Yet a variety of risks cast a darkening shadow across the global economic landscape. Among these risks are the effects of the increase in the price of oil as well as instability in some oil-exporting countries, protectionist sentiment in much of the developed world, and the huge financial imbalance between the US and the rest of the world. Each of these factors is a reality, not merely a risk.
Oil prices
The spectacular rise in the price of oil over the past few years has not had a spectacular impact on the global economy – at least not yet. Why is this?
There are a number of explanations. First, the impact of oil on the global economy is less than used to be the case simply because energy is used more efficiently. Today in the US, for example, only half as much oil is used per dollar of real GDP as was used in the mid-1970s.
Second, although the price of oil has risen substantially, as of October 2005 it remains below the highs reached in the late 1970s – when adjusting for inflation. Thus the rise in the price of oil is not as onerous as what happened 25 years ago.
Third, due to the decline in the value of the dollar over the past two years, the price that Europeans pay for oil has not risen nearly as much as the dollar price of oil. Thus Europe, an important consumer of oil, has not experienced the same rise in the price of oil that the US has experienced.
The impact of oil
So, the oil shock hasn’t been as onerous as could be the case. That is not to say, however, that an increased price has no consequences. Indeed the world is already feeling the impact. First, rising prices can be and have been inflationary. By late 2005 inflation in the G7 countries had reached its highest level since the early 1990s. That is one reason why the US Federal Reserve has been increasing short-term interest rates.
In addition, the rise in the price of oil is similar to an increased tax imposed by foreigners. It must be paid, and doing so requires spending less on something else. Thus economic growth is slowing due to this increased transfer of resources to oil producing countries. Growth will also slow due to the effects of higher interest rates as central banks attempt to offset the inflationary impact of higher prices.
A sufficient slowdown in economic growth would have a dampening effect on the price of oil. Although the price of oil was pushed up by recent hurricanes, it could easily drop below $60 per barrel in 2006 if growth in the US and China slow. On the other hand, this could be offset by a steep drop in the value of the dollar. A declining dollar would put upward pressure on the price of oil. Thus, forecasting the price of oil is as difficult as forecasting exchange rates and interest rates.
The US and an unbalanced global economy
A current account imbalance is the difference between what a country saves and invests. When the current account is in deficit, it means that domestic saving is insufficient to finance investment. The difference is made up by borrowing from foreigners or selling assets to foreigners. Conventional wisdom holds that rich countries will run current account surpluses, funneling excess savings into poorer countries with strong investment opportunities. Yet today, the US has an enormous current account deficit and the biggest surpluses belong to poorer emerging countries such as China. Why is this?
The US current account deficit is due to a collapse in US net saving rather than an increase in investment. Household savings in the US fell throughout the 1990s due to strong returns on financial assets and remained low during this decade due to the effect of increased home prices on consumer perception of wealth. Moreover, it is not simply private savings that has collapsed but government savings as well. The federal government’s increased budget deficit represents a decline in national savings.
The surplus in China is due to the fact that saving in China has risen even faster than investment – which itself has risen rapidly. In part that increase in saving is due to the Chinese government’s mercantilist choice to hold down the value of its currency by accumulating foreign currency reserves. Finally, personal saving in China has risen as the safety net offered by state-owned companies has gradually been removed through privatisation.
So what happens next?
Left alone, the US current account deficit will grow, both absolutely and as a share of US GDP. As that deficit grows, the net interest payments Americans must make will grow as well. Will foreigners be happy to finance this largesse? The answer is that they will not if they believe it is unsustainable. After all, if it is unsustainable, then the dollar must fall in order to boost US exports and reduce imports.
So, foreigners will not want to hold an increasing share of their own portfolios in the form of dollar-denominated assets if they believe that the dollar will lose value in the future.
In any event, the dollar will fall further. Despite a considerable decline in the dollar already, US import prices have not moved much. Importers have taken a hit to their margins rather than increase prices. Naturally, this cannot go on forever. A further decline in the value of the dollar will probably lead to higher import prices. The result will be that consumers will begin to switch from imports to domestically produced goods – thereby helping to reduce the current account deficit.
For the rest of the world, a lower dollar will reduce export demand and force economies to seek growth from domestic demand or exports to non-US markets. The good news is that a weaker dollar will be dis-inflationary for the US’s trading partners. This will allow other countries to lower their short-term interest rates and stimulate domestic demand. The bottom line is that a weaker dollar will ultimately allow a shift in the structure of global growth. In the US, this shift will entail slower growth of domestic demand and more rapid growth of exports. In the rest of the world, it will mean the opposite: stronger domestic demand and weaker export growth.
Outlook for the US
Although the biggest issue facing the US economy is the huge current account deficit, there are other US economic issues of concern to global companies. These include the political obstacles to dealing with the budget deficit, the looming public pension crisis, the crisis in private pensions, and the issue of immigration and visas. These challenges, if left unresolved, could cause the economy to grow more slowly than otherwise.
Despite these and other problems, the US economy continues to grow faster than most industrial nations. Not only is the labour force growing more rapidly than in Europe and Japan, but productivity continues to rise rapidly as well. The strength of US productivity growth has enabled the economy to generate higher labour costs without fuelling inflation. Thus the US economy seems capable of strong non-inflationary growth.
China
China has become one of the prime influences in the global economy. As discussed above, China’s exchange rate policy will influence trade flows, interest rates, and economic growth in the rest of the world. In addition, China’s import growth has strongly influenced the economic recovery in Japan.
Exchange rate
China is likely to revalue its currency further. Continued maintenance of a relatively low valued currency necessarily entails rapid money supply growth in order to purchase the excess dollars entering China. This has not yet caused high inflation (in part due to domestic price controls). Yet it will have onerous effects on China’s economy if it continues.
Revaluation will help China to shift toward domestically generated growth, rather than relying on more volatile exports. Domestic demand would make for more stable longer-term growth with less vulnerability to external events beyond China’s control. Moreover, China’s leaders will recognise that China can adjust to a higher valued currency without creating significant unemployment. That is because much of China’s recent export growth involved high value-added products that are less labor intensive. Hence, a revaluation will not necessarily lead to sizable increases in export prices.
For companies selling into the Chinese market, a higher valued currency will mean lower prices of imported components and imported final goods. This will mean greater effective purchasing power on the part of Chinese consumers and businesses. Also, Chinese companies will face greater competition from imports. This will force them to become more efficient and price competitive.
Outlook for China
China is likely to experience a brief, moderate slowdown in growth in 2006. In the longer-term, China’s growth is likely to accelerate as the process of economic reform unfolds. As this growth takes place, China will move up the value chain with a disproportionate share of growth coming from higher value-added goods and services. Today, China’s investment in education is considerable, with a large output of university graduates. This fact, combined with greater and more efficient investment, will drive productivity growth and enable a sizable increase in the purchasing power of ordinary Chinese.
India
India has been described as the next big thing. Its strong growth in recent years, combined with its emergence as a hub for off-shoring of service functions, has created a considerable buzz in the business world. Will India be the next China?
On the positive side, India has experienced relatively strong economic growth following the economic reforms first enacted in the early 1990s. Such reforms included deregulation of many domestic sectors, greater openness to foreign investment in most sectors, more sensible monetary and fiscal policies, and trade liberalization. As for the latter, India’s average tariff fell from 56% in 1990 to 28% in 2004. Still, this leaves India less open than China. By comparison, China’s tariff dropped from 32% to 6% over the same period.
In addition, the IT and communications revolutions allowed India to take advantage of its vast supply of highly educated, English speaking professionals – many with degrees in technology related subjects. These people became the vanguard for India’s emergence as a major exporter of IT related services. Consequently, India’s IT industry revenue rose from US$8.2 billion in 1999 to US$28.2 billion in 2004. It is expected that this industry will grow rapidly in the coming years.
India’s next step
A reasonable scenario for India will be continued strong growth, but growth below that of China. In other words, India does not seem likely to catch up with China anytime soon. On the other hand, India is poised to attract more investment not only in IT services, but in low wage manufacturing. The degree to which this happens depends on investment in infrastructure and labor market reform. If India attracts a sizable amount of manufacturing activity, this will help to absorb many underemployed workers into the market economy. India will benefit, of course, from China’s likely currency revaluation. When China finally undertakes a major revaluation, some low wage manufacturing capacity will shift out of China and into India and other low wage locations.
Europe
Europe’s largest economies have suffered relatively high unemployment and low growth for quite a long time. This used to be known as "Eurosclerosis." The solution, according to most economists, has always been to deregulate these economies, especially their sclerotic labor markets. Yet not much has happened. Now, Europe is at something of a crossroads. Its two leading economies, Germany and France, are struggling with a conflict between the comfortable yet slow growth that comes from maintaining the status quo and the social costs involved in generating the potentially stronger growth that could come from reform.
This conflict was at the forefront of the recent elections in Germany. There, the voters split virtually down the middle, reflecting no clear consensus on how to approach new economic realities. In France, a new government includes leaders on both sides of the debate about the extent of economic reform.
On the other hand, a number of smaller European economies with high social expenditures and taxation have done quite well. The countries of Scandinavia, for example, have been notable for their entrepreneurship in the midst of strong social protections.
Europe faces several long-term issues with which it must grapple soon:
- Onerous demographics. Europeans are living longer, retiring earlier, and having fewer children than in the past. The result of this is that, soon, the labour force will decline while the number of retirees increases. Absent a substantial boost to productivity growth, this implies declining economic growth – if any. This is not a politically or socially sustainable situation. The best solution would be to expand the share of the population that works. This means people retiring later. It also means removing some of the safety net that makes unemployment a viable alternative to labor market participation. Doing either of these will be politically challenging to say the least.
- Excessive safety net. Europe’s high level of unemployment and low growth are, in part, the result of excessive protection and subsidisation. When some politicians refer to Europe’s "social model," they often mean the vast array of subsidies available to those not working. Unlike in the US or many emerging countries, the unemployed in Europe will likely not suffer materially. Thus, the incentive to find work is less.
- Excessive regulation. Europe’s high unemployment is largely the result of rules that discourage the creation of new jobs. Rules that make the dismissal of workers difficult and costly encourage companies to seek ways to increase output without increasing labor input. This is one of the reasons why France, for example, has a very high level of worker productivity – but a high level of unemployment as well. Efforts to deregulate labor markets have been politically contentious.
The outlook, therefore, is for relatively modest growth absent substantial reform. On the other hand, a more accommodating monetary policy by the European Central Bank would help to accelerate growth.
Japan
Japan may be on the verge of a gradual economic renewal, following roughly 15 years of stagnant growth and deflation. A number of factors point in this direction, not the least of which is strong political support for a government committed to reform. Sustained recovery will require not simply an ephemeral boost in exports (this has happened before), but strength in the domestic economy. It will require increased investment by Japanese business and increased spending by Japanese consumers.
Investment spending might be ready for a recovery. Japan’s companies have spent much of the past 15 years cleaning up their messy balance sheets while the country’s banks have substantially reduced their portfolios of non-performing loans. The result is that companies are now in a better position to invest rather than pay down debts.
Good news
There are already some positive signs with respect to the consumer. For example, wages and employment are now rising at a significant pace for the first time in many years. Consumers have reduced their personal savings substantially, yet consumer spending could accelerate as job and wage growth start to improve. Indeed, retail sales are rising faster than GDP. Moreover, further reform of Japan’s financial sector, combined with improved equity market performance, may compel Japanese to part with their savings. Another positive sign is that inflation is now expected to reappear in 2006. In an economy laden with bad debts, the presence of deflation for the past 15 years has been onerous indeed. A little inflation could go a long way toward reducing the real value of debts and improving the financial position of companies and banks.
Latin America
Latin America’s economy is a mixed bag. Argentina and Venezuela are growing very rapidly, but both possess economic environments that pose serious risks. On the other hand, Mexico and Brazil, the region’s largest economies, are growing at a more modest pace. Yet both offer more promise to global companies given the economic policies and environments in place.
First, consider Argentina. Growth lately has been impressively in double digits. Yet this represents a recovery from a severe downturn a few years ago. Moreover, Argentina’s external debt remains high, inflation is not yet tamed, and investor confidence is not strong. Although consumer spending has recovered, income remains low and poverty is ubiquitous.
Global retailers have scaled back their expansion plans for Argentina. Venezuela is an even more problematic case. Economic growth has been strong due to the rapid rise in the price of oil over the past two years. Yet inflation continues to be the highest in Latin America and among the highest in the world. The government has increasingly engaged in socialist policies including massive increases in social spending, state interference in the private sector, and confiscation of central bank reserves for social spending. The result is a considerable drop in investor confidence.
Mexico and Brazil have a very different situation. Neither is growing rapidly, and both have reform minded leaders unable to convince their legislatures of the importance of reform. Thus they have not been able to implement the kinds of changes that would push their economies toward the next stage of market oriented development. On the other hand, both countries have well developed and sophisticated distribution industries, relatively sensible monetary and fiscal regimes, and stable and successful private sectors. Thus, both are attractive places to invest in retailing – despite a lack of strong growth potential.
Finally, the most attractive economy in the region remains Chile. Growth continues at a rapid pace, resulting in an expanding middle class. With a modest population Chile is not big enough to warrant massive foreign retail investment. If only all of Latin America had the economic attributes of Chile.
Central and Eastern Europe
The fastest growing economy in the region continues to be Russia. Fuelled by frothy oil prices, Russia’s commodity export sector has boomed. This, combined with sensible fiscal and monetary management of Russia’s economy, has rendered the country quite attractive to foreign investors. Global retailers have accelerated their activity in Russia, with investments by Auchan, Ikea, Boots, and the continuing possibility of Wal-Mart. Although Russia’s government has taken steps that scare investors about the country’s commitment to the rule of law and protection of property rights, these issues have mainly involved the resource sector. The consumer sector has been left alone.
As for Central Europe, the new EU members are growing at a modest pace that could increase substantially once these countries join the eurozone in a few years. Economic policies are quite sensible, and the attraction of the region to Western European investors will only grow. On the other hand, demographics are especially poor, with indigenous populations declining and, unlike the West, no significant immigration providing an offset. As for retailing, the region is fairly saturated with major Western European retailers – especially in the areas of food, mass merchandise, and home improvement. Hence, investment opportunities are not considerable.
To continue reading this article please click here
The content of this article is intended to provide a general guide to the subject matter. Specialist advice should be sought about your specific circumstances.