

An annual analysis on CEO pay in Japan, the U.S., and Europe, finds that Japanese pay is on the rise but still lags behind its Western counterparts in various aspects of executive pay.
In an annual analysis on CEO pay in Japan, the U.S., and Europe, based on publicly available data from over 500 companies in Japan, France, Germany, the U.K., and the U.S., found that Japanese pay is on the rise but still lags behind its Western counterparts in various aspects of executive pay.
About the study
This analysis on CEO pay is based on publicly available data from over 500 companies in Japan, France, Germany, the U.K., and the U.S. For more information about how this analysis was conducted, please click on the 2024 analysis of CEO pay.
The key findings include:
- Median CEO pay in the U.K. decreased year-over-year on a local currency basis due to declines in all three compensation elements (base salary, annual incentive and long-term incentive).
- Median CEO pay in the U.S., Germany and France increased year-over-year on a local currency basis owing to increases in all pay elements in the U.S., higher base salary and long-term incentives in Germany and expanded long-term incentives in France.
- Median CEO pay in Japan increased by 2.2% with base salaries and short-term incentives being higher while long-term incentives were subdued compared to the prior year. Variable compensation comprises two-thirds of total pay.
- ROE (at median) of Japanese companies remains subdued compared to the U.S. and the median ROE averaged across the three European countries under analysis.
Compensation level and mix trends
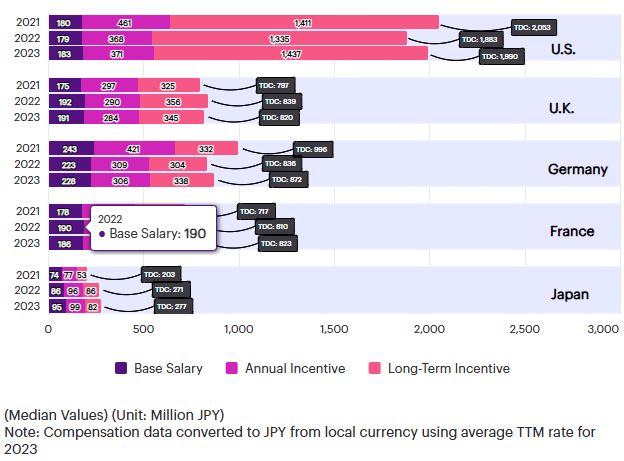
While median total CEO compensation in Japan increased from JPY 271 million to JPY 277 million year-over-year, the study highlights the significant gap between Japanese companies and Western markets (Figure 1).
Figure 1. Trend in CEO Compensation (2021 – 2023)
This differential is particularly evident when comparing the quantum and weighting of variable compensation elements (Figure 2 – scroll right to see percentages).
Figure 2. CEO Compensation Analysis
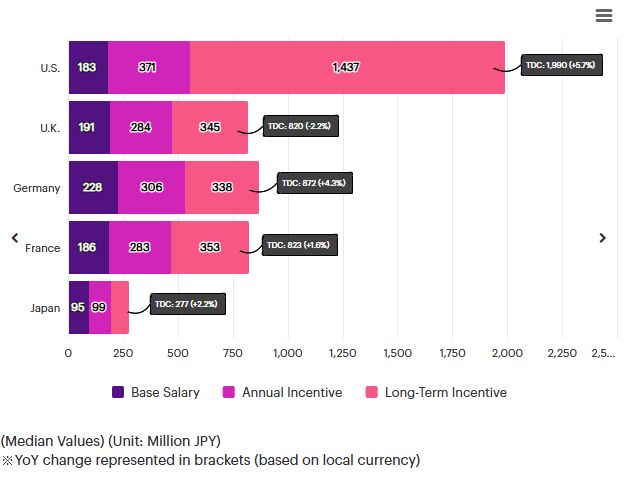
Note: Percentages in brackets represent the year-on-year change (in local currency) in compensation from the 2023 analysis of CEO pay.
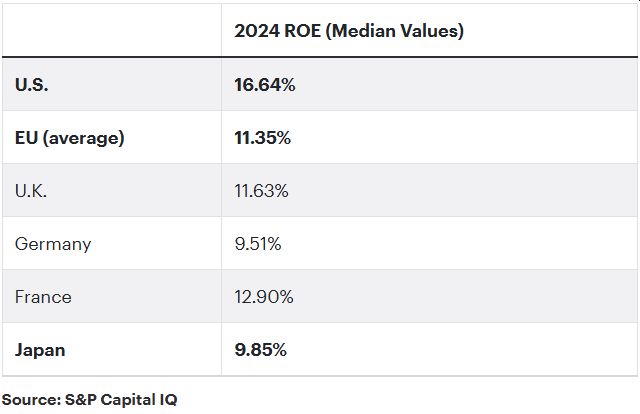
In parallel, when considering median capital return of each market (Figure 3), performance mirrors the global trend in compensation levels, whereby the U.S. has the strongest ROE at median, followed by Europe (median ROE averaged across U.K., Germany and France) and finally Japan following behind Western markets.
Even amongst the Western markets, CEO pay in the U.S. exceeds the European market by a strong margin owing mainly to U.S. companies placing a focus on long-term incentives within executive pay mixes. When considering the relationship between pay and performance, the focus placed on variable compensation elements to expand realizable pay may be a key driver behind higher corporate value and performance observed among U.S. companies.
Figure 3. Median ROE Data
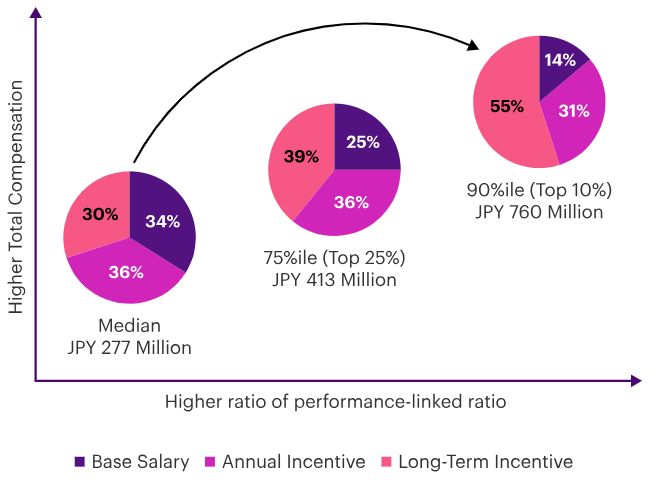
Within the Japanese market, companies that report the highest levels of compensation typically have a significant portion of pay tied to variable pay elements. At median CEO pay of JPY 277 million, pay mix is approximately 1:1:1 (base to annual incentive to long-term incentive). However, amongst the top 10% of companies (90%ile of CEO pay in Japan = JPY 760 million), incentives are used more aggressively with pay mix of approximately 1:2:4 (Figure 4).
Figure 4. Compensation level and mix trends for Japanese companies
If pay levels and corporate performance are inherently linked, Japanese companies may be able to achieve growth through the expansion of variable compensation within pay mixes and thereby further increase realizable pay. This would also demonstrate the intent of a company to achieve sustainable and long-term improvements in corporate value to external stakeholders, encourage executives to take concrete actions toward improved performance and would also be beneficial for attracting global talent to Japan.
But if Japanese companies want to go down this route of increasing pay with a view to improve corporate value and becoming competitive with Western markets, it's critical to secure the support of internal and external stakeholders, and to ensure that performance and pay governance meet market best practice. This would include setting sufficiently challenging goals for incentive plans, implementation of malus/clawback provisions, mechanisms to promote long-term stockholding by executives and ensuring the effectiveness of the compensation committee.
About the study
The report "CEO Pay Landscape in Japan, the U.S., and Europe - 2024 Analysis," was compiled by the WTW Global Executive Compensation Analysis team using public disclosures. Details of the analysis and basis of representation are as follows:
- U.S.: Median of Fortune 500 companies with revenue above JPY 1
trillion (389 companies)
U.K.: Median of FTSE 100 companies with revenue above JPY 1 trillion (51 companies) - Germany: Median of DAX constituents with revenue above JPY 1 trillion (34 companies)
- France: Median of CAC 40 companies with revenue above JPY 1 trillion (35 companies)
- Japan: Median of top 100 companies by market cap and with revenue above JPY 1 trillion and had submitted Securities Reports at the time of analysis (82 companies).
- Exchange Rates: 2023 Average TTM rates (USD 1 = JPY 140.56; 1 GBP = JPY 174.86; 1 EUR = JPY 152.00)
The content of this article is intended to provide a general guide to the subject matter. Specialist advice should be sought about your specific circumstances.


