
- within Intellectual Property topic(s)
- with Senior Company Executives, HR and Inhouse Counsel
- in United States
- with readers working within the Banking & Credit, Basic Industries and Business & Consumer Services industries
IP Australia has released the fourteenth edition of the ‘Australian Intellectual Property Report’1 (the Report) which presents key movements in IP statistics and explores the links between innovation, collaboration and commercialisation.
The Report presents and discusses the latest IP statistics across the range of categories administered by IP Australia, and is aimed at promoting awareness of IP rights. This year it also looks at how IP serves as a platform for productivity and growth from an Australian perspective.
Our team discusses the key findings and changes.
IP statistics in Australia
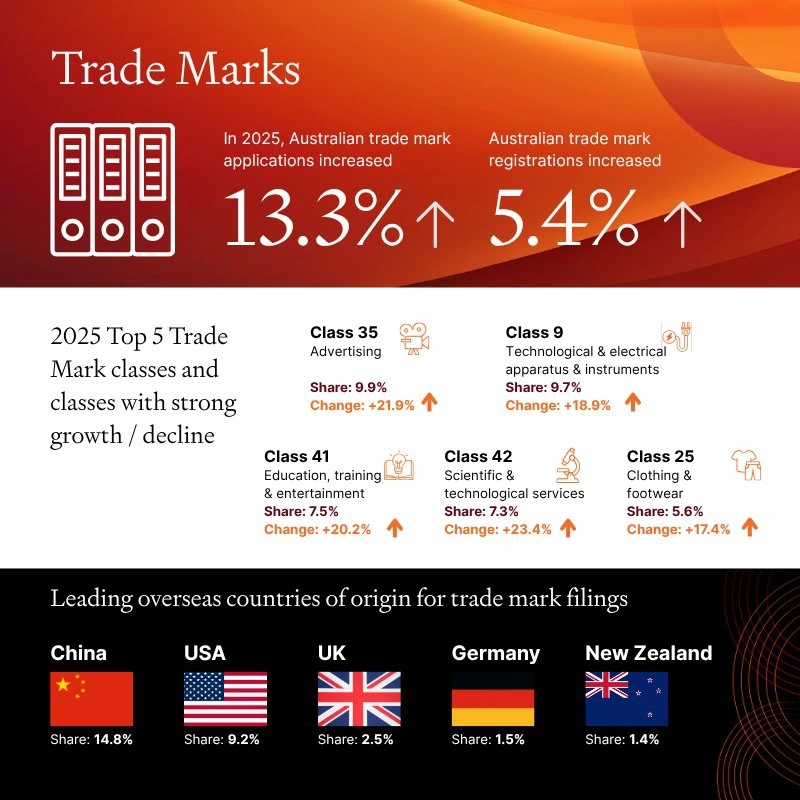
In 2025, overall filings in trade marks and designs increased by 13.3% and 7.1% respectively, while standard patents and plant breeder’s rights experienced decreases, falling by 0.5% and 6.4%, respectively. Notably, both trade mark and design filings achieved record highs in 2025.
The Authors of the Report note that we are “at a moment of structural change in the global economy”, and note the
“… international system that shaped innovation, trade and investment over the past 3 decades is being recalibrated. How economies operate is being reshaped by strategic competition, technology and trade policy. Cooperation continues, but increasingly through targeted alignment and trusted partnerships.”
This report shows that IP is functioning as core economic infrastructure, supporting business activity, productivity and Australia’s engagement in global markets.
Standard patents
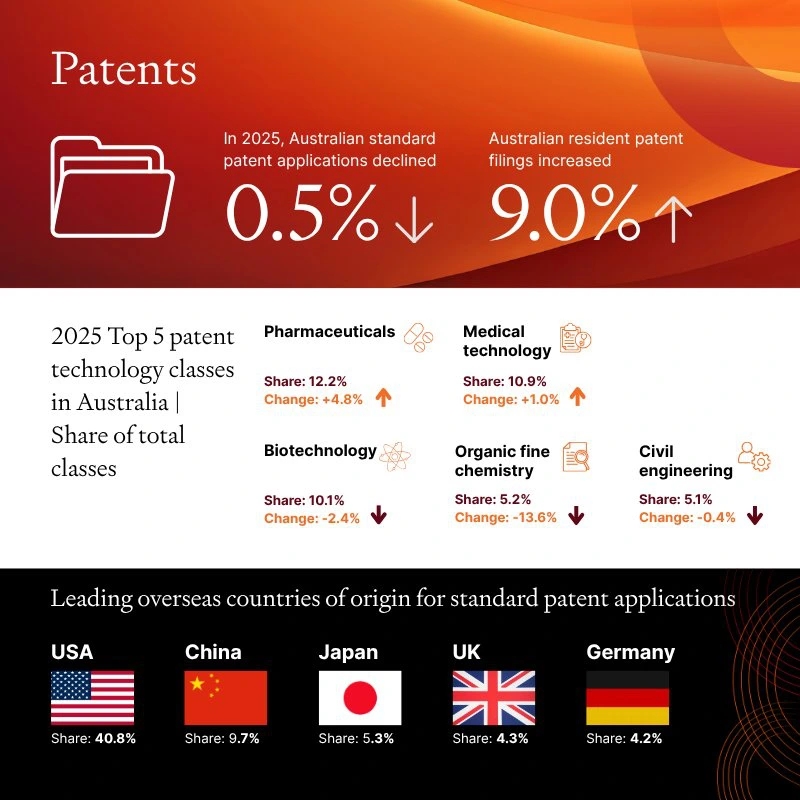
IP Australia received 30,348 standard patent applications in 2025, which is a slight decrease of 0.5% from 2024. The number represents an ongoing decrease in filings from the record level in 2021.
The data also confirm that national phase entry from PCT applications is the preferred filing route, with 20,248 national phase entries and 10,100 direct entries recorded last year.
While non-resident filings decreased by 1.3% in 2025, they still account for more than 90% of all applications filed in Australia. On the other hand, applications filed by Australian residents increased to 9.3%, its highest share since 2021.
Countries of origin
Of the non-resident filings, the United States is the largest contributor with 40.8% share of total applications, followed by China (9.7%), Japan (5.3%), the United Kingdom (4.3%) and Germany (4.2%).
Notably, standard patent applications originated from China continued to rise by 13.4% in 2025 after consecutive years of increase, while the filings from the United States continued to decrease by 5.0% in 2025.
Provisional applications
After persistent decline in the filing of provisional applications over the past decade, the number of provisional filings increased significantly by 58.1% to 6,867 in 2025, the highest level since 2008. However, this number still represents over 6% decline compared to the provisional filings in 2005.
The authors of the Report note that individual applicants accounted for almost half of all provisional filings in 2025, up from around one-third in 2024. They also hint at smaller firms and individuals using AI tools to reduce initial drafting and search costs, and note that the proportion of provisional applicants who are:
- ‘new filers’ (i.e., having never filed for patents before) jumped to 63% in 2025, from around 42% over the period 2021 to 2024, and who are
- ‘self-filers’ (i.e., applying without representation of a patent attorney) jumped to 52% in 2025, after gradually increasing from 19% to 27% over 2021 to 2024.
The authors also foreshadow that increased use of automated and AI-assisted tools presents challenges for patent systems globally, for example higher volumes of speculative filings, increased demands on examination resources, and questions around disclosure quality and inventorship.
Technology classes
The five leading classes for standard patent applications in 2025 were Pharmaceuticals at a 12.2% share of total applications, followed by Medical technology (10.9%), Biotechnology (10.1%), Organic fine chemistry (5.2%) and Civil engineering (5.1%). It is noted that health-related technologies accounted for a significant proportion of the total filings, showing that Australia is an attractive market and source for high-value health innovations.
Leading applicants (international and domestic)
The top five international patent applicants were LG Electronics with 196 applications, followed by Huawei Technologies (159), Caterpillar (157), Regeneron Pharmaceuticals (134) and Nestle (129), while the top five domestic applicants were Aristocrat Technologies Australia (123), Idy (43), Sense2 (41), Thanh Tri Lam (40) and Yaohui Liang (34).
Overseas applications
Overseas patent applications filed by Australian applicants declined by 6.6% in 2024 to a total of 8,659 filings. The most popular destination for Australian applicants seeking overseas patent protection is the United States with a 38.3% share of total applications, followed by the European Patent Office (11.4%), China (8.5%), Japan (6.3%) and New Zealand (5.6%).
Efficiency gains and income growth
The Report also finds that, compared with the peer firms, a firm’s total income is on average about 43% higher following their first patent grant. It is also reported that the patent grants are associated with an average of 14.6% increase in total factor productivity, and an average 3% increase in labour productivity.
Direct applications continued to represent over 80% of the applications, as opposed to applications through WIPO’s Madrid route.
Resident filings increased sharply by 15.1% and continued to hold a relatively higher share of trade mark applications (57.4%) in 2025 when compared to non-residents. In the meantime, trade mark registrations increased by 5.4% in 2025.
Countries of origin
Non-residents continued to hold a lower share of trade mark applications (42.6%) in 2025 when compared to residents. The leading foreign countries of origin were China with a 14.8% share of total applications, followed by the US (9.2%), the United Kingdom (2.5%), Germany (1.5%) and New Zealand (1.4%). Notably, applications originated from China increased by more than 20.0% in 2025.
Trade mark classes
The five classes in the Nice Classification system that received the most applications in 2025 were: Advertising with a 9.9% share of total classes, Technology and electrical apparatus and instruments (9.7%), Education, training and entertainment (7.5%), Scientific and technological services (7.3%), and Clothing, footwear and headgear (5.6%).
Leading applicants (international and domestic)
The top five international applicants were L’Oréal (122), Bertbaby (84), Weihua Trophy Import & Export (73), Qudao Crossborder Ecommerce Weihai (69) and Samsung Electronics (64), while the top five domestic applicants were Aristocrat Technologies Australia (71), Pharmacor (63), Ainsworth Game Technology (56), Supreme Caravans (31) and Mnb Variety Imports (30).
Overseas applications
A total of 17,414 overseas trade mark applications were filed by Australian applicants in 2024, which was almost the same as the filing level in 2023. The most popular destination for Australian applicants seeking overseas trade mark protection is the United States with a 19.6% share of total applications, followed by New Zealand (15.1%), the United Kingdom (9.4%), Europe (7.3%) and Canada (5.1%).
Efficiency gains and income growth
The Report also finds that compared with the peer firms, a firm’s total income is on average about 78% higher following their first trade mark registration. It is also reported that the trade mark registration is associated with an average of 6% increase in total factor productivity, and an average 16% increase in labour productivity.
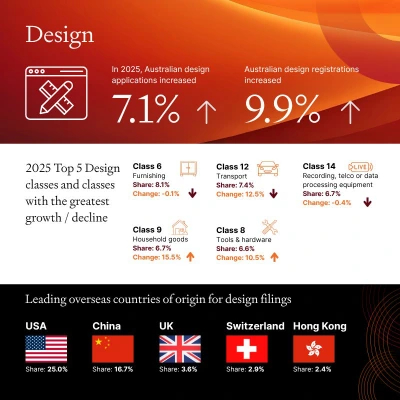
Number of design registrations increased by 9.9% in 2025 to a record level of 9,727, and 1,448 designs were certified in 2025, representing a slight decline of 1.8%.
Resident filings increased by 6.3% to a record level of 3,078 in 2025, but the number represents less than a third of all design applications.
Countries of origin
The leading countries of origin were the United States with a 25.0% share of total applications, followed by China (16.7%), the United Kingdom (3.6%), Switzerland (2.9%) and Hong Kong (2.4%) in 2025. Notably, significant growths are seen in applications originating from the US (31.8%) and from Switzerland (24.7%).
Design classes
The five classes in the Locarno Classification system that received the most applications in 2025 were: Furnishing with a 8.1% share of total classes, followed by Transport (7.4%), Recording, telecommunication or data processing equipment (6.7%), Household goods (6.7%) and Tools and hardware (6.6%).
Leading applicants (international and domestic)
The top five international applicants were Intercontinental Great Brands (192), Miss Amara Group (177), Beijing Roborock Technology (172), Yeti Coolers (119) and Skechers USA (114), while the top five domestic applicants were Tatjana Petreska (88), Zimmermann Wear (37), Aristocrat Technologies Australia (30), Fido Home (29) and Voltex Electrical Accessories (24).
Overseas applications
A total of 2,487 overseas design applications were filed by Australian applicants in 2024. The most popular destination for Australian design innovators is the United States with a 26.2% share of total applications, followed by New Zealand (14.5), China (12.4%), Europe (10.1%) and the United Kingdom (9.2%).
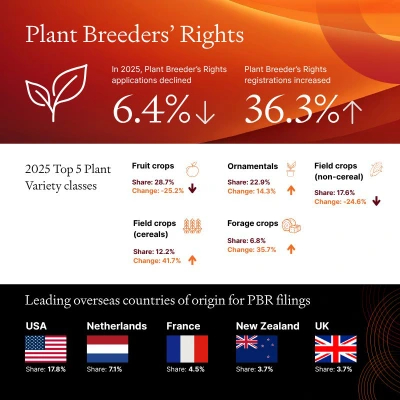
In 2025, 264 PBR applications were filed, which accounted for a 6.4% decline from 2024. Non-resident filings declined by 19.2% but continued to hold a relatively higher share of PBR applications (56%) in 2025 when compared to residents.
In the meantime, PBR registrations increased sharply by 36.3% compared to the 2024 level.
Countries of origin
The leading countries of origin were the United States with a 17.8% share of total applications, followed by the Netherlands (7.1%), France (4.5%), New Zealand (3.7%) and the United Kingdom (3.7%) in 2025.
PBR classes
The five classes that received the most applications in 2025 were: Fruit crops with a 28.7% share of total applications, followed by Ornamentals (22.9%), Field crops (non-cereals) (17.6%), Field crops (cereals) (12.2%), and Forage crops (6.8%).
Leading applicants (international and domestic)
The top five international applicants were Rijk Zwaan (10), Syngenta Crop Protection (9), Aurora Cannabis Enterprises (7), Agro Selections Fruits (5) and Driscolls (5), while the top five domestic applicants were Australian Grain Technologies (10), Craig Robert Pressler (10), Ozbreed Greenlife (9), CSIRO (7) and Intergrain (7).
Research program
Apart from the statistics, the report also details IP Australia’s research programs. The three main programs include: the Office of the Chief Economist (OCE), the Data and Analytics, and the IPAVentures. These programs accomplish many things, for example: the OCE produces evidence and advice to inform IP policy, increase understanding about the IP system’s economic role and impact, and aims to improve operational effectiveness in the administration of IP rights; the Data and Analytics offers a patent analytics service and a data ‘front door’ service to external stakeholders for addressing data-related queries across different IP rights; and the IPAVentures aims to support the IP Australia’s vision of creating a world-class IP system and promoting prosperity for Australians. During 2025, IPAVentures progressed a pilot digital service, IP First Response, designed to help Australian SMEs understand and navigate options when facing potential IP disputes.
The Report, and these programs, are well worth a more detailed review for interested parties.
Reach out to the team
For all of your IP advice, filing, strategy, prosecution and legal needs, Spruson & Ferguson has experienced IP and industry experts across all areas of science and technologies, connected as one firm, located in 10 offices in the APAC region, and filing in over 25 jurisdictions.
Footnote
The content of this article is intended to provide a general guide to the subject matter. Specialist advice should be sought about your specific circumstances.
[View Source]