
- within Intellectual Property topic(s)
- in United States
- within Intellectual Property topic(s)
- with Senior Company Executives, HR and Inhouse Counsel
- in United States
- with readers working within the Banking & Credit, Basic Industries and Business & Consumer Services industries
IP Australia has released the thirteenth edition of the 'Australian Intellectual Property Report'1 (the Report) which presents key movements in IP statistics and explores the links between innovation, collaboration and commercialisation.
The Report presents and discusses the latest IP statistics across the range of categories administered by IP Australia, and is aimed at promoting awareness of IP rights. This year it also looks at the strategic incentives of businesses to speed up or delay the patent process, and the economic impacts.
Our team discusses the key findings and changes.
IP statistics in Australia
In 2024, overall filings in trade marks and designs increased by 2.8% and 8.9% respectively, while standard patents and plant breeder's rights experienced slight decreases, falling by 3.3% and 1.7% respectively. Notably, design filings achieved a record high in 2024. Overall, there were reduced filings in IP from the United States in 2024, but the reduction was partially offset by growth from China.
The Report notes:
"The global economic outlook is highly uncertain. Global policy uncertainty related to trade tensions could weigh on investment and employment in Australia and across our major trading partners. IP rights are a versatile set of tools that can help buffer against uncertainty and increase business resilience to shocks." (Pg 5)
Patents
Standard patents
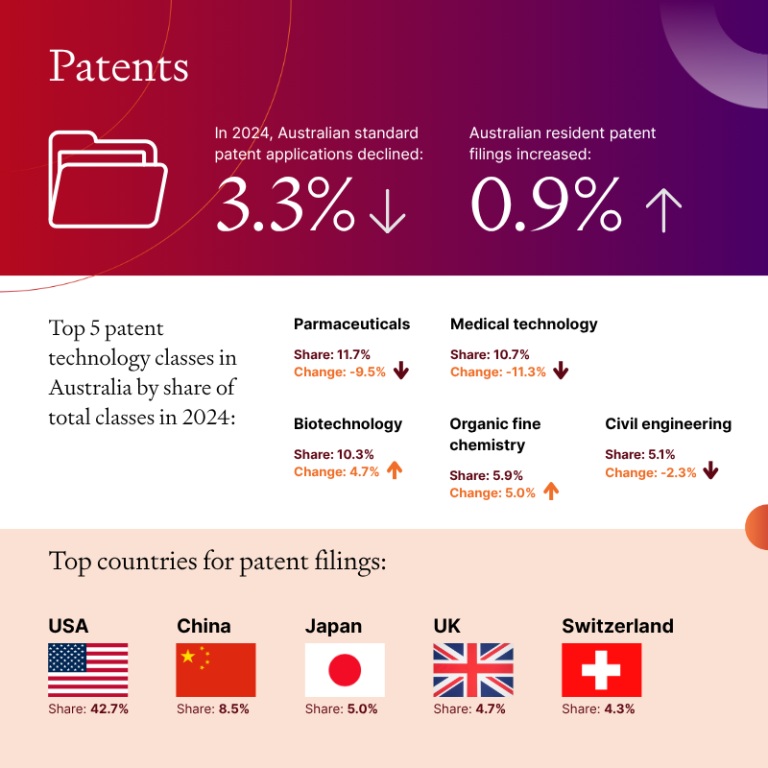
IP Australia received 30,478 standard patent applications in 2024, which is a slight decrease of 3.3% from 2023. The number represents an ongoing decrease in filings from the record level in 2021. The data also confirm that national phase entry from PCT applications is the preferred filing route, with 21,219 national phase entries and 9,259 direct entries recorded last year.
IP Australia received 30,478 standard patent applications in 2024, which is a slight decrease of 3.3% from 2023. The number represents an ongoing decrease in filings from the record level in 2021.
The data also confirm that national phase entry from PCT applications is the preferred filing route, with 21,219 national phase entries and 9,259 direct entries recorded last year.
While non-resident filings decreased by 3.7% in 2024, they still account for more than 91% of all applications filed in Australia. On the other hand, applications filed by Australian residents increased by 0.9%.
Filing origins
The United States is the largest contributor with 42.7% share of total applications, followed by China (8.5%), Japan (5.0%), the United Kingdom (4.7%) and Switzerland (4.3%).
Notably, standard patent applications originated from China continued to increase by 5.2% in 2024 after an increase of 13.1% in 2023, while the filings from the United States continued to decrease by 6.2% in 2024 after a decrease of 5.9% in 2023.
Provisional applications
After persistent decline in the filing of provisional applications over the past decade, the number of provisional filings continued to increase, by 2.4% to 4344 in 2024. However, this number still represents over 40% decline compared to the provisional filings in 2004.
The authors of the Report note that the likelihood of applicants converting provisional applications into standard complete applications has increased over past decade.
Technology classes
The five leading classes for standard patent applications in 2024 were Pharmaceuticals at a 11.7% share of total applications, followed by Medical technology (10.7%), Biotechnology (10.3%), Organic fine chemistry (5.9%) and Civil engineering (5.1%). After consecutive years of significant growth from 2020 to 2022, pharmaceutical and medical technology patent applications both experienced a second consecutive year of decline in 2024, decreasing by 9.5% and 11.3% respectively. This presents a downward correction from elevated levels during the COVID-19 shock.
Leading applicants (international and domestic)
The top five international patent applicants were LG Electronics with 229 applications, followed by Huawei Technologies (196), Regeneron Pharmaceuticals (162), Nestlé (161) and Caterpillar (154), while the top five domestic applicants were Aristocrat Technologies Australia (73), Canva (44), CSIRO (37), Monash University (22) and UNSW (22, through its technology transfer office, NewSouth Innovations Pty Ltd). Notably, Regeneron Pharmaceuticals, known for experimental monoclonal antibody treatment for COVID-19 patients, made into the top filers list.
Overseas applications
Overseas patent applications filed by Australian applicants declined by 3.9% in 2023 to a total of 9045 filings. The most popular destination for Australian applicants seeking overseas patent protection is the United States with a 36.3% share of total applications, followed by the European Patent Office (11.7%), China (8.1%), Japan (5.9%) and Canada (5.7%). Notably, filings to New Zealand, Japan and the US have fallen significant by 27.9%, 9.6% and 9.2% respectively, compared to their 2022 level.
Timing of patent examination
The Report publishes the outcomes of a study aiming to understand the strategic incentives of businesses to speed up or delay the patent process and their economic impacts.
In Australia, the patent system is flexible in that an Applicant can request substantive examination any time within the 5-year period after filing, or within 2 months when directed by the Commissioner of Patents in that 5-year period. The flexibility is important to businesses because it offers them time to assess the commercial potential of the inventions, monitor industry trends, respond to technological developments and evaluate market opportunities. It is found that large businesses are more likely than small businesses to request examination early and undirected.
The Report notes that for 41.9% of patents granted in Australia, the applicants requested substantive examination voluntarily without being directed. It is also found that applicants who speed up examination using IP Australia's freely available options for doing so tend to experience better post-grant outcomes, while applicants who wait until they are directed to request examination tend to have weaker post-grant outcomes.
Trade Marks
Trade mark applications and registrations
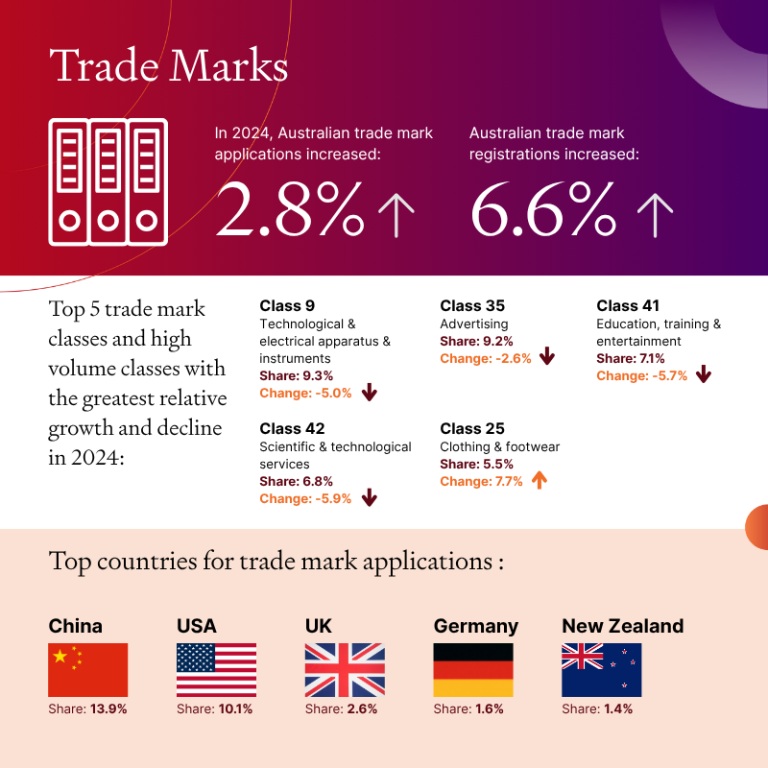
In 2024, 85,945 trade mark applications were received by IP Australia, which represents a 2.8% increase from 2023. A record level of direct applications were filed in 2024, representing over 80% of the applications, as opposed to applications through WIPO's Madrid route. Resident filings decreased slightly by 0.9% but continued to hold a relatively higher share of trade mark applications (56.5%) in 2024 when compared to non-residents. In the meantime, trade mark registrations increased by 6.6% in 2024.
Filing origins
Non-residents continued to hold a lower share of trade mark applications (43.5%) in 2024 when compared to residents. The leading foreign filing origins were China with a 13.9% share of total applications, followed by the US (10.1%), the United Kingdom (2.6%), Germany (1.6%) and New Zealand (1.4%). Notably, applications originated from China increased by more than 45.5% in 2024.
Trade mark classes
The five classes in the Nice Classification system that received the most applications in 2024 were: Technology and electrical apparatus and instruments with a 9.3% share of total classes, Advertising (9.2%), Education, training and entertainment (7.1%), Scientific and technological services (6.8%), and Clothing, footwear and headgear (5.5%).
Leading applicants (international and domestic)
The top five international applicants were Novartis Ag (178), L'Oréal (121), Huiwen Ye (82), Pixel Nordic (81) and Mengxin Chen (65), while the top five domestic applicants were Aristocrat Technologies Australia (95), Ainsworth Game Technology (73), Endeavour Group (60), Australia Blue Moon Hero (59) and Auying International (55).
Overseas applications
A total of 17,407 overseas trade mark applications were filed by Australian applicants in 2023, which represented a decline from the level of 2022 by 15.8%. The most popular destination for Australian applicants seeking overseas trade mark protection is the United States with a 19.8% share of total applications, followed by New Zealand (15.3%), the United Kingdom (10.0%), Europe (7.2%) and Canada (5.8%).
Designs
Design applications, registrations and certifications
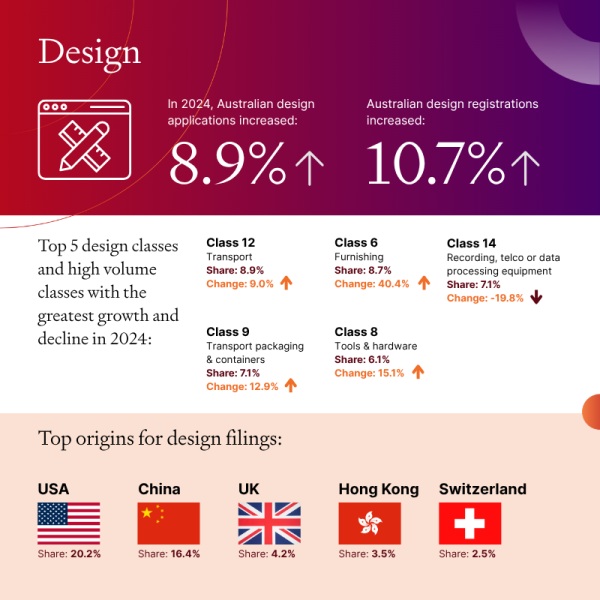
A record number of 9,583 design applications were filed in 2024, which is an 8.9% increase over the previous year. Number of design registrations increased by 10.7% in 2024 to a record level of 8,854, and 1,474 designs were certified in 2024, representing a decline of 4.3%. Resident filings increased by 8.6% to 2,885 in 2024, but the number represents less than a third of all design applications.
Filing origins
The leading filing origins were the United States with a 20.2% share of total applications, followed by China (16.4%), the United Kingdom (4.2%), Hong Kong (3.5%) and Switzerland (2.5%) in 2024. Notably, significant growths are seen in applications originating from China (65.5%) and from Hong Kong (138.0%).
Design classes
The five classes in the Locarno Classification system that received the most applications in 2024 were: Transport with a 8.9% share of total classes, followed by Furnishing (8.7%), Recording, telecommunication or data processing equipment (7.1%), Transport packing and containers (7.1%) and Tools and hardware (6.1%).
Leading applicants (international and domestic)
The top five international applicants were Miss Amara Group (249), Beijing Roborock Technology (88), Apple Inc (86), BYD company (83) and Jani International (75), while the top five domestic applicants were Tatjana Petreska (146), Schneider Electric Australia (58), Phoenix Industries (50), Systems Ip (46) and Magi Enterprises (30).
Overseas applications
A total of 2,266 overseas design applications were filed by Australian applicants in 2023. The most popular destination for Australian design innovators is the United States with a 26.0% share of total applications, followed by China (11.7%), New Zealand (11.7%), Europe (9.7%) and the United Kingdom (8.8%).
Plant Breeder's Rights
PBR applications and registrations
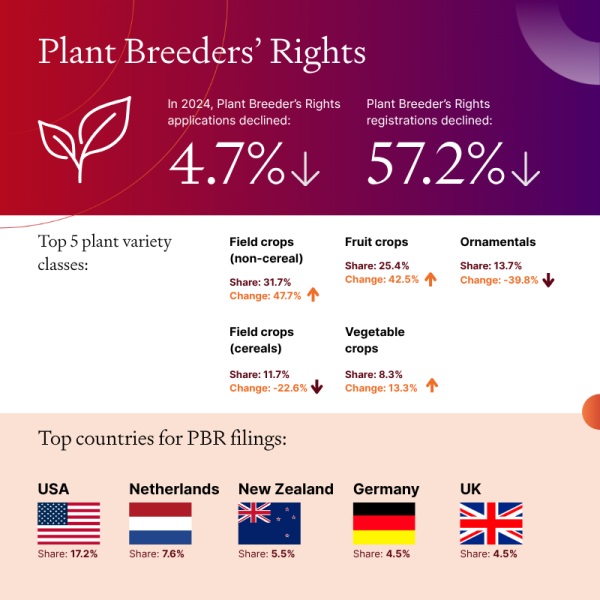
In 2024, 282 PBR applications were filed, which accounted for a 4.7% decline from 2023. Non-resident filings grew by 21.3% and continued to hold a relatively higher share of PBR applications (65%) in 2024 when compared to residents. In the meantime, PBR registrations declined sharply by 57.2% compared to the 2023 level due to delays in publishing Journals and in processing registrations.
Filing origins
The leading filing origins were the United States with a 17.2% share of total applications, followed by the Netherlands (7.6%), New Zealand (5.5%), Germany (4.5%) and the United Kingdom (4.5%) in 2024.
PBR classes
The five classes that received the most applications in 2024 were: Field crops(non-cereals) with a 31.7% share of total applications, followed by Fruit crops (25.4%), Ornamentals (13.7%), Field crops (cereals) (11.7%), and Vegetable crops (8.3%).
Leading applicants (international and domestic)
The top five international applicants were Driscolls Inc (12), Syngenta Crop Protection Ag (10), Bloom Fresh International (8), Nunhems (8) and Böhmnordkartoffel Agrarproduktion (7), while the top five domestic applicants were Australian Grain Technologies (8), Botanic Gardens And Parks Authority (7), Irish Potato Marketing (6), Valley Seeds (6) and Grain Research and Development Corporation (5).
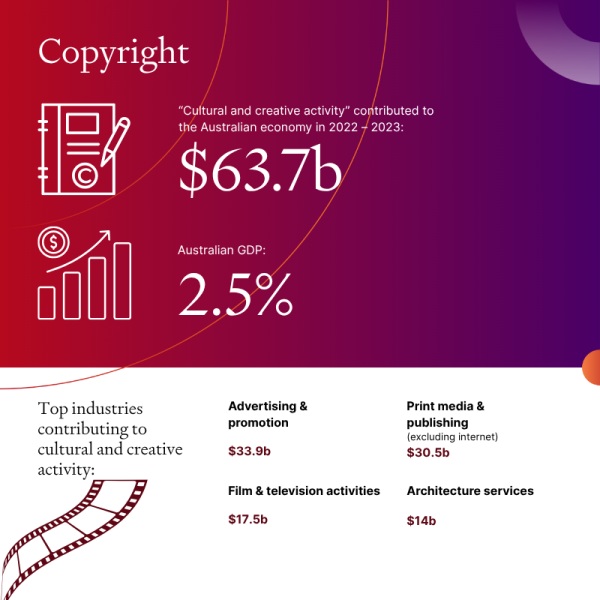
Copyright
The Report notes that "cultural and creative activity" contributed $63.7 billion to the Australian economy in 2022 – 2023, representing 2.5% of Australia's GDP.
The Report also confirms the extensive level at which copyright material is used. For example, in 2023 – 2024, copyright owners in the music industry received a total of $630 million. Further, $107 million was distributed to more than 22,000 rights holders including writers, artists, publishers and agents by Copyright Agency Limited (CAL). $48.4 million was distributed by the Phonographic Performance Company of Australia (PPCA) to its members, and $50.1 million was distributed to copyright owners in the audiovisual sector such as producers, directors, broadcasters and agents.
Research program
Apart from the statistics, the report also details IP Australia's research programs. The three main programs include: the Office of the Chief Economist (OCE), the Data and Analytics, and the IPAVentures. These programs accomplish many things, for example: the OCE produces evidence and advice to inform IP policy, increase understanding about the IP system's economic role and impact, and improve operational effectiveness in the administration of IP rights; the Data and Analytics offers a patent analytics service and a data 'front door' service to external stakeholders for addressing data-related queries across different IP rights; the IPAVentures aims to support the IP Australia's vision of creating a world-class IP system and promoting prosperity for Australians.
The Report, and these programs, are well worth a more detailed review for interested parties.
Reach out to the team
For all of your IP advice, filing, strategy, prosecution and legal needs, Spruson & Ferguson has experienced IP and industry experts across all areas of science and technologies, connected as one firm, located in 10 offices in the APAC region, filing in over 25 jurisdictions.
Our services can assist you and your business with 360° protection. Click on our authors for more information on their background or reach out to our team for assistance.
Footnote
1 Australian IP Report 2025 | IP Australia
The content of this article is intended to provide a general guide to the subject matter. Specialist advice should be sought about your specific circumstances.