

This article from Ropes & Gray LLP is most popular:
- in United States
Key Takeaways
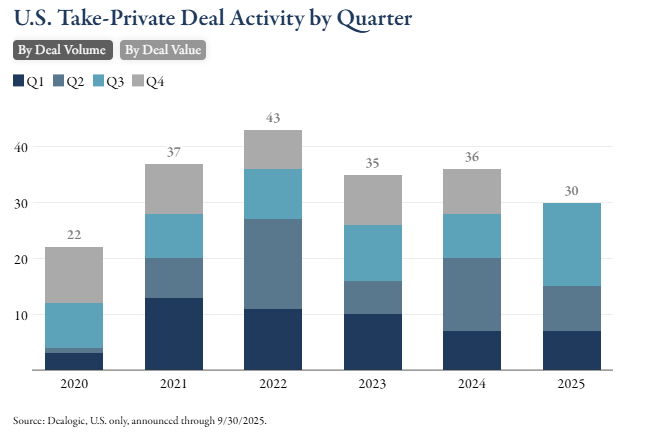
- Take privates: The number of take-private deals jumped in Q3 2025, reaching the highest quarterly total since Q2 2022. YTD deal value for take privates has already surpassed the full-year totals for both 2024 and 2023.
- Exits: The number of U.S. PE exits increased in Q3 2025 after falling in Q2, and YTD exit values are up almost 60% compared to 2024 YTD.
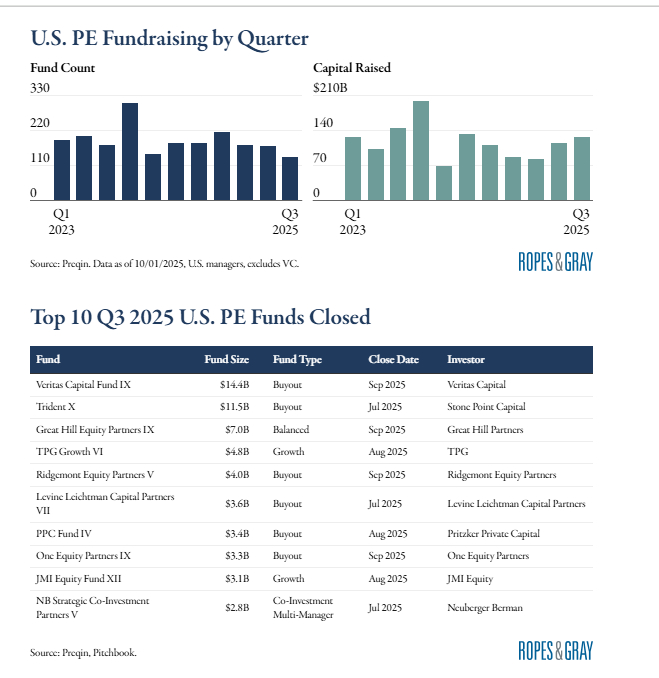
- Capital concentration: Q3 marked the third consecutive quarterly decline in number of funds closed while capital raised increased, highlighting growing capital concentration among larger funds.
- Shorter fundraising period: Funds closed in 2025 took, on average, 18 months to close, significantly faster than closing periods in 2024.
U.S. PE Deal Activity
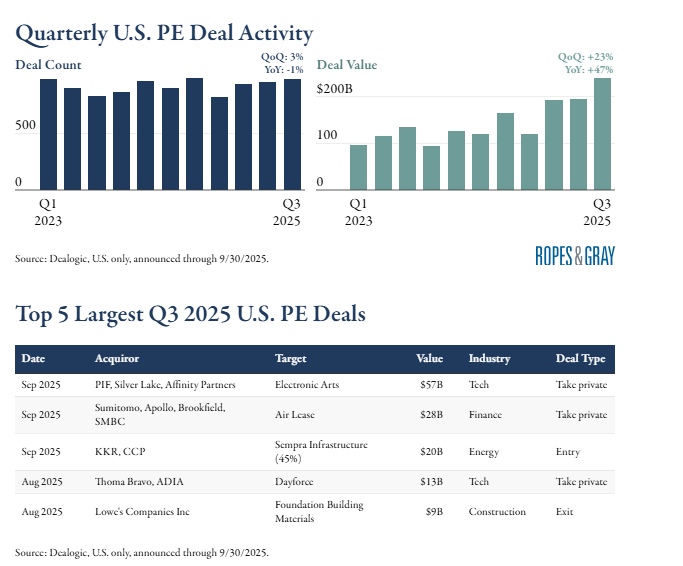
- Q3 deal activity: U.S. PE deal activity increased for the third consecutive quarter in Q3 2025. However, deal counts are slightly down YoY compared to Q3 2024.
- Deal value: Deal value continued to climb in Q3 2025 and benefited from the $56 billion EA take private deal, the largest PE buyout deal in history.
- Take privates: Q3 2025 saw a bump in take privates, reaching the most take-private deals in a quarter since Q2 2022. Deal value for YTD take privates has already surpassed full year values in each of the prior two years.
Industry Trends
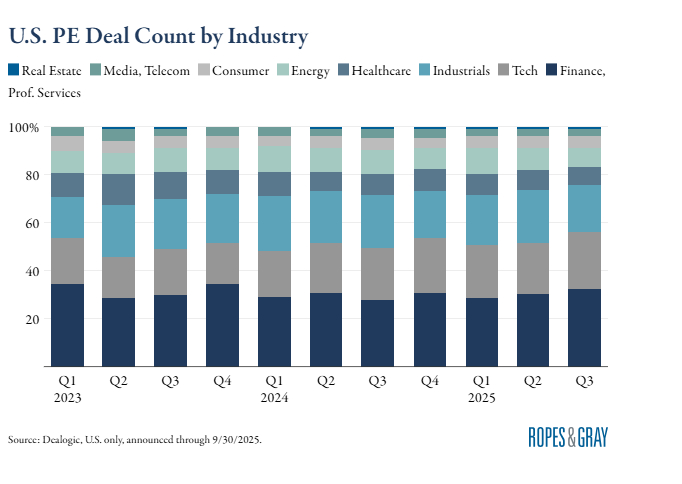
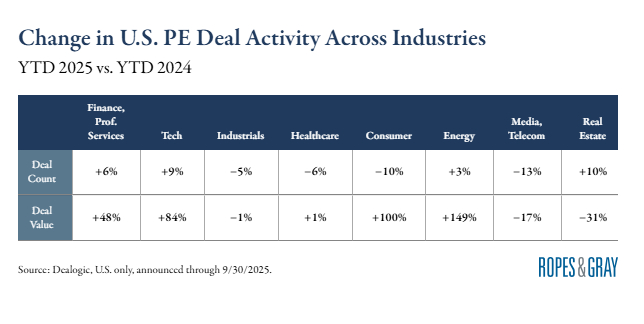
- Most active: Finance and tech continue to have the highest levels of deal activity, making up over 50% of U.S. PE deal counts this year.
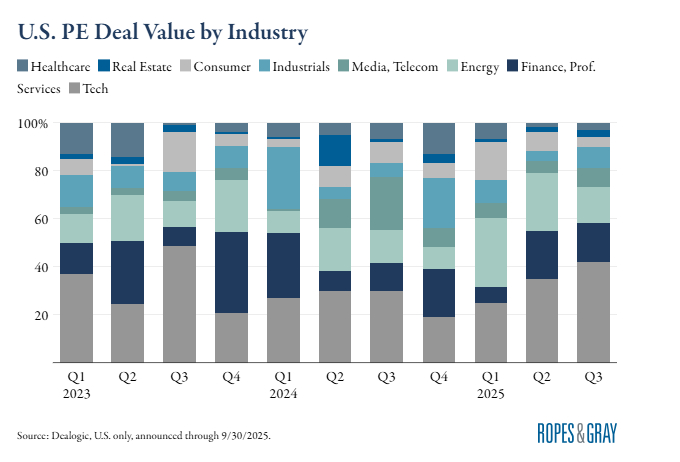
- Highest value: Tech U.S. PE deal value has climbed over the last three quarters, reaching over $100 billion in Q3 alone. On a YTD basis, the energy sector has seen the largest growth in deal value, jumping almost 150% from YTD 2024.
- Decliners: Media and telecom along with consumer have experienced the largest YTD declines in deal activity, at 13% and 10%, respectively.
Exits
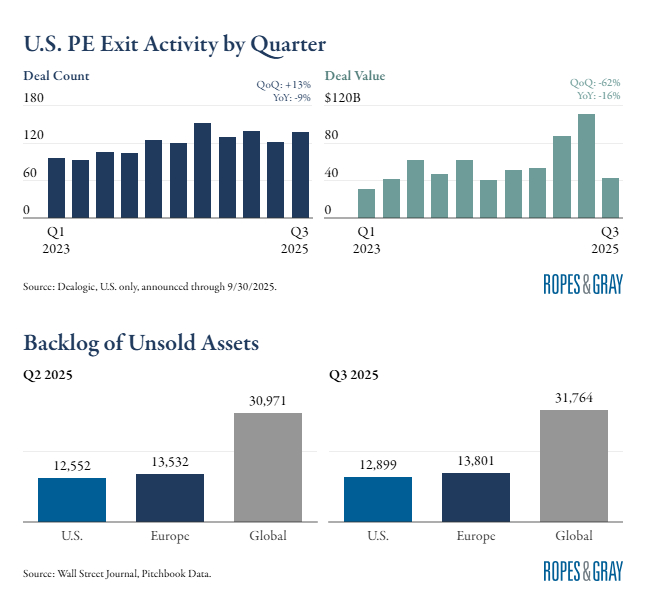
- Exits: The number of PE exits increased in Q3 2025 after dropping last quarter and YTD exits are in line with last year.
- Exit value: U.S. PE exit value dropped in Q3 with only two exits over $5 billion, down from eight exits over $5 billion in Q2. On a positive note, YTD exit value is up almost 60% from 2024 YTD.
- Unsold assets: The number of unsold assets slightly increased in Q3 by ~3% as investments outpaced exits. As of the end of the quarter, U.S. assets made up 43% of global unsold assets.
LBO Activity
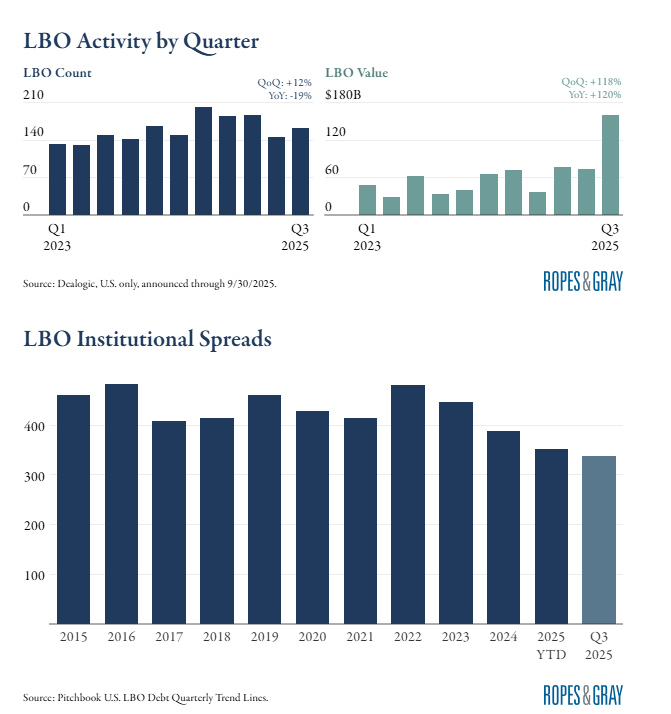
- LBOs: Q3 2025 LBO activity increased compared to the prior quarter for both deal count and value. Value jumped to historic highs with the EA deal being the largest LBO in history.
- Spreads: The third quarter saw further spread compression for institutional LBO loans. Declining spreads combined with Fed rate cuts should help spur deal activity.
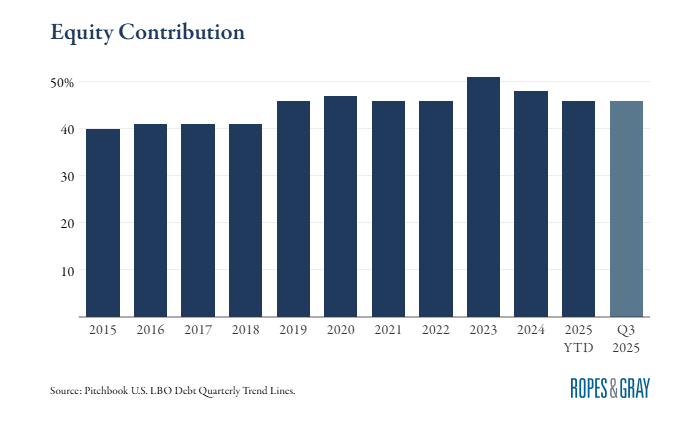
- Equity contribution: As the cost of debt falls, U.S. LBO equity contributions also continue to tick down. However, equity contributions remain above the norms of ~40% seen from 2015-2018.
Fundraising Trends
- PE fundraising: In Q3, the number of closed funds fell while the amount of capital raised increased to its highest since Q2 of last year. This marks the third consecutive quarter of fewer funds closed and higher capital raised, reflecting an ongoing trend of capital consolidation among larger funds.
- Top 10 Q3 funds: Buyout strategies led, making up a majority of the top 10 largest U.S. PE funds closed in Q3. All the largest funds in Q3 were closed by experienced managers, with funds on their 4th vintage or greater.
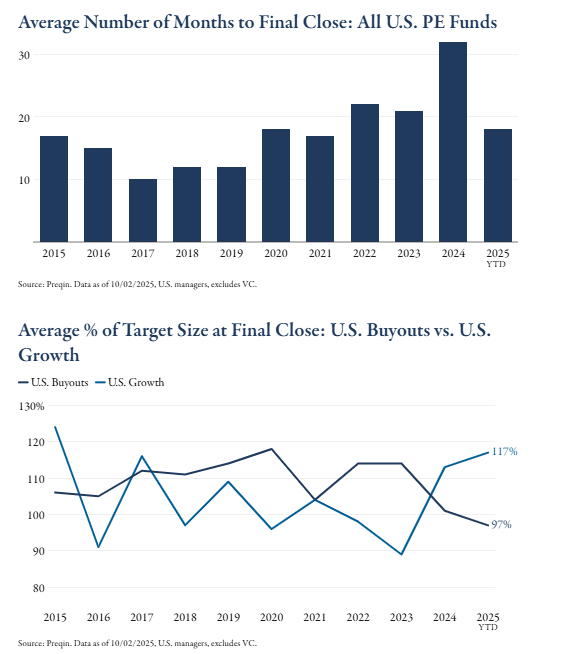
- Time spent fundraising: U.S. PE funds closed in 2025 YTD have taken an average of 18 months to close, down from 32 months for funds closed in 2024.
- PE fundraising momentum: Despite a challenging
fundraising environment, U.S. PE funds have been able to exceed
targets in 2025 YTD through Q3. However, there is a bifurcation
between buyout and growth strategies:
- Buyouts: As of early October, closed U.S. buyout funds raised only 97% of their targets on average. This is the lowest since 2010, which is also the last time when the average fund closing was less than its target size.
- Growth: Conversely, closed U.S. growth funds have found success. These funds are reaching 117% of targets on average, the highest for the strategy since 2015.
A Look Ahead
- Rates: The Fed announced a 25-basis point rate
cut at their September meeting and rates are expected to drop
another 50 basis points by the end of the year.
- The anticipated rate cuts improve outlook for private markets activity with lower costs of capital and improved deal economics.
- PE is expected to see an increase in both investment and exit activity because of the rate cuts.
- Secondaries: On a recent Goldman Sachs
Exchange podcast, industry players shared they expect secondaries
growth to accelerate from its current 15% pace. Verdun Perry,
Global Head of Blackstone Strategic Partners, predicts that
secondaries will reach $220 billion in 2025 and $400 billion by
2030.
- Future growth will be driven by the large amounts of capital raised in private markets and need for liquidity, expansion into asset classes outside of private equity, including private credit, infrastructure, and real estate, and various retail market offerings.
- The continued growth of the secondary market has the potential for broad market implications. While secondaries are seen as a net positive in alternative asset space, they may also impact public markets by enabling companies to stay private for longer.
- Sports: Private equity ownership of major U.S.
sports teams continues to rise.
- S&P Global Market Intelligence data shows through mid-October, PE and VC firms increased over $6 billion in sports-related transactions this year, the highest value in at least eight years.
- Sports continues to attract attention from the private capital industry, with a growing number of firms launching strategies or raising sports-related funds.
- AI: A recent Deloitte survey found that AI
adoption continues to accelerate within M&A.
- 86% of respondents have integrated GenAI into M&A workflows and daily activities, of which about three quarters adopted these tools within the last year.
- This investment into AI is meaningful, with 88% of PE firms investing $1+ million in AI for their M&A teams. A majority expect investment to increase over the coming year.
- Currently, GenAI use is skewed toward pre-signing and early deal stages, including market assessment, target screening, and due diligence. Looking forward, these technologies will likely expand to post-deal stages with performance monitoring and operational improvements.
The content of this article is intended to provide a general guide to the subject matter. Specialist advice should be sought about your specific circumstances.
