

- within Intellectual Property, Media, Telecoms, IT, Entertainment and Finance and Banking topic(s)
- with readers working within the Accounting & Consultancy, Technology and Securities & Investment industries
INTRODUCTION
For young Americans coming of age today, the road to economic opportunity runs through the halls of higher education.1 Unfortunately, that path has grown financially challenging. Tuition at four-year public schools, where most postsecondary students study,2 outpaced inflation by nearly six percent over the past decade.3 Prices at community and private nonprofit colleges jumped as well.4 At public institutions, falling state and local appropriations continue to drive tuition hikes.5
Students increasingly rely on loans to finance their education,6 and they are borrowing increasing amounts.7 Nearly one in five American households has student loan debt,8 amounting to 37 million individual Americans9 and more than one trillion dollars in education debt.10 Although postsecondary degrees remain lucrative investments,11 large monthly payments and high youth unemployment have pushed many borrowers into default.12 College affordability has become one of the signature policy challenges facing our country.
A crucial component of limiting the price students pay for college is simply providing them with better information. Earlier this year, NERA Economic Consulting ("NERA") and Young Invincibles ("YI") surveyed high-debt borrowers about the problem.13 The results were striking: over two-thirds of respondents expressed some misunderstanding or surprise about their student loans, particularly relating to repayment terms, monthly payments, and interest rates.
Recently, we followed up with an even larger survey to dig deeper into the role of information in the financial aid process. We again targeted high-debt borrowers, who reported receiving higher than average grant aid-individuals likely to interact considerably with the financial aid system. With help from YI's partners, NERA surveyed over 27,000 people with at least some higher education about their experience with financial aid. In this report, we focus on a subset of about 13,000 respondents who received financial aid and are either current students or recent graduates (i.e., within the past five years) of postsecondary degree programs.
The survey results tell a discouraging and familiar tale: financial aid is extremely important to ensure college access and completion, but many students with financial aid desperately need a better information "roadmap" to help them navigate the process. This is particularly true for people like our survey respondents, whose average debt amount places them in the five percent of student loan borrowers who owe more than $75,000 in student loans. Among these highly indebted current students and recent graduates:
- Fully 40 percent of respondents with federal loans reported that they did not receive any form of counseling (either online or in-person) about their federal student loans, even though this counseling is mandated by law.
- Over 90 percent of federal financial aid recipients would support standardizing the format, terminology, and content of financial aid award letters.
- Over 40 percent of federal financial aid recipients reported that they either did not receive accurate information about grants and loans, or did not know whether they had received accurate information.
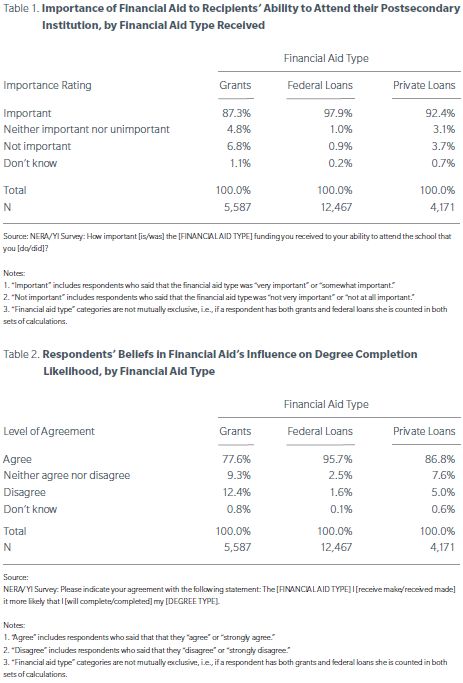
Lacking quality information about financial aid can have serious consequences. Overwhelming majorities of those with grants and loans indicate that they depend upon this aid to access and complete their postsecondary education. Nearly all, or 98 percent of federal loan recipients, 92 percent of private borrowers, and 87 percent of grant recipients felt that financial aid was important to their ability to attend their school (Table 1). In addition, 96 percent of federal loan borrowers, 87 percent of private loan borrowers, and 78 percent of grant recipients agreed that the aid type(s) they received made it more likely that they would complete or did complete their degree (Table 2). As we will later illustrate, the grant amounts respondents received are much lower than their loan amounts-this may explain why fewer respondents indicated that grants are important to their college access and completion.
If students lack accurate information about grants and loans, they may miss opportunities to fund their education or may make financially damaging choices. It is not clear whether the higher-than-average debt held by our respondents is reflective of personal financial circumstances, school choice, or something else. It seems likely, however, that lacking clear information and proper counseling to help guide smart borrowing decisions may be among the list of possible reasons for these high debt levels. Indeed, knowledge and counseling alone will not solve every financial aid challenge, or bring tuition increases screeching to a halt. But students are lost without it. The essential pillars of our financial aid system should include providing a "roadmap" for students with a reliable and accessible process for acquiring financial aid, and support to help students though the financial aid process.
In our policy recommendations section, we propose three principals for reform: (1) enforce entrance and exit loan counseling requirements; (2) support high-school counseling about financial aid; and (3) simplify financial aid forms. We also include specific commonsense recommendations that our policymakers should consider.
METHODOLOGY
NERA, a global economic consulting firm, and Young Invincibles, a leading youth advocacy organization dedicated to expanding opportunity for 18- to 34-year olds, collaborated and designed an online survey to gather data on beliefs about issues surrounding financial aid and financial aid policy. Harris Interactive-a highly-regarded research company whose clients include academic and professional organizations, as well as large corporations-programmed the questionnaire and hosted data collection on its servers.
The survey population was comprised of individuals with at least some higher education (i.e., any education beyond high school)14 since this is the group of people who are most likely to have had direct experience with financial aid in the form of loans and grants. We sent email invitations to participate in the survey to individuals on YI's mailing list, as well as to the mailing list of one of YI's partner organizations, Student Debt Crisis. In total, the survey was sent to over 1.5 million email addresses and about 27,000 respondents completed the survey. Appendix A includes additional detail on data collection procedures.
THE SURVEY POPULATION
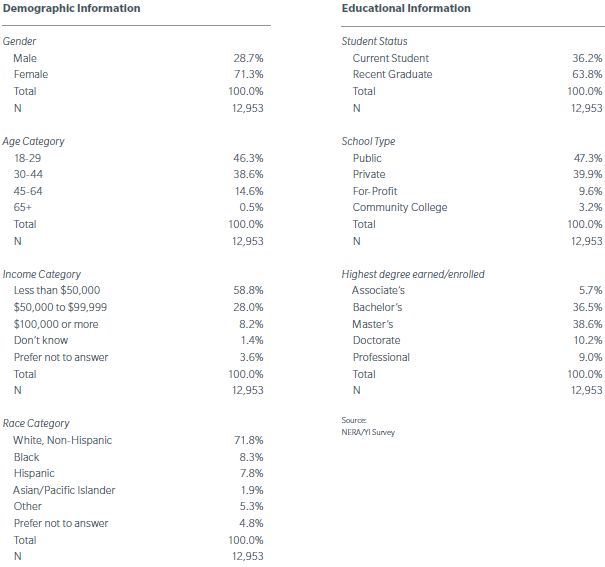
For this report, we focused on the respondents to our survey who are most likely to be affected by recent financial aid policy. We limited the survey population to respondents who met two criteria: (1) they were either currently enrolled in higher education ("current students") or were degree recipients who graduated between 2007 and 2012 ("recent graduates"), and (2) they received financial aid in the form of loans and/or grants.15 Implementing these criteria for inclusion limited our analysis to a subset of 12,95316 respondents: 4,686 current students and 8,267 recent graduates.
The sample of respondents included in this report is not a probability sample and therefore the results cannot be generalized to the larger population(s) of current students/recent graduates. We note, however, that this is the ideal group to study to gain perspective on issues related to student financial aid. The students included in our survey are most likely to be (1) affected by financial aid policy, and (2) concerned about financial aid by virtue of being on the mailing list of organizations dedicated to student loan debt reform. In Appendix B, we provide further detail on the demographic characteristics of our volunteer sample.
Because the survey respondents are more likely to care about topics related to financial aid, and specifically about student loans, they are also more likely to have student loans than the population of current students and recent graduates. We asked respondents about various types of student loans they may have: federal loans, i.e., loans borrowed from the federal government;17 private loans borrowed from banks or other lenders; and Parent PLUS loans, which parents may borrow on behalf of their children.
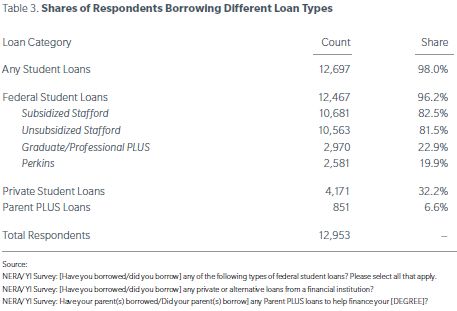
Respondents were more likely than their peers in the population to have student loans. Taken together, 98 percent of respondents reported that they had borrowed student loans (Table 3), compared to about 40 percent of the population of undergraduate and graduate students18 and about two-thirds of recent college graduates.19 Nearly all (96.2 percent) respondents had federal student loans, about two-thirds (32.2 percent) had private student loans, and about 7 percent had parents who had borrowed Parent PLUS loans. Almost all, or about 95 percent, of borrowers with private loans also had federal loans.20
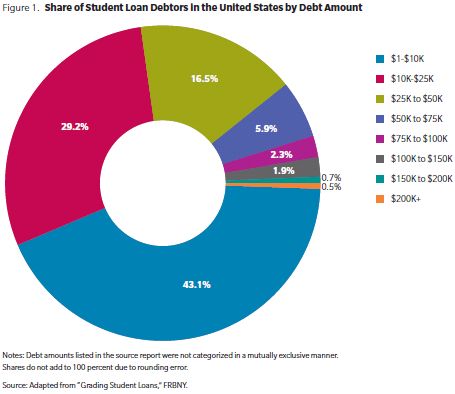
In addition, the respondents to our survey had much higher amounts of student loan debt, on average, than the population of current students and recent graduates.21,22 The overall average debt amount for respondents included in our analysis was just over $75,000. This places the average respondent to our survey in the five percent of student loan borrowers who owe more than $75,000 in student loans (Figure 1).
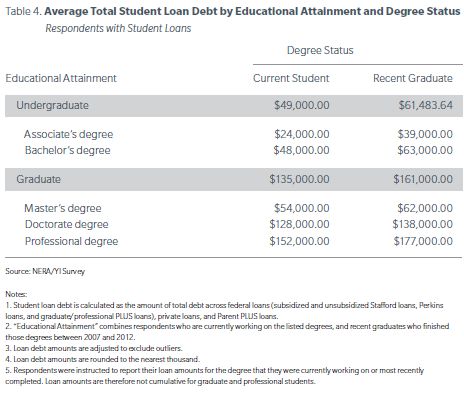
As shown in Table 4, however, the average amount of debt varies considerably depending on (a) whether the student is a current student or recent graduate, and (b) the type of degree that the respondent is working on or has recently earned. For instance, students currently working on their associate's degrees have the lowest debt amount, about 24,000 on average, while recent professional degree recipients have the highest debt levels, averaging nearly $180,000 (Table 4). Though the magnitude of these numbers speak for themselves, the available data also suggest that these figures are high: for instance, the bachelor's degree recipients with loans in our survey owe an average of about $63,000 in education loans-2.5 times greater than the average of $25,000 for all bachelor's degree recipients with student loan debt.23
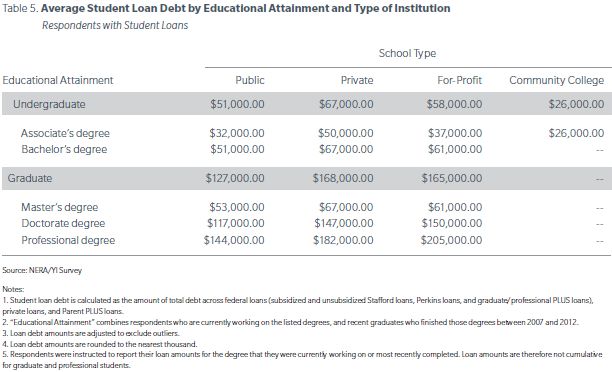
The total average amount of student loan debt also varies by the type of school the respondent attended. Community college students had the lowest debt levels and professional degree students at for-profit universities had the highest debt levels (Table 5). These trends are logically consistent and indicate that our respondents answered the survey questions about their debt amounts thoughtfully and sensibly.
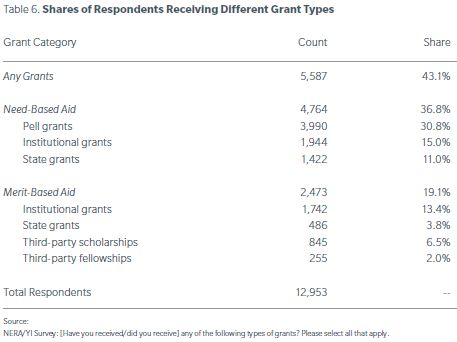
A large proportion of respondents to our survey also received some form of grant aid: 19 percent of respondents received some merit-based aid24 and 37 percent received need-based aid25-43 percent received either or both need- or merit-based aid (Table 6). Within these two grant categories, respondents were more likely to report receiving certain grant types. About one-third reported that they received need-based Pell Grants, and about 13 percent reported receiving merit-based institutional grants (i.e., grants from the respondents' college).
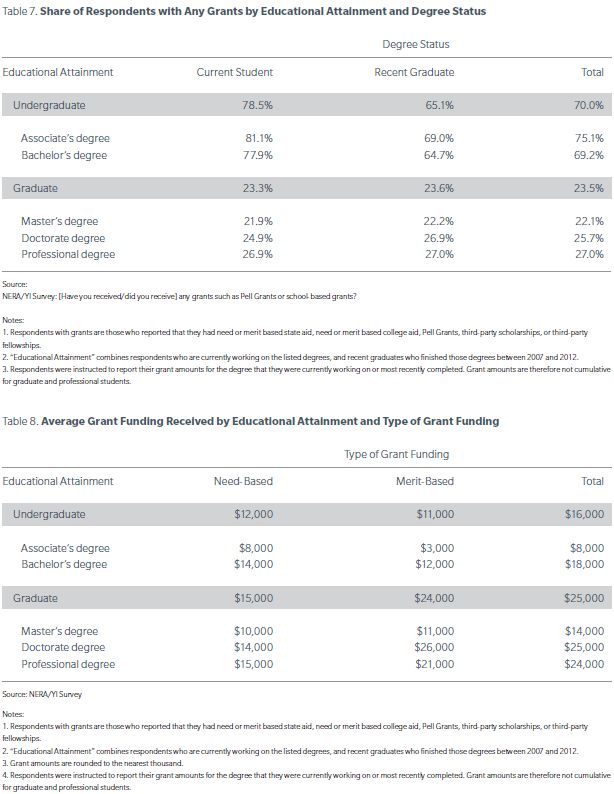
Broken out by education level, 70 percent of undergraduate students and 24 percent of graduate students received grants (Table 7) as compared to about 50 percent of undergraduates and 40 percent of graduate students in the population as a whole.26 Compared to national trends, undergraduates in our survey population were more likely to receive grant aid and graduate students were less likely to receive grant aid.
Also in contrast to the population, the respondents to our survey received higher than average amounts of grant funding. During the 2007 to 2008 academic year, the average amounts of merit aid and need-based grants for undergraduates in the student population were $4,700 and $4,000, respectively.27 Current undergraduates and those with a bachelor's or associate's degree in our survey, however, reported much higher grant amounts of an average $11,000 in merit-based aid and $12,000 in need-based aid (Table 8). The comparable numbers for graduate students were $24,000 and $15,000. Though there are fewer graduate students with grant funding compared to undergraduates, graduate students that have grant funding receive high amounts of aid.
THE ROLE OF INFORMATION AND COUNSELING
Our survey respondents rely heavily on financial aid to afford higher education, suggesting that it is critical to provide aid recipients in this group with accurate information about their grants and loans, or else they could suffer serious financial consequences-and perhaps already have. Indeed, our previous research indicates that aid recipients lack accurate knowledge far more often than they should.28 In this study, we aim to build off our prior research to understand how we might more effectively provide information to uninformed or under-informed borrowers. We take a close look at the student's role in applying for financial aid, the accuracy of the information they receive, and the sources from which they actually obtained information and would prefer to obtain information about grants and loans.
The majority of respondents report taking personal responsibility for the financial aid application process, but far too many indicate that they do not receive accurate information. Although they report learning about financial aid from various sources, they would like to hear more from their colleges, the government, and their high school counselors.
Information: Who to Target?
Helping students navigate the financial aid system first requires understanding who applies for financial aid. After establishing which type(s) of aid respondents received, we asked them who applied for their grants, federal loans, and/or private loans. Respondents could choose "me," "both me and my parents," "my parents," "other," or "don't know."
Across all three aid categories, large majorities reported taking personal responsibility for filling out the application. This included 83 percent of federal loan borrowers, 80 percent of grant recipients, and 68 percent of private loan borrowers (Table 9). If we include students who said that both they and their parents applied, the totals for grants, federal loans, and private loans, respectively, are 98 percent, 92 percent, and 95 percent.
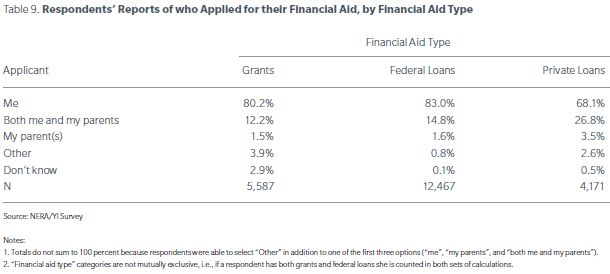
These numbers strongly suggest that any strategy to increase understanding of financial aid must center on educating students themselves. Focusing on students does not imply that parents and siblings should be ignored-though respondents claim responsibility for aid applications, they may also receive advice and guidance from their families. Until further research investigates how families and students apply for financial aid, our respondents' clear ownership of the application process suggests information campaigns should assume that students will be the ones clicking "submit."
Borrowers' Perceptions of Information Accuracy
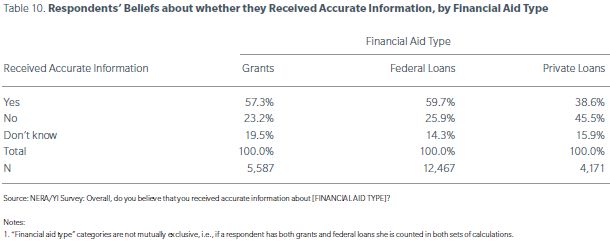
After establishing that our respondents assume primary responsibility for applying for their financial aid, we asked whether they had received accurate information about their grants and loans. Despite the fact that colleges are legally required to provide accurate information about financial aid,29 only about 60 percent of grant and federal loan recipients answered affirmatively that they had received accurate information (Table 10). Others felt even less optimistic: alarmingly, only 40 percent of private loan borrowers said they had received accurate information. Overall, an unacceptably large number of respondents did not believe that they received accurate financial aid information.
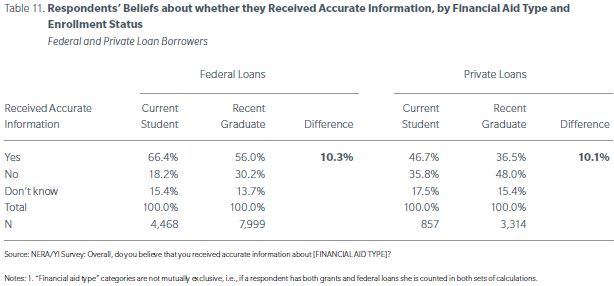
Worryingly, the data also suggest that after graduation, respondents lose confidence in the accuracy of the information they received. Recent graduates with federal loans and private loans were 10 percentage points less likely than current students to report that they got accurate information about their loans (Table 11).
This difference could suggest that financial aid education has improved between the time recent graduates left school and current students entered. However, it may also indicate that borrowers only learn about the details of their loans after they graduate and enter repayment. Previous research by NERA and YI illustrated exactly that: high-debt borrowers often do not have a clear idea about the consequences of the loans they take out, with many experiencing misunderstanding or surprise regarding repayment terms and interest rates.30
Actual and Preferred Sources of Information
In addition to inquiring about the accuracy of information respondents received, we also asked about the sources from which they (a) received information and (b) would have preferred to receive information about their grants, federal loans, and private loans.
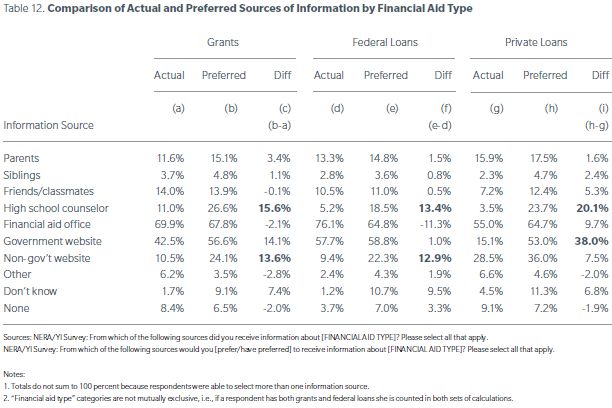
The majority of students with grants or federal loans received information about these sources of aid from their college's financial aid office and/or a government website (Table 12, Columns A and D). Though private loan recipients also reported receiving information most frequently from their college's financial aid offices, non-government websites (e.g., websites for private lenders) were the second most common source (Table 12, Column G).
Given that the majority of respondents relied on just two main sources of information (i.e., their college's financial aid office or a website), we expected they would report wanting to receive information from other outlets as well. However, the opposite proved true. When asked about where they would prefer to receive their information, they again emphasized their college financial aid offices and government websites (Table 12, Columns B, E, and H).
Furthermore, we compared respondents' actual and preferred sources of information to gain insight into the sources from which they desire additional knowledge. Across all three aid types, between 13 and 20 percent more respondents preferred to receive information from their high school counselors than actually received information from that source. This discrepancy suggests that some aid recipients wanted early guidance about financial aid from their high school counselors and may have benefited from more information prior to starting college.
Notably, nearly 40 percent more private loan borrowers would have preferred information from a government website than actually received information from that source. It appears that these borrowers either (a) are not getting sufficient information from their private loan lenders, or (b) trust that the government would provide them with accurate (or more accurate) information. It may also be that private loan borrowers looked for information on government websites, but did not find the answers to their questions. These results suggest that private loan borrowers in particular need clearer information about their loans.
Between 7 and 14 percent more respondents would also have preferred to receive information from non-government websites than actually did. This indicates that apart from government websites and the college financial aid office, respondents are receptive to third-party websites (such as FinAid.org) offering information on financial aid.
Encouragingly, the results suggest that financial aid recipients do turn to their college counselors and the government as trusted information sources. Policymakers should take note that many students prefer to learn about grants and loans from college financial aid offices and government websites. It is therefore crucial that these sources provide clear, accurate information designed to meet the needs of financial aid recipients. The results also suggest that some aid recipients may have benefited from learning about financial aid while in high school (i.e., before applying and/or borrowing).
DISSEMINATING INFORMATION TO FINANCIAL AID RECIPIENTS
The question of "who" provides financial aid information to students is important, but "how" they receive information matters as well. Students today have more avenues to access information than any previous generation: apart from traditional postal mail and in-person discussions, they can consult the web, social media, and mobile technology. Picking the right pathway to disseminate financial aid information is essential to ensure that it reaches today's young people.
Methods of Disseminating Information
We hypothesized that students and recent graduates may want financial aid information through familiar informal media, such as text messaging and social networks. After all, "Millennials," many of whom have grown up with cell phones and the Internet, are the most tech savvy generation in our country's history.31 However, we were wrong-relatively few of our respondents preferred receiving information via these modes (Table 13).
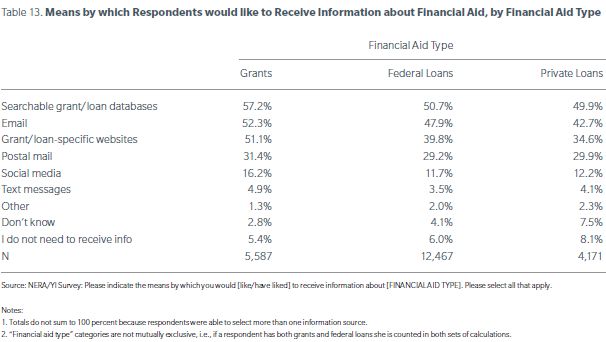
While respondents showed little enthusiasm for more "informal" means of digital communication, they did express a desire to obtain financial aid information through other digital sources such as email, grant/loan specific databases, and grant/loan specific websites. Both the government and third parties should take note of students' preferences ensuring that the digital information about financial aid that they offer to borrowers is accessible, comprehensive, and clear.
Federal Student Loan Counseling
Another key means of disseminating information to students occurs through federal loan counseling. The federal government requires that colleges give student loan borrowers "entrance" counseling when they take out their first loan, and "exit" counseling before they graduate or otherwise leave school. The purpose of federal student loan counseling is to ensure that borrowers understand the responsibilities and obligations they are assuming by taking out student loans. The counseling covers topics such as the different types of federal student loans, interest rates, and repayment plans.32
Despite the fact that the federal government mandates entrance and exit counseling, over 40 percent of respondents with federal loans told us that they had not received loan counseling (Figure 2). There are several explanations for this statistic. First, colleges may not be adequately complying with the legal requirement to provide counseling. Second, lax standards may allow schools to offer poor quality programs, which students do not recognize as counseling. Third, borrowers may not remember that they received counseling resulting from poor quality or students simply forgetting. It will require further research to fully understand this feedback, though the responses strongly suggest the loan counseling system is not working for students.
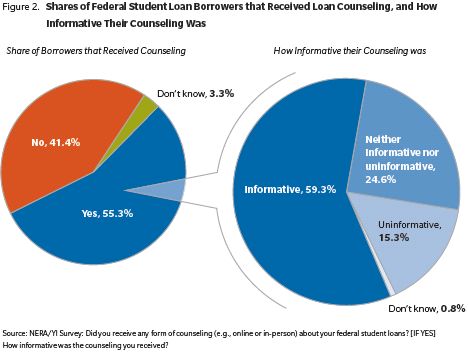
Among the 55 percent of federal student loan borrowers who did recall receiving student loan counseling, the majority, or 59 percent, found it either somewhat or very informative, while 41 percent either found it somewhat or very uninformative or had no opinion.33 In other words, 4 in 10 people who had or remember having counseling seem to have gained very little from the process.
We also asked respondents with federal student loans who said that they received counseling to tell us what, if anything, they would change about the federal student loan counseling process. Of these, 42 percent gave a substantive answer that we analyzed to glean further information about how to improve student loan counseling.34 The survey respondents tended to comment on two broad topics: (1) the format of the counseling, and (2) the content of the counseling.
First, many respondents commented on the format of the counseling, i.e., whether they received the counseling online, in-person in a group, or in some other format. It is telling that about 15 percent of the respondents who said they would improve something about federal student loan counseling mentioned that they would make the counseling more personal. Apparently, many students who received loan counseling felt that the format hindered their ability to learn about their loans. The majority of these respondents said they would prefer in-person counseling over online counseling. To illustrate:
Respondent 79764:35 "I would have a financial professional employed for the purpose of walking people through the process step by step. To help explain the system of interest and payment especially for students with little real life experience coming from high school."
Respondent 1295: "If you had to talk to a real person you would HAVE to take in the information. The online counseling requires you to open all the windows but it can't force you to read it- even with the quizes (sic) at the end of each section."
Respondent 29132: "Require in-person counseling/ over the phone counseling so there may be opportunities to ask questions during the process"
An even larger share of respondents who said they would improve something about federal student loan counseling mentioned the counseling content. Nearly half of these respondents said that the counseling could include more or better information on aspects of loans that our prior research36 has indicated students are often confused about: interest rates, repayment options and timelines, consolidation options, and information on the total amount owed and estimated monthly payments. Although federal law requires that counseling include many of these topics,37 our survey suggests that the borrowers either do not receive or remember the information.
Respondent 3927: "Point out the important things like interest rates loan origination fee percentages and crucial information more apparently. I felt like the counseling I received told me things that I mainly already knew and didn't highlight the most important numbers"
Respondent 42544: "Make the different repayment options clearer esp. opportunities for loan forgiveness. I didn't understand that I might I (sic) qualify until 2 years later!"
Respondent 70384: "What I didn't really understand was how much I would be having to pay back per month. I wish that there could have been a simulator -i.e. here's what's available to you. If you do this option with this repayment plan here's how much you'll be on the hook for in a given month... I wish I had seen that presented more forthrightly. I might have found ways to borrow less."
In addition, approximately 10 percent of respondents who recalled getting counseling wanted it made simpler, easier to understand, more straightforward, etc. For example:
Respondent 27670: "I think there needs to be a much more approachable way to go about learning how to repay the loans. Much of the information was provided in "legalese" that made it difficult to understand"
Respondent 66130: "Students need to be able to read about their student loans in "plain English." It is extremely difficult to sift through the mounds of papers e-mails and websites to find what is needed."
Respondent 67031: "The information is too fragmented and complex. The system needs to be streamlined and simplified."
In sum, students want loan counseling to include better information, more personal contact, and simpler explanations. Moreover, respondents expressed well-reasoned opinions about the federal financial aid process, demonstrating that future efforts to improve the federal financial aid system should include the direct input of students.
STUDENTS' AGREEMENT WITH POLICY PROPOSALS
Many students find the federal financial aid forms difficult to understand. Academic research suggests that a simpler Free Application for Student Aid (FAFSA) could increase college access,38 and policy experts have argued for reforms.39 Indeed, the Obama Administration has encouraged postsecondary institutions to create a standardized financial aid award letter known as the "Financial Aid Shopping Sheet,"40 and over 300 institutions have voluntarily adopted it.41 Given the research and policy push towards simplifying the federal financial aid process, we asked students some direct policy questions about the issue.
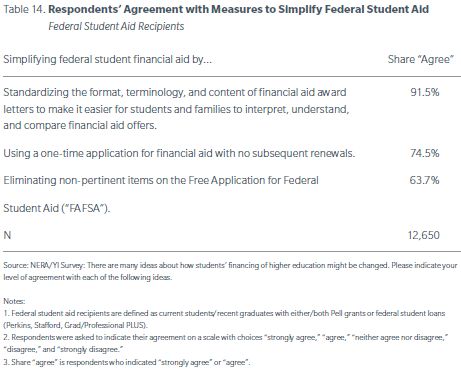
In general, highly indebted borrowers with federal student aid expressed support for measures that would simplify federal financial aid. Over 90 percent of these respondents agreed with creating a standardized financial aid award letter with common definitions and clear terms (Table 14). This suggests that students find the "status quo" financial aid award letters complicated and that the Financial Aid Shopping Sheet may address an important problem.
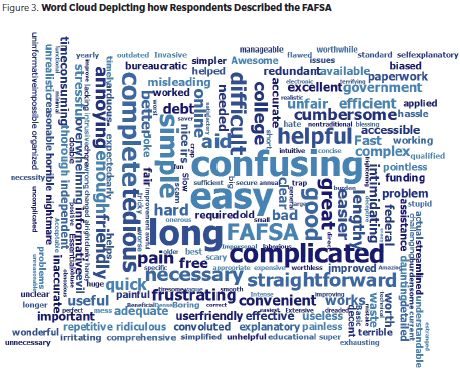
Unfortunately, students also find the FAFSA overly complicated, a problem long recognized by higher education policymakers. In 2009, the Obama Administration responded by simplifying the notoriously confusing form. To get a sense of how borrowers felt about the FAFSA, we asked an open-ended question: "If you could choose only a few words, how would you describe the Free Application for Student Financial Aid?"
Figure 3 presents a word cloud indicating words that respondents most commonly used to describe the FAFSA. Many respondents used negative adjectives such as "confusing," "complicated," "long," and "tedious" to describe the FAFSA, while others used positive words such as "easy," "simple," and "straightforward." The cloud illustrates respondents' mixed feelings about the FAFSA and suggests there remains plenty of room for improvement. Though this analysis includes respondents who had experience with either/both the new and old FAFSA forms, the lingering confusion supports many advocates' view that simplification efforts should go further.42
We also measured student agreement with simplifying the FAFSA by asking students with federal student aid two direct questions about policy reform. First, we asked if they would support a one-time FAFSA application, meaning that a student need only fill out the FAFSA at the beginning of their degree program, and fully 75 percent agreed (Table 14).43 Next, we asked about eliminating certain non-financial questions on the FAFSA, such as questions about drug convictions and driver's license information,44 and two-thirds of borrowers agreed. Though these two proposed revisions to the FAFSA would require statutory changes, they would also decrease the complexity of the application process.
POLICY RECOMMENDATIONS
As a nation, our economic competitiveness depends on our ability to maintain a well-educated workforce. Moreover, an essential part of the American dream has always been for young people from all backgrounds to have the opportunity to advance themselves through hard work and education. To meet that goal, our higher education financing system requires a comprehensive overhaul to ensure that (a) college is affordable and accessible, (b) borrowers can manage their debt after graduation, and (c) students achieve positive outcomes such as degree completion and job placement.
Improved consumer information and a restructured counseling system are essential steps toward a well-functioning financial aid system. Clarity about aid will help students attend schools with the best grant and scholarship packages, borrow the cheapest loans, and make smart repayment choices. In short, better information can help control the price students pay for college and ensure that students avoid unmanageable amounts of debt.
The feedback from this survey points to the need to make delivery of accurate, understandable financial aid information a cornerstone of the federal financial aid system, on par with providing the grants and loans themselves. We offer the following three principles for policy change in this area:
- Effective Enforcement of Counseling Requirements
Dramatically increase the quantity and quality of student loan counseling by ensuring that:
- Schools and lenders comply with the law.
- Students who participate in counseling receive valuable information.
- Students have greater personal contact with college counselors
during the process.
Target college counselors and government websites, both trusted information sources:
- Build an interface into the federal student aid website that allows college counselors to walk through the process with students.
- Support professional development for college financial aid counselors.
- Continue to invest in the "Student Aid on the Web"
main site45 to improve its interface.
- Support High School Counseling
Support professional development for high school counselors about financial aid applications, and create materials targeted at these professionals.
Increase the number of school counselors across the country.
Support a national college-coaching program where recent bachelor degree graduates supplement the work of school counselors in America's high schools. YI has called for an "American Counseling Fellows" initiative, administered through AmeriCorps, to hire 30,000 recent graduates to work under experienced school counselors across the country. See YI's "Young American Ideas Book"46 for more details.
- Simplification
Further simply the FAFSA, as many students find it confusing and tedious.
Extend efforts to simplify financial aid award letters to colleges and universities across the country, building on current efforts by the Department of Education. Every award letter should have standardized definitions and content for easy comparison across schools.
Obviously, these policy recommendations alone are not sufficient to fix our college affordability problem. Successful reform will require a comprehensive approach, from increased public investment in higher education to innovations in the way we organize and deliver financial aid. But these common sense, low-cost recommendations would represent a major step forward which could empower millions of students to successfully navigate our higher education and financial aid systems.
APPENDIX A: DATA COLLECTION DETAILS
As noted above, we conducted an Internet survey with the assistance of Harris Interactive, a well-regarded research organization with a depth of experience conducting online surveys. Prior to fielding the survey, project managers at Harris, as well as staff at NERA and YI, conducted quality checks of the survey program to ensure that it was implemented properly.
It is standard practice when conducting any survey to begin with a pre-test or slow start to identify any potential issues with data collection.47 We therefore began by emailing the survey link to a portion of YI's email list.48 Data collection for the slow start began on Friday, 21 September 2012 and ended on Monday, 24 September 2012. From this slow-start, we received approximately 300 completed interviews and after reviewing these data confirmed (1) that the survey program was working as intended and (2) that the respondents understood and were able to answer the survey questions.49
On Monday, 24 September 2012, we sent the survey link to the remaining email addresses on YI's mailing list. In addition, we sent the link to the sizable mailing list of one of YI's partner organizations, Robert Applebaum's "Student Debt Crisis." By 26 September 2012, 27,204 respondents had completed the survey. Because we had received such a large volume of data within only a few days, we closed the survey on the afternoon of 26 September 2012.
Because the online survey was sent to a very large number of email addresses,50 it was not possible to send a unique survey link to each potential respondent, the approach that survey researchers typically take to ensure that each respondent takes the survey only one time. Harris Interactive therefore implemented "digital fingerprinting" technology to prevent this problem from occurring. If a respondent with an IP address that is associated with an already completed survey attempted to enter the survey again, Harris Interactive's technology did not permit them to complete the study a second time.
Harris Interactive also implemented other quality checks for the data, such as excluding any respondents who "sped" through the survey in too short an amount of time, or who "straightlined," or selected the same answer to all items in a grid question. These procedures ensured that we received high-quality data from respondents who were playing attention to the survey instrument.
APPENDIX B: SAMPLE CHARACTERISTICS
As noted in the main report, our sample of respondents is a volunteer sample, meaning that it is a group of people on YI and YI's partner's mailing list(s) who chose to participate in the study. We have prepared a series of tables describing the demographics of our volunteer sample of respondents.
APPENDIX C: DETAILS ON CODING VERBATIM RESPONSES
We have presented the results of coding an open-ended survey question which asked respondents, "What, if anything, would you improve about federal student loan counseling?" This question was asked of the subgroup of respondents who (1) said that they had borrowed federal student loans, and (2) said "yes" when asked "Did you receive any form of counseling (e.g., online or in-person) about your federal student loans?" There were 12,467 borrowers of federal student loans, and of these, 6,898 said that they had received counseling.
In response to this question, respondents had three options: filling in a text box explaining what they would do to improve about federal student loan counseling, marking a checkbox indicating they would change "nothing" about federal student loan counseling, or indicating that they did not know. Of the 6,898 borrowers who answered the question, just over 2,800, or 41.5 percent, chose to fill in the text box; 25.2 said they would change nothing; and 33.3 percent said "don't know."
Since coding each of the nearly 3,000 verbatim responses would have been prohibitively time consuming, we selected a random sample of 700 respondents to analyze and code. The sample of respondents was selected in proportion to the shares of the population made up by each of the two main population segments: current students, who account for 36.1 percent of the population, and recent graduates, who account for 63.8 percent. Of the 500 respondents in the sample, 42.6 percent, or 298 respondents, chose to fill in the text box; 24.9 percent said they would change nothing; and 32.6 percent said "don't know."
Because the sample was selected in proportion to the shares of the population comprised of current students and recent graduates, our coding of the 298 verbatim responses can be extrapolated to the full population of (.415*6,896=) 2,862 respondents who chose to answer the question verbatim.
Footnotes
1 See e.g. Demos & Young Invincibles (2011). State of Young America. Retrieved 7 October 2012 from http://www.demos.org/state-of-young-america, pp. 11-13; Carnevale, A. P., Rose, S. J., & Cheah, B.(2011). The College Payoff: Education, Occupation, and Lifetime Earnings. The Georgetown University Center on Education and the Workforce, p. 3.
2 Baum, S., Ma, J., and Payea, K.(2012). Trends in Public Higher Education: Enrollment, Prices, Student Aid, Revenues, and Expenditures. College Board Advocacy and Policy Center. Retrieved 4 October 2012 http://trends.collegeboard.org/downloads/Trends_in_public_higher_education.pdf.
3 The College Board (2011). Figure 4: Average Annual Percentage Increase in Inflation-Adjusted College Prices by Decade, 1981-82 to 2011-12. Trends in College Pricing 2011, Retrieved 2 October 2012 from http://trends.collegeboard.org/downloads/college_pricing/PDF/Trends_in_College_Pricing_2011_Tuition_Fees_Over_Time.pdf.
4 The College Board, Figure 4, Id.
5 See State Higher Education Executive Officers (2011). State Higher Education Finance FY 2011. Retrieved 2 October 2012 from http://www.sheeo.org/finance/shef/SHEF_FY11.pdf, p. 20; see also Kirshstein, R. J., & Hurlburt, S. (2012). Revenues: Where Does the Money Come From?. Washington DC: Delta Cost Project. Retrieved 6 October 2012 from http://www.deltacostproject.org/pdfs/Revenue_Trends_Production.pdf, p. 1.
6 For example, in the 1999-2000 academic year, the share of undergraduates using federal Stafford loans was 23 percent; by 2010-2011, this share had reached 34 percent. See: Baum, S., Payea, K., & Cardenas-Elliot, D. (2010). Trends in Student Aid 2010. p. 15, Figure 6. New York, NY: College Board. Retrieved from the College Board website: http://advocacy.collegeboard.org/sites/default/files/2010_Student_Aid_Final_Web.pdf; College Board (2011). Trends in Student Aid 2011. p. 15, Figure 6. Retrieved 19 March 2012 from http://trends.collegeboard.org/downloads/Student_Aid_2011.pdf.
7 The aggregate amount that students borrowed in federal loans rose from $42b in 1999-2000 to $104b in 2009-2010-a 148 percent increase. See: Baum et al., Id., p. 10 Table 1; College Board, Id., p. 10 Table 1.
8 Pew Research Center (2012). A Record One-in-Five Households Now Owe Student Loan Debt. Retrieved 6 October 2012 from http://www.pewsocialtrends.org/files/2012/09/09-26-12-Student_Debt.pdf.
9 Brown, M., Haughwout, A., Lee, D., Mabutas, M., & van der Klaauw, W (2012). Grading Student Loans. Federal Reserve Bank of New York. Retrieved 2 October 2012 from http://libertystreeteconomics.newyorkfed.org/2012/03/grading-student-loans.html.
10 Chopra, R. (2012). Too Big to Fail: Student debt hits a trillion. Consumer Financial Protection Bureau. Retrieved 2 October 2012 from http://www.consumerfinance.gov/blog/too-big-to-fail-student-debt-hits-a-trillion/.
11 See e.g., Carnevale et al., Id.
12 U.S Department of Education (2012). First Official Three-Year Student Loan Default Rates Published. Retrieved 30 September 2012 from http://www.ed.gov/news/press-releases/first-official-three-year-student-loan-default-rates-published.
13 Whitsett, H. C. (2012). High Debt, Low Information: A Survey of Student Loan Borrowers. Retrieved from http://www.nera.com/67_7657.htm.
14 In addition, respondents needed to reside in the United States and report that they were taking the survey on a laptop or desktop computer (i.e., we excluded respondents who reported that they were taking the survey on a smartphone or other mobile device).
15 Question phrasing was customized so that where applicable, current students were asked questions in the present tense, and recent graduates were asked questions in the past tense.
16 The remaining respondents had either (1) started, but did not finish a college degree, or (2) completed their most recent postsecondary degree prior to 2007.
17 These types of loans include including subsidized and unsubsidized Stafford loans, Perkins loans, and Graduate/Professional PLUS loans.
18 According to the NCES, about 43 percent of graduate students and about 39 percent of undergraduate students had education loans in 2007-2008. See: National Center for Education Statistics (2010). Table 1.1. Percentage of Graduate and First-Professional Students Who Received Financial Aid by Type of Aid, Graduate Level, Institution Type, and Attendance Status: 2007-2008. Student Financing of Graduate and First-Professional Education: 2007-2008. Retrieved from http://nces.ed.gov/pubsearch/pubsinfo.asp?pubid=2011172; National Center for Education Statistics (2010). Table 3.1-A. Percentage of Undergraduates Receiving Aid, by Type of Aid Received and Selected Institutional and Student Characteristics: 2007-2008. Student Financing of Undergraduate Education: 2007-2008. Retrieved from http://nces.ed.gov/pubsearch/pubsinfo.asp?pubid=2010162.
19 The Project on Student Debt (2011). Student Debt and the Class of 2010. Retrieved from http://projectonstudentdebt.org/files/pub/classof2010.pdf.
20 For this reason, we do not separate out students with private loans only as an analysis group as there are too few respondents who fall into this category.
21 This is consistent with the trend that we observed in our prior survey of student loan borrowers. See: Whitsett, H., Id.
22 For each loan type, respondents were asked "How much in [loan type] [have you borrowed/did you borrow] while working on your [degree]? If you are unsure of the amount, please provide your best estimate." If respondents said "Don't know," they were asked to indicate on a categorical index of answers the range in which they thought their student loans fell. For respondents who entered an exact amount, we used this amount. For respondents who answered the categorical question, we assumed that their actual loan amount was the midpoint of the category selected (e.g., $15,000 to $19,999 would be set to $17,500).
23 The Project on Student Debt, Id.
24 Merit-based aid is defined as merit-based state grants, merit-based college grants, third party scholarships, and third party fellowships.
25 Need-based aid is defined as Pell grants, need-based college grants, and need-based state grants.
26 See NCES Tables 1.1 and 3.1-A, Id.
27 National Center for Education Statistics (2011). Stats in Brief: Merit Aid for Undergraduates: Trends from 1995-96 to 2007-08. Retrieved from http://nces.ed.gov/pubs2012/2012160.pdf.
28 Whitsett, H. C., Id.
29 See 20 U.S.C. § 1092.
30 See Whitsett, H. C., Id.
31 Pew Research Center (2010). The Millenials: Confident. Connected. Open to Change. Retrieved from http://pewsocialtrends.org/files/2010/10/millennials-confident-connected-open-to-change.pdf.
32 See, e.g.: Department of Education (2012). Frequently Asked Questions: Entrance Counseling. National Student Loan Data System (NSLDS) for Students. Retrieved 2 October 2012 from https://studentloans.gov/myDirectLoan/faqs.action; Department of Education (2012). Exit Counseling: Basics. National Student Loan Data System (NSLDS) for Students. Retrieved 2 October 2012 from http://www.nslds.ed.gov/nslds_SA/SaEcIntro2.do.
33 Of these respondents, 15 percent said "somewhat" or "very uninformative" and 26 percent said it was "neither informative nor uninformative" or "don't know."
34 Of the remaining 58 percent, 25 percent said they would change nothing, and 33 percent said they did not know.
35 We refer to respondents only by their unique identifiers in the data in order to preserve respondent confidentiality. In addition, we have presented their responses verbatim, and have not corrected any typographical errors that may appear.
36 Whitsett, H. C., Id.
37 See 20 U.S.C. §§ 1092(b), 1092(l).
38 Bettinger, E. P., Long, B. T., Oreopoulos, P., and Sanbonmatsu, L. (2009). The Role of Simplification and Information in College Decisions: Results from the H&R Block FAFSA Experiment. Retrieved 7 October 2012 from http://gseacademic.harvard.edu/~longbr/Bettinger_Long_Oreopoulos_Sanbonmatsu_-_FAFSA_experiment_9-09.pdf.
39 See, e.g.,: Dynarski, S. M. and Scott-Clayton, J.E. (2007). College grants on a postcard: A proposal for simple and predictable federal student aid. The Brookings Institution. Washington, DC.
40 US Department of Education (2012). Obama Administration and the Consumer Financial Protection Bureau Partner to Promote Transparency in College Costs. Retrieved 4 October 2012 from http://www.ed.gov/news/press-releases/obama-administration-and-consumer-financial-protection-bureau-partner-promote-tr.
41 US Department of Education (2012). More Than 1.9 Million College Students to Receive Financial Aid Shopping Sheet, Providing Easy-to-Understand Information About College Costs: Department Continues to Encourage Colleges to Adopt New Tool. Retrieved 6 October 2012 from http://www.ed.gov/news/press-releases/more-19-million-college-students-receive-financial-aid-shopping-sheet-providing-.
42 Lewin, T. (n.d.). Easing a College Financial Aid Headache - NYTimes.com. The New York Times - Breaking News, World News & Multimedia. Retrieved 6 October 2012, from http://www.nytimes.com/2009/06/24/education/24fafsa.html?_r=2&ref=global-home.
43 Borrowers would have the opportunity to reapply if their circumstances change, but they would not be required to re-submit the form each academic year.
44 We used question phrasing from a survey conducted in 2008 by the National Association of Student Financial Aid Administrators. The item asked to indicate agreement with "Eliminat[ing] non-pertinent items on the FAFSA, such as Selective Service registration, drug convictions, driver's license, etc." See: National Association of Student Financial Aid Administrators (2008). Financial Aid Administrators' Views on Simplifying the Financial Aid Process. Washington, DC.
45 This website is located at the following address: http://studentaid.ed.gov/ (Retrieved 5 October 2012).
46 Young American Ideas Book: 12 Solutions to Help Get Our Generation Back on Track. (2012). Washington, DC: Young Invincibles. Retrieved 6 October 2012 from http://younginvincibles.org/wp-content/uploads/2012/08/Young-American-Ideas-Book.pdf.
47 Groves, R. M., Fowler, F. J., Couper, M. P., Lepkowski, J. M., Singer, E., and Tourangeau, R. (2004). Survey methodology. Hoboken, NJ: Wiley-Interscience.
48 This subset of email addresses was selected at random from Young Invincibles' mailing list.
49 A few changes were made to the survey after the pre-test, but these were design-related rather than related to errors in the survey program or misunderstanding among respondents. For example, we added screens alerting respondents about which loans/grants we would be asking them to minimize the likelihood of respondents' aggregating information for these types of aid when responding to the survey questions.
50 Since Robert Applebaum's and Young Invincibles' email lists are proprietary, we are unable to disclose the exact number of individuals on these lists.
The content of this article is intended to provide a general guide to the subject matter. Specialist advice should be sought about your specific circumstances.