Foreword
Gatherings of the good and great in television can at times verge on the maudlin.
Television and crisis are mentioned in the same breath. Past glories trump today's successes. Glamorous, little-viewed imports are lauded; home-grown productions boasting double the viewers are ignored. The poster children of new media are proclaimed as the industry's reaper. Yes – we often hear that things are not as good as they were, it seems the grass is always greener on someone else's turf. But are they and is it?
Yet the UK television industry has had a robust year since the last Edinburgh. Against a background of debate positing pay versus free-to-air both business models have performed well. While some imported content continues to triumph – especially among critics – it is home-grown productions that pull in the 10 million plus audiences week after week.
Television has resisted competition from new and traditional media for its advertising revenues, its premium content subscriptions, its audiences and even its highly produced approach.
User-generated content, which had been regarded five years back as one of traditional television's biggest threats, has largely been consigned to the thinnest end of the long tail. Online television has proved more supportive than disruptive to broadcast television. Social media has so far proven to be a powerful ally in raising awareness of television's most compelling content.
Television's resilience over the last 12 months and before is a credit to its unrelenting (and often unnoticed) innovation. It is easy to overlook just how much has changed in the UK television sector in the last decade.
In 2000, plasma televisions were the playthings of the super-wealthy; flat panel televisions are now ubiquitous and often vast. A decade back, personal video recorders (PVRs) were on the cusp of launching; they are now in close to half of all UK homes.
At the start of the millennium, digital satellite was just two years young and Channel Five just three; high definition, now in millions of homes, was six years from launching; broadcaster on-demand services were wishful thinking. And as for reality television – well that was just an experiment.
Television's got talent, as we asserted last year and in this year's report we provide five essays in words and numbers on the ways in which television shows its strengths, to varying degrees.
Firstly we discuss television's role in 2010's general election, the first ever to be shaped by televised debates among the Prime Ministerial candidates. Next, we provide a current and historical view of the perception and usage of television-on-demand. This is followed by a discussion of how social media's and social networks' current synergistic relationship with television may evolve over the medium-term. Fourthly we look at the UK public's attitudes to advertising across 4 screens: cinema, television, computer and mobile phone. Finally, we take a look forward to the anticipated introduction of product placement.
We hope you find our perspectives stimulating and that you enjoy this year's Edinburgh.
In words. Television and the election: Was it television what hung it?
2010 will likely be considered a seminal year in UK politics. Not just for the change of government (only the second in 31 years) or for the coalition that resulted, but because it featured the first ever televised leaders' debate.
The UK thus followed the precedent set by radio in 1924 when it broadcast 20 minute speeches by leaders of the political parties: that election also resulted in a hung Parliament1. The UK was also following the US' example, albeit five decades later. More recent adopters of the televised pre-election debate include Mongolia and Afghanistan2.
The impact of televised debates has, in other countries and other times, been significant – enough, arguably, to settle an election in favour of an underdog. One US president remarked: "We wouldn't have had a prayer without that gadget"3.
More recent adopters of the televised pre-election debate include Mongolia and Afghanistan.
The debates were thus much anticipated, not just among political parties, but also among media analysts. The election had wider significance for the media industry as it was expected to expose fundamental shifts in influence.
In the 1992 and 1997 election, newspapers were generally considered as having had a significant influence on voting intentions4. But over the past two decades, the published press, measured by readership and sales, has been in decline. Television has largely held steady, in terms of hours viewed, viewers and revenues – but what about influence? 2010 was also to be the first ever social media election, and a chorus of pundits foresaw a Web 2.0 election, with more inclusive, more nimble social media and social networks driving the agenda5.
The election results, at first glance, suggest that the televised debates – and arguably television writ large – ultimately had little impact on the outcome of the election, despite the massive impact that the debates had on stated voting intentions during the course of the campaign.
The Liberal Democrat's share rose eight percentage points to 30 percent following the first debate on April 15; its support was still at 28 percent the day after the final debate6. Yet in the election, the Liberal Democrats won 23 percent of the vote, similar to the 2005 result, but ended up with fewer seats. Labour, which was generally regarded as having fared less well in the debates, was polling 28 percent of voting intentions on the day of the first debate, but ended up one percentage point in the election itself7. And the gap between those planning to vote Conservative on 15 April and the election outcome of 36.1 percent was less than one percent.
Looking at the outcome, television appears to have mattered little: once in the voting booth the electorate reverted to their earlier instincts, shrugging off the impressions that the televised debates had earlier made on them.
However a poll undertaken for this report showed that television's role in the election was arguably more significant than superficial8. Television was not only a major source of information for voters but it also shaped voting intentions, with its impact often strongest among the younger people
Television dominated as a source of information: three quarters of respondents used TV to learn more about the election9. National newspapers were the second most popular source, used by half the population; social networks and blogs were used by just 9 percent of those polled (see Figure 1).
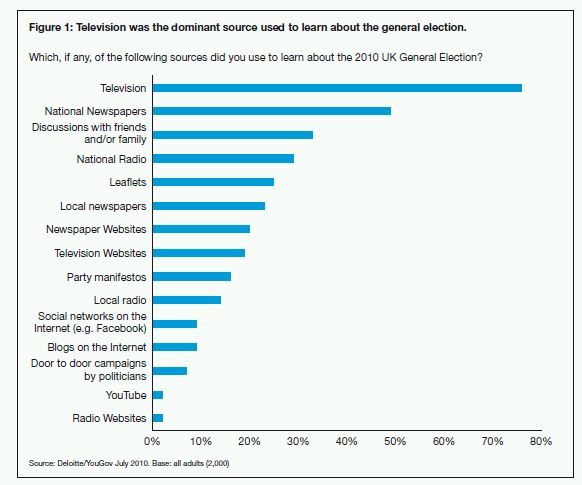
The impact of televised debates has, in other countries and other times, been significant – enough, arguably, to settle an election in favour of an underdog.Television was considered by two fifths of respondents as the news source that presented election issues most fairly10.
In joint second, on a mere 7 percent, were national newspapers, national radio and discussions with friends and family. Television was also the dominant influence on voting intention. Of those polled for the report, two fifths regarded TV as having had "the greatest influence on [their] ultimate voting intention". National newspapers were most influential among just 11 percent.
Among those who had watched television to learn more about the election and considering the TV formats covering the election, the Prime Ministerial debates were considered as most likely to have had "an influence on [their] voting decision", with the impact strongest amongst the youngest voters and women.
Focusing on respondents who had watched the debate – about 45 percent of the overall sample – over half stated that the debates had had "an impact on the way [they] chose to vote". The debates' impact was strongest on a proportional basis among younger voters (see Figure 2).

... over half stated that the debates had had "an impact on the way [they] chose to vote".
Among those who said the debate had an impact on the way they chose to vote, the most common resulting impact was to re-affirm or confirm support for a particular party11. But of those impacted by the debates, 12 percent said they had changed their vote as a result, and 7 percent decided to vote when previously they had planned to abstain12 (see Figure 3). These individuals represent a small proportion (2.8 percent and 1.6 percent respectively) of the entire sample; on a national scale, this might only make a difference in marginal seats where a small incremental swing made the difference between one party winning or losing.

However, it is unlikely that television significantly changed the election result. The longer-term trend of a gradual decline in support for Labour since its landslide victory in 1997 and the massive swing required for a Conservative majority made a hung Parliament the most likely outcome.
Television's biggest impact was to offer, in the form of the debates, a relatively unfiltered view of the leaders to the general public. Newspapers, by contrast, typically apply a degree of editorial to their coverage
As for social media's impact on television, while Web 2.0 featured, it was not Web 2.0's election in that there were no major events in the election that were precipitated by either social networks or social media. Rather Web 2.0 served mostly to amplify and complement news events created on other media13, typically television.
It was television that captured the biggest scoops during the election; these events were then discussed online via platforms including YouTube which proved to be an excellent medium for further distributing the election's most memorable moments from the campaign14. The only major story relating to content originating on social media referenced tweets posted back in 200915 rather than during the election campaign itself.
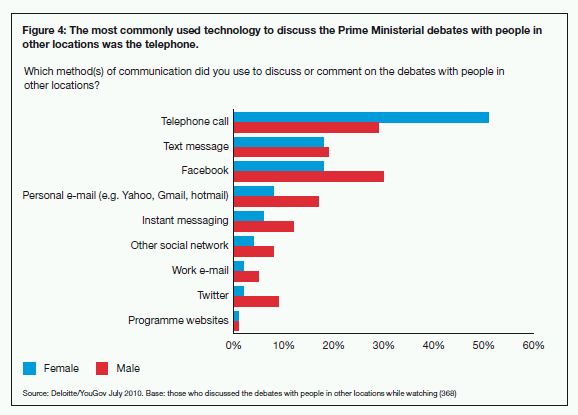
And in stark numbers, Web 2.0's impact paled relative to television's. The debates generated an aggregate of 22 million views over just three programmes. Those commenting on the election using Web 2.0 tools were easily outnumbered by those talking about the election with people in the same room; the most common technology used for talking about the election with people in other locations was the telephone (see Figure 4).
It was television that captured the biggest scoops during the election; these events were then discussed online via platforms including YouTube
That said, there were certainly some interesting breakthroughs for social networks and to a lesser extent for social media. Facebook, the UK's largest social network, with 24.2 million16 registered users, led multiple campaigns to drive and monitor engagement in the election. Many candidates set up their own websites, blogs and Facebook groups, as did many lobbying groups.
Facebook's pre-election poll involved 480,000 users; the site's Democracy UK page had garnered 168,000 "like" responses in total by the morning of the election; 14,000 voter registration forms were downloaded and there were 3,185 wall posts from users17. In the final debate, there were 154,342 tweets on the election, generated by 33,095 individuals18.
However this was Web 2.0's first election and its role in future elections is likely to be greater. Among 18-24 year olds who discussed the debates with people in other locations while watching on television, Facebook was the leading tool used to discuss the debates with people in other locations19. The social network ranked higher than telephone calls, text messages and instant messaging. A large proportion of those who did use digital platforms to discuss the debate felt it enhanced their experience: it made it feel more exciting and communal; it also meant individuals could share their views with a wider audience20.
Television appears to have had a major impact on this year's election, arguably a dominant one. Next time round, it may have to share this role with Web 2.0.
A large proportion of those who did use digital platforms to discuss the debate felt it enhanced their experience
In numbers. Television-on-demand: highly important, but sparingly used
Delivering television via a telephone line has been one of the telecommunication sector's biggest challenges for decades. It has also been regarded as one of the television sector's biggest threats and opportunities.
26 years on from the first major trial deployment of video-on-demand, the technical challenge of sending television signal on-demand via a pair of thin copper wires appears to have been solved (at least for standard definition). On the back of this progress there has been a steady flow of video-on-demand services from broadcasters and new players alike.
The UK's response to video-on-demand has been tracked through polling over the past three years. This chapter of the report highlights some of the findings from our research, which show (see Figure 5) a growing demand, since 2008, for the existence of video-on-demand services in the form of television programmes and clips being available upon request. The question we asked each year was similar but not identical.

The importance of video-on-demand is particularly high among 18-24 year olds, the majority of whom now regard on-demand services as important or very important (see Figure 6).
Again the question asked each year was similar but not identical

The importance of video-on-demand is particularly high among 18-24 year olds These data contrast with actual usage of video-on-demand, either to view programmes or clips (see Figures 7 and 8). Among respondents, the most frequent quantity of either programmes or clips actually viewed on demand in the last week was zero. The data indicates only a moderate increase from 2009 to 2010 in the number of clips or programmes viewed. Among those viewing clips, there is a marked rise in those consuming four or more clips per week. It would appear that the ability to watch on-demand matters, but this facility is only taken-up on occasion.

One of the debates over the bottlenecks to consumption of video-on-demand has centred over broadband speeds. It is generally argued that widely available, faster broadband would catalyse greater usage of video-on-demand. However our data shows that faster, more reliable Internet connections would not necessarily lead to a greater usage of television or clips on demand among the majority of respondents (see Figure 9). Indeed, faster broadband appears less of a driver of demand in 2010 than in 2009.

...faster, more reliable Internet connections would not necessarily lead to a greater usage of television or clips on demand among the majority of respondents
In words. Television and social media: friends forever?
At 8.27pm on April 23rd 2005, a pair of elephants made media history: the mammals had become the unwitting stars of the first ever clip uploaded to YouTube21. While "Me at the Zoo" was not the first ever video uploaded to the Web, YouTube rapidly became the video sharing site with the greatest momentum, positioning itself as one of the stars of the social media revolution. Within 15 months the site was handling 65,000 uploads daily22. As of mid-2010, a year's worth of viewing was being uploaded to the site every six hours23.
A year after YouTube was born, another future phenomenon launched: Facebook. In September 2006, following a brief gestation among universities and later US high schools, membership of the social network was opened to anyone aged 13 or over 24. Within four years, Facebook's global membership had passed half a billion, of which 24.2 million was in the UK25.
The frenetic pace at which social media and social networks have become entrenched within our social fabric26 raises the question of their possible long-term impacts on television. The current relationship can be characterised as predominantly complementary, but limited in reach. The future relationship may be more adversarial, with advertising the battleground.
YouTube has probably been at its most powerful when it has acted to augment the value of professionally produced-content. It has demonstrated, on occasions, a powerful ability to raise awareness of professionally produced content, be it a clip of a talent contest or amplifying the impact of television commercials27.
Social networks' role has been similarly complementary, although there have been a few instances of direct competition.28
More typically social networks and social media have served, organically and deliberately, to raise awareness of and to maintain interest in programmes.
The key ingredient television offers to social media and social networks is content to recommend, talk about and watch.
While social networks, social media and television do support each other, the synergy varies by genre and is limited overall. Programmes aimed at younger age groups tend to experience the greatest symbiosis: a few programmes and commercials become greater successes or are plucked from obscurity thanks to online peer recommendation.
If social chatter is sufficiently voluminous this catalyses a snowball effect as traditional and new media pick up on the story. This typically, when positive, raises the value of content – programmes with strong social currency are generally of greater appeal to advertisers as it means their brand becomes associated with content that is both watched and talked about.
The key ingredient television offers to social media and social networks is content to recommend, talk about and watch
But the majority of programmes with the highest ratings and adverts with the greatest recall have succeeded despite not having also been social media or social network sensations.
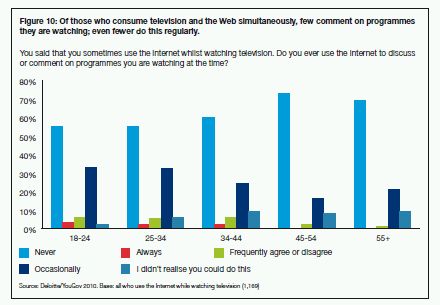
Among UK viewers it is still the exception rather than the rule to comment on a programme currently being watched on the Web (see Figure 10). Less than one in five comment at all; a mere three percent comment "always" or "frequently"29. Among 18-24 year olds the practice is more widespread, and it is now becoming standard for programmes targeted at this age group to incorporate a social media and social network element. However, while two fifths of this age group comment, of those who comment, almost all do this "occasionally"30.
Membership of online fan groups is similarly niche, even though over 40 percent of the UK has now signed up to Facebook. Only 13 percent of those polled have become fans of their favourite programmes but among 18-24 year olds penetration is an impressive 45 percent31.
The Web also appears to be a poor channel of ideas for television; almost all respondents had not used the Web to submit their storylines, and among these the majority of submissions were either rejected or plain ignored32.
Interestingly, of those going online to find out what to watch, Web 1.0, the broadcast version of the Web, based on one-way communication, remains a more popular resource than Web 2.0 equivalents, such as social networks33. Among the 46 percent of respondents using the Web to find out what to watch, three quarters used online TV guides. Just 10 percent used Facebook and only three percent used Twitter34.
While the current relationship between television and social media/social networks is largely symbiotic, in the medium term it has the potential to turn combative, with competition for audience time and advertising budget steadily intensifying.
Today the threat, measured by revenues, does not appear onerous. At £3.25 billion, the UK television sector's forecast 2010 advertising revenues are more than double the most bullish forecasts for Facebook and YouTube's combined global revenues35 and about twenty times greater than their UK revenues.
Television also appears to be more effective at monetisation. It takes 93 days to generate a pound of advertising revenue per Facebook user; this compares to 11 days for an ITV viewer36. Social network's CPMs (cost per miglie) are estimated at between 30 and 40 pence – far lower than the average for television37. YouTube's CPM has been estimated at 72 pence38.
The least disruptive outcome for television is that social media and networks remain a sideshow from an advertising revenue perspective, even if the UK public's participation continues to be mainstream. In this scenario, advertising rates for social networks would stay weak, with their valuation following a trajectory more akin to that for online banner advertising, rather than the steep upward curve enjoyed by paid-for search. Social networks manage to gather mind boggling quantities of user data, but continue to struggle to analyse this to advertisers' benefit. An effective online video ad format remains elusive and the medium continues to be hard to monetise39. In these circumstances, online video advertising sales would remain tiny in comparison to UK television advertising receipts.40
A second scenario, also benign for the television sector, is that social media and social networks become powerful advertising platforms, but end up competing most directly with other forms of advertising, such as paid-for search41.
A third more troubling possibility is that the reach, usage and value of social media and networks steadily rise, causing advertising budgets to be diverted from television42. Over time, Web 2.0's reach would increasingly emulate television's but combine this with online's precise targeting and real-time measurability. Advertising rates for social networks and media would increase as they proved their efficacy and migrated to a cost per action model – which television would struggle to emulate43.
Supporting this scenario is social media's and social networks' momentum: Facebook's current user base of 24.2 million leaves over 27 million Internet users still to sign up44. Average usage of just 12 minutes per day suggests plenty of scope for greater usage, and thus more eyeballs. Year-on-year YouTube usage growth is close to 20 percent, with two and a half billion videos now streamed monthly45.
Several years of strong revenue growth by Web 2.0 companies could soon cause a material impact on television advertising. In 2000 all companies in the emerging paid-for search market generated $1 billion worldwide, a similar amount to what YouTube and Facebook are each forecast to generate this year46. By 2006, Google was turning over in excess of $1 billion in the UK alone47.
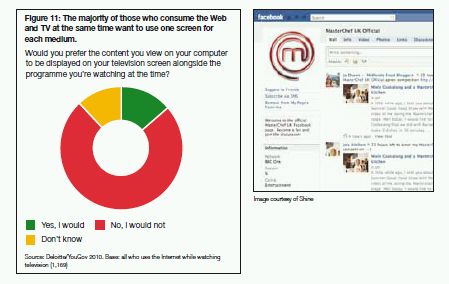
A final scenario is that the social media, social networks and television all converge. Television is already accessible via the internet including social networks; broadcast television content has become a fundamental part of YouTube's offering and a "Leanback" version of the site is in beta48; some television sets are being designed with integrated support for YouTube, Twitter and Facebook (although per Figure 11, current interest in a blended screen is low)49 ; a growing proportion of set top boxes and games consoles have integrated Ethernet connections.
All futures are possible: the only certainty is that the twin genies of social media and social networks will not be popped back into their bottle. And this means that television needs to adapt to Web 2.0's existence, exploiting its opportunities as much as it prepares against the threats.
In numbers. Advertising on television, still the nation's favourite format
A year back the outlook for television advertising looked decidedly difficult.
The year-on-year decline in revenue for 2009 was forecast at up to minus 17 percent, implying a full billion pound decline from 2005's record revenue50. To add to the gloom, media agencies were forecasting a further 5 percent decline in 201051.
Yet, seemingly defying these forecasts, the UK public's appreciation of the television advert was strong. A poll undertaken for last year's report found that television was the advertising format with most impact52.
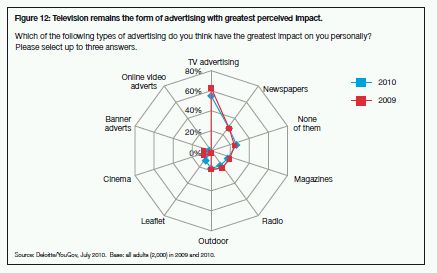
A year on and television's impact is leading, but less strong. It now regarded as a top three advertising format by 56 percent of respondents, down from 64 percent in 2009 (see Figure 12).
As in 2009, television is way ahead of newspapers and magazines. In contrast, banner adverts polled poorly in 2009 and 2010; a new option for 2010, online video adverts, also underwhelmed.
A year on and television's impact is leading, but less strong. It now regarded as a top three advertising format by 56 percent of respondents, down from 64 percent in 2009.
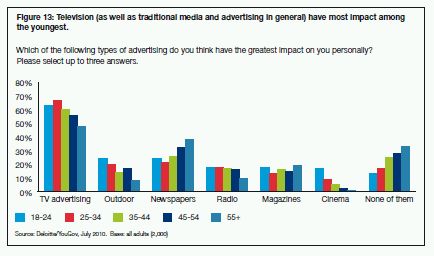
Television advertising's appeal was strongest among the youngest, as was the appeal of advertising per se (see Figure 13). Among 55+ year olds, over a third stated that no form of advertising had a great impact on them. Among 18-24 year olds, the proportion was just 13 percent
Questions over the relevance of the traditional television advert have been raised for years, yet when asked about their most favoured video format, respondents voted for the standard 30 second commercial (see Figure 14).
Online video formats were particularly poorly rated – only 3 percent of respondents were most likely to pay attention to a pre-roll advert (shown just before the programme or clip played). Less than 1 percent of respondents cited a video advert shown on a mobile phone, or an advert played in the middle of an online video as the format they were most likely to pay attention to.

A further fillip for television advertising was that it was also regarded as the platform delivering the most memorable campaign so far this year (see Figure 15).

However, despite the positive perception of television advertising in 2009 and 2010, its bed of roses is not mildew-free.
Among television advertising's greatest preoccupations is measurability. While television generates billions of commercial impacts globally every day, it is hard to measure precisely exactly how many of these are viewed. Figure 16 suggests, per self-reported data, that the majority of respondents do not watch the entirety of the adverting break. Thirteen percent claim never to watch any advertising
In words. Farewell Honey Nut Burst, welcome product placement
If you really want to have some Honey Nut Burst for breakfast there's only one place to get it: the set of Coronation Street53. This exclusivity of this fictional product is in large part due to the UK's current application of product placement guidelines.
As from next January however54, Honey Nut Burst may disappear completely from our screens to be replaced on screen with a cereal that's readily available to consumers – and which the programme's sponsors would be delighted if you'd purchase – from your local supermarket55.
Product placement's arrival on UK television is likely to provoke a spectrum of reactions. Commercial broadcasters and programme makers will welcome any potential revenue uplift. Advertisers are likely to regard this as an important new way of promoting their product. Some regulators, broadcasters and legislators may well be nervous of the public's reaction.
The integration of product placement into UK-produced content is not expected to make a major difference to television's revenues. But following a harsh 2009, an uncertain second half of 2010 and forecasts of a flat 2011, any boost, even a top-up to advertising revenue, is likely to be welcomed56.
In words. Farewell Honey Nut Burst, welcome product placement
Estimates of exactly how much product placement will generate for the UK television sector vary widely. The only consensus view is that it should be a net contributor. First year revenues from television-based product placement are expected to be in the low tens of millions57. Over time, as advertisers and programme makers better understand how product placement can work in a UK context, revenues should rise, eventually exceeding £100 million58. This is equivalent to about 3 percent of aggregate industry revenues, which are expected to be £3.25 billion in 2010. But spend on product placement may however divert billings away from other forms of television advertising such as traditional spots or direct sponsorship59. Product placement revenue from content created by independent producers is likely to be split between the broadcaster and producer.
Further, television is unlikely to be able to own the entire placement market. Other media, from radio through to music, are likely to compete. In the US, one small but fast growing product placement approach is the promotion of products and services within recorded music60. This sector grew 10 percent year-on-year in 2009, despite a decline in the overall US product placement market61
Advertisers' initial response to product placement within UK television appears positive. Several large brands have already indicated interest62. This is no surprise.
Product placement has grown steadily in the US for three decades (with the only exception of 2009) across all media. In the US product placement grossed $3.6 billion in 2009 and is expected to reach $6.1 billion in 201463.
Further, product placement is already well established in some parts of UK media: many major advertisers are already well practised in using the approach to advertise to UK consumers. Product placement has been common in films and imported television series for decades. The use of product placement to fund production of Internet based television programmes aimed at UK viewers, such as Kate Modern, first started three years back64.
Advertisers' initial response to product placement within UK television appears positive.
The value of product placement will depend to the extent to which it can both drive advertisers' sales – and given the advent of online advertising – its ability to measure impact. A poll undertaken for this report found that product placement should succeed in generating sales. Even in the current prop placement era (it is currently permissible to include a donated product if it fits with the context, such as Volvos in Wallander65) 41 percent of respondents said that they had occasionally or often purchased a product having seen it on television. Incidence of purchases was highest among 25-34 year olds, with 54 percent having bought a product having seen it on television66.
Further, of the 60 percent of respondents who consume the Web and TV simultaneously, 45 percent said that browsing e-commerce sites was one of the top 3 Internet applications in use while watching television67.
Providing a trail showing how views convert into sales is going to be challenging for television, particularly if it is expected to provide the same granularity as available with online advertising. An approach may be to incorporate links to advertisers' websites in the online version of the programme, an approach already pioneered by online soaps such as Kate Modern68. However, broadcasters' programming is watched predominantly via television sets. Another tactic might be to focus on television's ability to influence recall. One survey in the US found that where placement preceded commercials, recall rose by 20 percent69.
As for regulators and legislators, there have been two principal concerns. Firstly that product placement might be too efficacious, rendering us all voracious consumers of burgers, booze and poker. However, following lobbying, TV producers will not be allowed to make use of any branded alcohol, junk food or gambling in programmes70.
Another concern was whether viewers would accept product placement. Research undertaken for this report found that, on balance, the UK accepted product placement and would willingly trade product placement for cheaper or free television.
While two fifths of those polled found product placement annoying, 72 percent watch programmes regardless of whether or not there was any placement and only 5 percent avoid programmes with placement71.
Tolerance of placement was greatest among the youngest viewers, with 81 percent of 18-24 year olds willing to watch programmes regardless of whether or not there was placement72. Among 55+year olds a lesser majority (70 percent) was willing to watch programmes with placement.
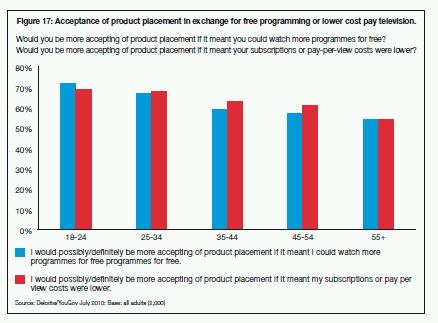
60 percent of respondents would accept more product placement in exchange for free content or lower cost premium television73 (see Figure 17). The youngest groups were most enthusiastic about this trade-off: approximately 7 out of every ten 18-24 year olds (versus a quarter of those aged over 55) would possibly or definitely accept more product placement in exchange for lower cost or no cost television.
Barring any last minute surprises product placement looks like finally becoming part of UK television's commercial and creative mix at the start of 2011. While its revenue contribution is unlikely ever to be more than additive, its potential impact on editorial values means that the notion of product placement may remain a concern for television executives and their regulators.
Barring any last minute surprises product placement looks like finally becoming part of UK television's commercial and creative mix at the start of 2011.
As for the public, our research suggests that there already is a widespread pragmatic understanding of the trade-off between advertising, in all forms, and the funding of content. Indeed, if the economic outlook were to weaken, the public may even urge greater quantities of product placement, if this meant cheaper quality television
References and notes
Footnotes
- Election: TV should be brace for impact, Broadcast, 23 April 2010, http://www.broadcastnow.co.uk/blogs/election-tv-should-bebraced- for-impact/5013074.article
- Lights, camera, election: how Britain got its TV debates, Financial Times, 9 April 2010, http://www.ft.com/cms/s/0/44862378- 41e5-11df-865a-00144feabdc0,dwp_uuid=a712eb94-dc2b-11da-890d-0000779e2340.html
- Lights, camera, election: how Britain got its TV debates, Financial Times, 9 April 2010, http://www.ft.com/cms/s/0/44862378- 41e5-11df-865a-00144feabdc0,dwp_uuid=a712eb94-dc2b-11da-890d-0000779e2340.html
- British Election Panel Study, 1992-97, CREST, http://www.crest.ox.ac.uk/beps9297.htm Was it the Sun Wot Won it Again? The Influence of Newspapers in the 1997 General Election Campaign, CREST, http://www.crest.ox.ac.uk/papers/p75.pdf ; Will the Sun win the election for the Conservatives?, Reuters, 30 September 2009, http://blogs.reuters.com/uknews/2009/09/30/will-the-sunwin- the-election-for-the-conservatives/ ; Election aftermath; the media, politics.co.uk, 17 May 2010, http://www.politics.co.uk/features/culture-media-and-sport/election-aftermath-the-media-$21377702.htm
- Web 2.0: the new election superweapon, Guardian, 11 April 2010, http://www.guardian.co.uk/politics/2010/apr/11/new-mediaelection- campaign
- Based on data from YouGov polls undertaken by the Sun on 15 April 2010 and 16 April 2010. Respondents were asked: If there were a general election tomorrow, which party would you vote for? Conservative, Labour, Liberal Democrat, Scottish Nationalist/Plaid Cymru, some other party, would not vote, don't know. For a full list of voting intention polls, including the question asked to elicit the response, see: http://ukpollingreport.co.uk/blog/voting-intention
- Based on data from YouGov polls undertaken by the Sun on 15 April 2010 and 16 April 2010. Respondents were asked: If there were a general election tomorrow, which party would you vote for? Conservative, Labour, Liberal Democrat, Scottish Nationalist/Plaid Cymru, some other party, would not vote, don't know. For a full list of voting intention polls, including the question asked to elicit the response, see: http://ukpollingreport.co.uk/blog/voting-intention
- Source: Deloitte/YouGov, 9-12 July 2010. Base: all adults (2,000 respondents)
- Source: Deloitte/YouGov, 9-12 July 2010. Base: all adults (2,000 respondents)
- Source: Deloitte/YouGov, 9-12 July 2010. Base: all adults (2,000 respondents)
- Source: Deloitte/YouGov, 9-12 July 2010. Base: all those who stated that the debate had an impact on the way they chose to vote (462 respondents)
- Source: Deloitte/YouGov, 9-12 July 2010. Base: all those who stated that the debate had an impact on the way they chose to vote (462 respondents)
- "Social media, blogs and UGC are not replacing journalism but they are creating an important extra layer of information and diverse opinion": The rise of social media and its impact on mainstream journalism, Reuters Institute, September 2009, http://reutersinstitute.politics.ox.ac.uk/fileadmin/documents/Publications/The_rise_of_social_media_and_its_impact_on_mainstrea m_journalism.pdf
- For example see: http://www.youtube.com/watch?v=1gkHwU4DRA8; http://www.youtube.com/watch?v=TbhPWAMx2y0
- For background on this story, see: Election 2010: Labour sack candidate Stuart MacLenna in Twitter row, Guardian, 09 April 2010, http://www.guardian.co.uk/politics/2010/apr/09/stuart-maclennan-sacked-twitter-general-election
- Facebook average usage based on Nielsen data for June 2010 quoted in http://www.bbc.co.uk/news/technology-10719042 .
- The Facebook Election 2010, Facebook, 2010
- 2010: The first social media election, Guardian, 3 May 2010, http://www.guardian.co.uk/media/2010/apr/30/social-mediaelection- 2010
- Facebook was used by 59 percent of 18-24 year olds who discussed or commented on the debate with people in other locations. Source: Deloitte/YouGov, 9-12 July 2010.
- Source: Deloitte/YouGov, 9-12 July 2010. Base: respondents who had used social media to comment on the debates (107 respondents).
- Me at the Zoo, The first video on YouTube, uploaded on 23 April 2005. The video was shot by Yakov Lapitsky at the San Diego Zoo. See: http://www.youtube.com/watch?v=jNQXAC9IVRw
- YouTube's First Video Uploaded Five Years Ago Today, mashable.com, 23 April 2010, http://mashable.com/2010/04/23/firstvideo- youtube/
- http://www.youtube.com/t/fact_sheet ; to see how the volume of uploads has increased over time: http://gorumors.com/crunchies/volume-of-videos-uploaded-youtube/
- Facebook.,http://en.wikipedia.org/wiki/Facebook
- Nielson data quoted in The ups and downs of social networks, BBC, 22 July 2010, http://www.bbc.co.uk/news/technology- 10713199 ; Facebook average usage based on Nielsen data for June 2010 quoted in http://www.bbc.co.uk/news/technology- 10719042
- A portent of Facebook's ascendance to the media mainstream is the company founder's planned cameo appearance in the Simpsons: Facebook founder to guest star in The Simpsons, Techradar, 23 July, http://www.techradar.com/news/internet/facebook-founder-to-guest-star-in-the-simpsons-705195 ; discussions of YouTube's impact on broadcast television include the following: Sony pays $65 Million for Web-Video-Sharing Site Grouper.com, Fox News, 23 August 2006, http://www.foxnews.com/story/0,2933,210043,00.html ; several fronts pose challenges to TV industry in 2006, Post-Gazette, 25 December 2006, http://www.post-gazette.com/pg/06359/748294-237.stm ; The End: TV, CBC, Date unavailable, http://www.cbc.ca/theend/tv.html
- For example see: Cadbury's Gorilla Advert, 31 August 2007, http://www.youtube.com/watch?v=TnzFRV1LwIo ; Compare the Meerkat Advert by Alexander Orlov, 05 January 2009., http://www.youtube.com/watch?v=M0mXUC0cUPg
- Kate Modern, for example, was created specifically for distribution via a social network. See:http://www.bebo.com/Profile.jsp?MID=367137231&MemberId=4337221200
- Source: Deloitte/YouGov, 9th – 12th July 2010. Survey data rebased to 2,000
- Source: Deloitte/YouGov, 9-12 July 2010. 42 percent of 18-24 year olds (174 respondents, weighted) who used the Internet while watching television used the Web to discuss or comment on programmes they were watching at the time.
- Source: Deloitte/YouGov, 9-12 July 2010. Base: all who had used the internet to find out what to watch (1,155 respondents).
- Source: Deloitte/YouGov, 9-12 July 2010. Base: all who had used a social network or other website to submit ideas and suggestions for future episodes of their favourite programmes (112 respondents). Of this base 42 percent of those who submitted ideas and suggestions for future episodes and programmes heard nothing in response. 34 percent could not remember.
- For a definition of Web 2.0 see: http://en.wikipedia.org/wiki/Web_2.0
- Source: Deloitte/YouGov, 9-12 July 2010. Base: all who had used the internet to find out what to watch (1,155 respondents).
- UK TV NAR bouncing back, Enders Analysis, 9 April 2010. Industry commentators are expecting Facebook's 2010 revenue to be up to $1.3 billion (£867 million) of which advertising will be about 90 percent, see Facebook-how to win friends and influence publishers and developers, Enders Analysis, 7 May 2010. Citigroup forecasts YouTube's 2010 revenues at $945 million (£630 million): Another YouTube revenue guess: $1bn in 2011, All Things Digital, 5 March 2010, http://mediamemo.allthingsd.com/20100305/another-youtube-revenue-guess-1-billion-in-2011/ . The aggregate of Facebook and YouTube's forecast 2010 revenues is about £1.5 billion.
- Facebook 2010 global revenues of £603 million: Facebook-how to win friends and influence publishers and developers, Enders Analysis, 7 May 2010. Facebook UK revenues assumes UK users generate 2.5 times the estimated 2010 global average, equivalent to £3.90 per year and CPM of 40 pence. Facebook average usage based on Nielsen data for June 2010 quoted in http://www.bbc.co.uk/news/technology-10719042 . ITV1 viewers and ITV 1,2,3,4 weekly viewing hours (4.1) based on BARB viewing data for the week ending 18th July 2010. ITV advertising revenues for 2009 from ITV Annual Report, 2009; ITV interim net advertising revenues to 30 June 2010 were £987 million, a rise of 18 percent. Crozier promises sweeping shape-up at ITV, Financial Times, 3 August 2010, http://www.ft.com/cms/s/0/a159e078-9ec7-11df-931a-00144feabdc0.html
- Social Networks Sink Online-Ad Pricing, Adage, 12 July 2010., http://adage.com/digital/article?article_id=144884; Social Networking, Financial Times, 28 July 2010, http://www.ft.com/cms/s/3/d3e24a92-9a50-11df-8346-00144feab49a.html
- 50 percent of, Another YouTube revenue guess: $1bn in 2011, All Things Digital, 5 March 2010, http://mediamemo.allthingsd.com/20100305/another-youtube-revenue-guess-1-billion-in-2011/
- Considering video based adverts on any screen, 36 percent of respondents, based on a sample of 2,024, considered that they would pay most attention to a 30 second ad shown on television. This contrasts with 3 percent for a pre-roll online video ad, 1 percent for a post-roll online video ad, and 1 percent for an in-page online video ad. Source: Deloitte/YouGov, July 2010.
- Pay TV platforms will control the future of the UK broadcasting business, Telegraph, 12 July 2010, http://www.telegraph.co.uk/technology/news/7866219/ Sir-Martin-Sorrell-Pay-TV-platforms-will-control-the-future-of-the-UKbroadcasting- business.html
- For example see: Google rumoured to be launching Facebook competitor, Wired, 28 June 2010, http://www.wired.co.uk/news/archive/2010-06/28/ facebook-finds-competition-in-google-me; Facebook turns web upside down, watch out Google, watch out privacy, State of Search, 22 April 2010, http://www.stateofsearch.com/facebook-turns-webupside- down-watch-out-google-watch-out-privacy/
- For example Ford used Facebook to use the 2011 version of the Ford Explorer, on the basis that Facebook was the most effective way to get the word out on the new model: Ford shows off new Explorer to Facebook fans with full day of content, insideFacebook, 27 July 2010, http://www.insidefacebook.com/2010/07/27/ford-shows-off-new-explorer-to-facebook-fans-withfull- day-of-content/
- Facebook needs to move to cost 'cost per engagement' pricing, cross pixel media, 19 March 2010, http://www.crosstargeting.com/facebook-needs-to-move-to-cost-per-engagement-pricing/ . By cost per action model we mean Cost Per Action or CPA (sometimes known as Pay Per Action or PPA), an online advertising pricing model, where the advertiser pays for each specified action (e.g. a purchase, a form submission, and so on) linked to the advertisement.
- In June 2010 there were an estimated 51. 4 million Internet users. Source : http://www.internetworldstats.com/eu/uk.htm
- Based on February 2009-2010 data from comScore for Google Sites, of which YouTube represents 99.6 percent of all views: http://www.comscore.com/Press_Events/Press_Releases/2010/4/U.K._Online_Video_Viewing_Up_37_Percent_During_Past_Year
- Search engines are picking up steam, BusinessWeek, 24 March 2003., http://www.businessweek.com/magazine/content/03_12/b3825085_mz063.htm
- Google's UK Revenue Up 57 Percent, Slowed over Christmas, Paidcontent, 19 February 2008, http://paidcontent.co.uk/article/419-googles-uk-revenue-up-57-percent-slowed-over-christmas/
- YouTube Leanback offers effortless viewing, YouTube blog, 7 July 2010, http://youtube-global.blogspot.com/2010/07/youtubeleanback- offers-effortless.html
- For example see: http://connectedtv.yahoo.com/services/tv-widgets/ ; Verizon adds Facebook and Twitter to Fios TV, Cnet News, 14 July 2010: http://news.cnet.com/8301-1023_3-10286697-93.html
- Ad revenue dive sparks new crisis, Broadcast, 16 July 2009, http://www.broadcastnow.co.uk/news/finance/ad-revenue-divesparks- new-crisis/5003629.article
- Advertisers fear for ITV's future, Broadcast, 5 April 2002, http://www.broadcastnow.co.uk/news/multi-platform/news/advertisersfear- for-itvs-future/1140202.article
- Television's got Talent, Deloitte LLP , August 2009
- Product placement's real value, Broadcast, 3 March 2010, http://www.broadcastnow.co.uk/comment/product-placements-realvalue/ 5010990.article
- Ofcom's timetable for product placement, Guardian, 28 June 2010, http://www.guardian.co.uk/media/2010/jun/28/ofcom-timetable-product-placement Broadcasting code review: commercial references in television programming, Ofcom, 28 June 2010, http://stakeholders.ofcom.org.uk/consultations/bcrtv2010/?intcmp=239
- Ofcom outlines product placement rules, Financial Times, 28 June 2010, http://www.ft.com/cms/s/0/5fdf8470-82e0-11df-b7ad-00144feabdc0.html
- UK TV NAR bouncing back, Enders Analysis, 9 April 2010.
- ITV product placement 'is worth millions',Telegraph, 13 September 2009, http://www.telegraph.co.uk/finance/newsbysector/mediatechnologyandtelecoms/media/6184486/ITV-product-placement-isworth-millions.html
- BMW, Coke may boost UK TV revenue on product-placement rule, Businessweek, 8 January 2010, http://www.businessweek.com/news/2010-01-07/bmw-coke-may-boost-u-k-tv-revenue-on-product-placement-rule.html
- ITV product placement 'is worth millions', The Telegraph, 13 September 2009, http://www.telegraph.co.uk/finance/newsbysector/mediatechnologyandtelecoms/media/6184486/ITV-product-placement-isworth-millions.html
- The promotion of goods and services in recorded music is about a fifth, in revenue terms, of the "other media" sector of US product placement. The "other media" sector also includes books, newspapers, magazines and radio. Product placement spending to rebound in US, Warc, 1 July 2010, http://www.warc.com/news/TopNews.asp?ID=26912
- Product placement spending to rebound in US, Warc, 1 July 2010, http://www.warc.com/news/TopNews.asp?ID=26912
- BMW, Coke may boost UK TV revenue on product-placement rule, Businessweek, 8 January 2010, http://www.businessweek.com/news/2010-01-07/bmw-coke-may-boost-u-k-tv-revenue-on-product-placement-rule.html
- The revenue estimate spans: "the amount corporations spent on integrating their goods into content across TV, movies, online and videogames": Product placement spending to rebound in US, Warc, 1 July 2010, http://www.warc.com/news/TopNews.asp?ID=26912
- Bebo's KateModern Gets New Product Placement Client – Atlantic Records, Paidcontent, 1 October 2007, http://paidcontent.co.uk/article/419-bebos-katemodern-gets-new-product-placement-client-atlantic-records/; KateModern Scores Toyota Product Placement Deal, Marketing Vox, 25 February 2008, http://www.marketingvox.com/katemodern-scores-toyotaproduct-placement-deal-036818
- Product placement's real value, Allbusiness, 3 March 2010, http://www.allbusiness.com/company-activitiesmanagement/product-management/13947515-1.html
- Source: Deloitte/YouGov, 9-12 July 2010. Base: all adults (2,000 respondents)
- Source: Deloitte/YouGov, 9-12 July 2010. Based: all whose the Internet while watching television (1,169 respondents).
- Some episodes of Kate Modern included "embedded purchasing opportunities". Bebo's KateModern Gets New Product Placement Client – Atlantic Records, Paidcontent, 1 October 2007, http://paidcontent.co.uk/article/419-bebos-katemodern-getsnew- product-placement-client-atlantic-records/ ; also see: VOD offers ideal home for product placement revenue stream, Marketingweek, 19 March 2009, http://www.marketingweek.co.uk/in-depth-analysis/vod-offers-ideal-home-for-productplacement- revenue-stream/2064726.article
- Product placement's real value, Broadcastnow, 3 March 2010, http://www.broadcastnow.co.uk/comment/in-my-view/productplacement- what-uk-can-learn-from-the-us/5011231.article
- TV product placement: Bradshaw bans "nasties", The Guardian, 4 February 2010, http://www.guardian.co.uk/media/2010/feb/03/tv-product-placement-bradshaw
- Source: Deloitte/YouGov, 9-12 July 2010. Base: all adults (2,000 respondents).
- Source: Deloitte/YouGov, 9-12 July 2010. Base: all adults (2,000 respondents).
- Source: Deloitte/YouGov, 9-12 July 2010. Base: all adults (2,000 respondents)
About the research
Deloitte* undertook two phases of primary research for this report, one qualitative, one quantitative.
Deloitte undertook 20 in-depth discussions between April and July 2010 with executives, investors and analysts working in and with the television industry.
Statistics outlined in this report are taken from a survey designed by Deloitte with polling conducted by YouGov amongst 4,199 UK adults (aged 18 years plus). The sample of 4,199 respondents was split at the beginning of the survey in order that half completed the first module of questions and half completed the second. YouGov adopted this approach so as to assure consistency of responses across the survey.
YouGov conducted the fieldwork between 9th and 12th July 2010 using an online interview, among members of the YouGov panel of individuals who have consented to take part in surveys. YouGov sampled and weighted respondents to reflect the UK population, based on the following criteria: age, gender, social grade, region and newspaper readership. Population figures used for sampling/weighting were sourced from the Office for National Statistics and National Readership Survey data.
Research themes were determined through consultation between Deloitte, executives from the television, general media, technology and telecommunications industries, YouGov and the MediaGuardian Edinburgh International Television Festival.
The content of this article is intended to provide a general guide to the subject matter. Specialist advice should be sought about your specific circumstances.
