Just about anywhere in the world is where one may claim a patent with an international PCT patent application. There are, after all, 154 countries bound by the Patent Cooperation Treaty (PCT).1 But almost no one, except well-heeled pharmaceutical companies, files in every last one. That is, when companies have to start spending real money to enter the PCT national phase at the 2½ year (30 month) deadline, they trim their choices way down.
What is remarkable is that those choices tend to be the same countries, at least for U.S.-origin PCT applications. U.S.-origin PCT applications are those with a "US" in the international application number, such as PCT/USxx/xxxxx.2 This is true even though there is a veritable laundry list of considerations that companies presumably analyze for each and every patent application.
That the same countries are selected makes sense because many of the considerations tend to tread the same paths. Where are the largest markets? Where is there manufacturing? Where are the courts helpful in enforcing patent rights? And once a company settles upon a list of target countries, it tends to file there for subsequent applications. Some companies even have small, medium, and large lists of standard countries. For a particular application, they choose a list and then add and subtract countries given their IP budget and where there are articulatable business reasons.
So where do they file? We can answer this question by asking precisely: given all U.S.-origin PCT applications that come up on their 30-month deadlines, what percentage are filed in any given country? For example, 100% would mean that every single PCT application entered the national phase in that country, and 0% would mean than none were. Seeking what people do in normal times, we purposely analyzed 2019 data because it was the last "normal year" before the COVID-19 pandemic.3 We'll start with the most popular.
The United States is where 68% of all U.S.-origin PCT national phase entries were filed in 2019.4 It is unsurprising that most U.S.-origin applications enter the U.S., yet the high number was a bit surprising to me because many applicants file direct in the U.S. and not through PCT applications. At my own firm, more often than not a U.S. application is filed separately but concurrently with a corresponding PCT application. While the U.S. application is prosecuted, the PCT application exists solely for foreign filing and never enters the national phase in the U.S. Or even if a PCT application enters the U.S., it is through a "bypass" continuation and not through what is called a "371" national phase entry. So this statistic either means that many (68%) are either delaying prosecution in the U.S. until the national phase, or they are using the national phase as an additional U.S. application to a direct filed U.S. application, perhaps to serve as a continuing application.
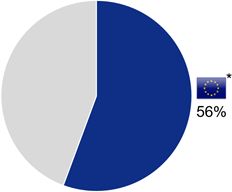
Figure 1 - EPO
The European Patent Office (EPO) is where 56% of all U.S.-origin national phase entries were filed, as shown in Figure 1.5 As such, the EPO is the most popular of foreign jurisdictions. Like the U.S., it features some of the largest markets and reliable IP protections.
Technically, an application enters the "regional phase" in the EPO and not the "national phase" because the EPO is not a nation. Yet most practitioners simply call it the latter for simplicity. The EPO serves as a central office that examines patent applications on behalf of its member countries, almost all countries in Europe.
If one plans to obtain patents in about three or more European countries, the EPO is a veritable deal. Not only is it less expensive than filing in each country individually, the final selection of particular countries, 26 to choose from, is delayed until if and when a patent grants. One can even use the EPO to register/extend/validate the patent in non-European, faraway places like Hong Kong.6 The EPO is so commonly selected by U.S. applicants that it seems odd if a U.S.-origin PCT application is not filed there.
Yet there are good reasons for particular applications to avoid the EPO. For example, the European Patent Convention expressly prohibits the patenting of surgical treatments, therapies, and diagnostics.7 This contrasts with the U.S., Australia, and many Asian countries where there are no such prohibitions. As another example, the EPO Guidelines make it difficult to obtain patents on certain software technologies, such as using artificial intelligence to classify text documents or computer simulations of the transportation of goods.8
Further, if one plans to obtain patents in two or fewer European countries, it almost always costs less to skip the EPO and enter the PCT national phase directly in the one or two countries. If one wants a patent in France, however, the national phase must go through the EPO. France does not accept direct filings from the PCT.
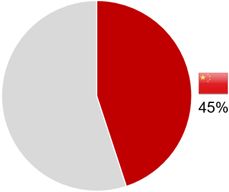
Figure 2 - China
China is where 45% of U.S.-origin national phase entries were filed, as shown in Figure 2.9 As such, it is the 2nd most popular foreign destination. China features a massive economy and manufactures just about everything.
While China has grown to be one of the largest markets in the world and has earnestly improved its courts and IP protections, one must wonder whether its government's falling out with the Trump administration and continued animosity from the Biden administration would discourage U.S. applicants from filing there.
As seen from Figure 3, the answer is "no." U.S.-origin applications have not stopped being sent to China. While there was a small drop off in 2016, this predated the Trump administration and coincided with a lessening of U.S.-origin national phase filings everywhere, not just those in China.
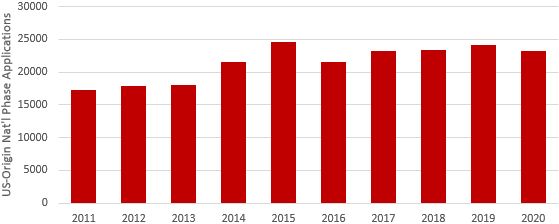
Figure 3 – China over the years

Figure 4 – Japan and Korea
Japan is where 27% of all U.S.-origin national phase entries were filed, and Korea is where 21% were filed.10 Both of these countries have large, strong, stable economies.
At this point, it is worth noting that the above jurisdictions, the U.S., EPO, China, Japan, and Korea, run the world's five largest patent offices. Collectively, they are referred to as the "IP5." The IP5 is a good starting point for determining where is most popular and where to file. But there is an interloper.
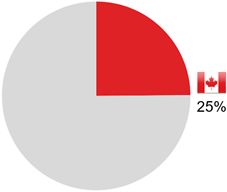
Figure 5 - Canada
Canada accepts thousands more U.S.-origin PCT national phase applications than Korea. It is where 25% of all such applications were filed.11 This is understandable given that Canada is the U.S.'s largest trading partner and whose talent and businesses are thoroughly cross-pollinated with the U.S.
But what about other English-speaking countries, such as Australia and New Zealand? And aren't applicants filing in the other BRIC countries: Brazil, Russia, and India? And what about Mexico, Israel, and South Africa? The next charts show these countries and others in relation to the IP5 and Canada.
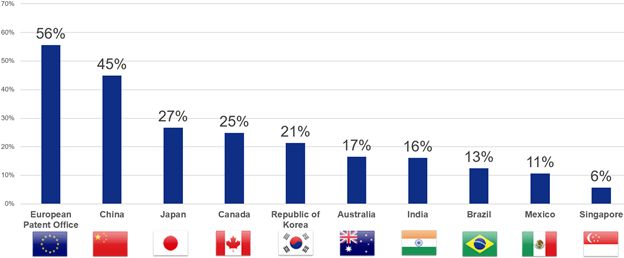
Figure 6 – top ten foreign
As shown in Figure 6, Australia follows Canada and the IP5 at 17% with India close behind at 16%. India is home to many multinational corporations' research centers and has no requirement for translations in its patent office. Then come Brazil (13%), Mexico (11%), and Singapore (6%), which round out the top ten foreign destinations. The city-state of Singapore is a major logistics hub and maintains the world's busiest maritime transhipment port.
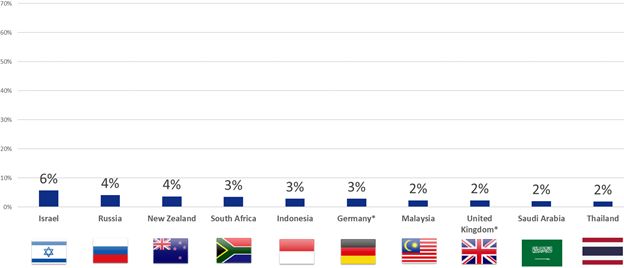
Figure 7 – next ten foreign
Figure 7 charts the eleventh through twentieth foreign destinations for U.S.-origin PCT applications. After Israel (6%), where there are many well-funded startups, Russia (4%) finally shows up, accounting for all four of the BRIC countries.
New Zealand (4%), South Africa (3%), and Indonesia (3%) appear as well, along with Malaysia (2%). Malaysia is a major manufacturing hub with a GDP in between that of Singapore and Hong Kong.12
Direct national phase filings in Germany (3%) and the U.K. (2%) that skip the EPO show up as well. That is, applicants entered the national phase directly in Germany and the U.K. rather than the EPO, presumably because they selected only these countries in Europe.
Saudi Arabia (2%) and Thailand (2%) close out the top twenty foreign countries. To give some perspective, only 1007 U.S.-origin cases entered the national phase in Thailand in 2019. Beyond this, fewer than one thousand were filed in each country.
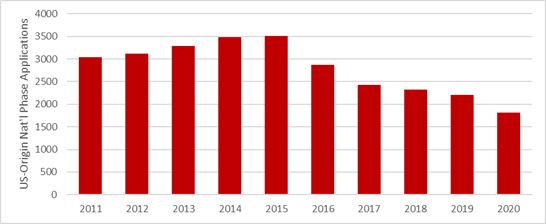
Figure 8 – Russia over the years
Back to Russia, which presents a very different story from China. In December 2014, the Obama administration and the EU imposed sanctions on Russia for its invasion of the Crimean Peninsula of Ukraine. As shown in Figure 8, U.S.-origin applications fell almost in half in Russia from 2015 to 2020. The trend is definitively downward.
The twenty-first and on foreign destinations are not charted as they have small percentages. They include Vietnam (2%), Chile (2%), and the Philippines (2%), followed by the Eurasian Patent Organization (1%).
The Eurasian Patent Organization, not to be confused with the EPO of Europe, is a regional, central office that examines patent applications like the EPO. It encompasses Russia as well as other countries such as Belarus and Azerbaijan. There was a drop off in filings in 2016, but unlike for solely Russia, they have recovered to pre-2015 levels. There were 764 in 2019.
Colombia (1%), Morocco (1%), United Arab Emirates (1%), Ukraine (1%), Peru (1%), and Norway (1%) round out the top thirty. Beyond this, less than 400 U.S.-origin PCT applications are entered per year in each country.
Further down the list, but worth noting, are other central patent offices into which a PCT application may enter the regional phase. These include the African Regional Intellectual Property Organization (ARIPO) (0.5%) and the African Intellectual Property Organization (OAPI) (0.2%). Like France in the EPO, the only way to enter the PCT national phase in OAPI countries is through the OAPI. As a side note, the Gulf Cooperation Council (GCC) is not a member of the PCT and thus does not accept PCT national phase filings.
Suffice it to say that applicants filing in the 2%-or-less countries are relatively alone in doing so. Presumably, they have identified strong reasons to travel off the beaten path. The rest, including many of the largest and most sophisticated corporations on Earth, end up homing in on the same popular countries. It is certainly not the case that the bigger or richer or more sophisticated one gets, the more places one files their patent applications.
So, where does everyone enter the national phase? The data shows that U.S.-origin PCT applications enter the national phase in the EPO just over ½ of the time, China just under ½ the time, Japan and Canada about ¼ of the time, and Korea 1/5 of the time. Then it tails down roughly from larger-GDP countries to smaller ones.
Now that others' PCT national phase filing habits are known, focus may be brought to develop a strategy based on one's own patent applications, covered products, and competitive landscape. And once the hard decisions are made, they can be re-applied as part of an ongoing IP strategy.
Footnotes
1. Taiwan and Argentina are notable exceptions.
2. The application number is not to be confused with the publication number, which is in the format WO xxxx/xxxxxx.
3. WIPO IP Statistics Data Center, https://www3.wipo.int/ipstats, 2019 national phase data. Approximately 53,563 pending PCT applications approached their 30-month deadline in 2019.
4. 36,615 US-origin PCT applications were filed in the national phase in the U.S. in 2019.
* The EU flag is shown for recognizability. My apologies to those who know that the EU is different from the EPO.
5. In the EPO, 29,807 US-origin PCT applications were filed in the regional phase.
6. Selections for "extension" (Bosnia and Herzegovina and Montenegro) and "validation" (Morocco, Moldova, Tunisia and Cambodia) countries must be made at the time of national phase filing. These are rarely selected.
7. Article 53(c) EPC
8. EPO Guidelines for Examination §§ 3.3.1 & 3.3.2
9. Ibid. 24,074 in China.
10. Ibid. 14,324 in Japan; 11,453 in Korea.
11. Ibid. 13,323 in Canada.
12. Wikipedia, List of Countries by GDP (nominal), last visited 26 Jan. 2022.
The content of this article is intended to provide a general guide to the subject matter. Specialist advice should be sought about your specific circumstances.