
- within Tax topic(s)
- with Finance and Tax Executives
- in Canada
- with readers working within the Accounting & Consultancy and Law Firm industries
- with readers working within the Accounting & Consultancy and Law Firm industries
- within Criminal Law, Law Practice Management, Litigation and Mediation & Arbitration topic(s)
01 INTRODUCING OUR CROSS BORDER MEPs SERIES
This is the first in a new series of articles that will explore the tax and other commercial challenges that the Equity Reward team at Alvarez & Marsal Tax LLP commonly observe in the design and implementation of cross border Management Equity Plans (MEPs).
We work with a wide range of PE clients on the design, implementation and ongoing operation of MEPs in their portfolio companies, often on a pan European or wider global basis. Our objective is to deliver practical advice that ensures that the MEP is compliant with local tax legislation and is robust on a future exit event, when subject to scrutiny during a due diligence process.
Please do let us know if there are any specific topics that you would like us to explore further in future editions.
02 THE RISE OF PRIVATE EQUITY AND MEPs
The Current Landscape: Private Equity and MEPs
The proliferation of private equity, with its roots in post-war America, has spread across the Atlantic and now over 5 percent of the entire European workforce is employed by businesses with private equity investment. In 2023, private equity investment accounted for 1.1 percent of the United Kingdom's total GDP, slightly down from a high of almost 1.4 percent in 2020.
Management equity plans (MEPs) have been the cornerstone of incentivisation/reward strategies employed by private equity firms since their inception. They have traditionally served as a key instrument to align the senior executive team in the portfolio company with their private equity owners to drive growth, efficiencies and ultimately, shareholder value. While historically MEPs have been limited to key senior employees, there has recently been a move broadening participation to the wider workforce with the result that MEPs will become ever more important to the economy.
Given the size of the private equity industry in Europe and the number of MEPs that have been implemented over the years, we are often asked to comment on the competitiveness of the proposed MEP terms. This is especially important where a bid is competitive. It is also noteworthy that management teams are increasingly taking advice from specialist sell side financial advisers, who will negotiate the MEP terms to make them as management friendly as possible.
Over the past 15 years, Alvarez and Marsal Tax LLP has helped numerous private equity clients structure and implement MEPs across the globe. Through this work, we have developed a deep understanding of key deal metrics, which, combined with our tax expertise, allow us to provide insights to our clients, helping them in their commercial discussions with management teams (and their corporate finance advisors) when negotiating the terms of the MEP. In the following sections, we examine a number of key aspects to MEP design.
Now over 5 percent of the entire European workforce is employed by businesses with private equity investment.
03 SWEET EQUITY PERCENTAGE POOL
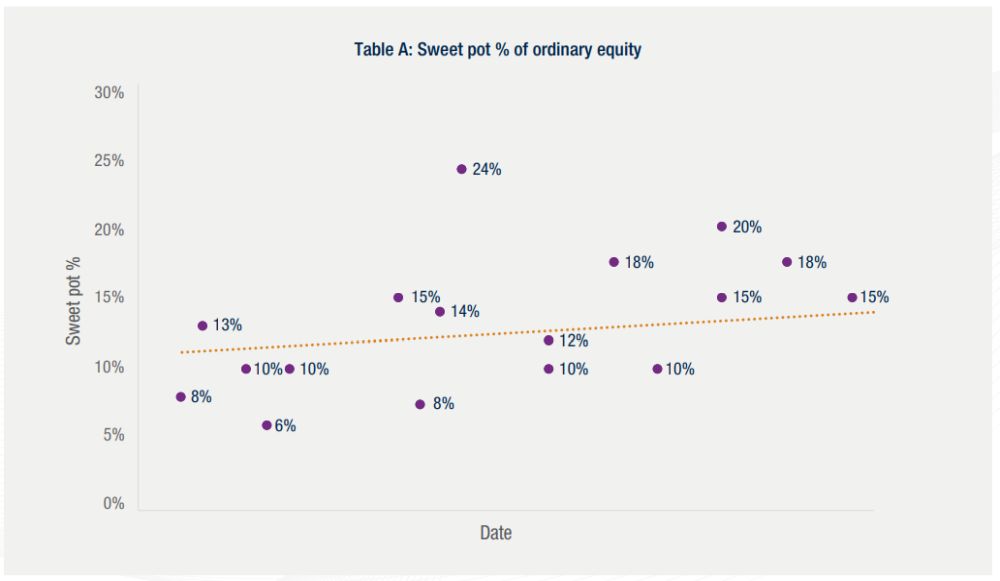
Using data from MEPs we have helped implement since 2020 (Table A), we have seen sweet equity percentage pools ranging from anywhere between 6 percent and 24 percent (excluding ratchet arrangements) of the ordinary share capital, with an average sweet pool sitting at 13%.
If we break these figures down further against the deal size (see Table B) we find that the larger the deal value (i.e., the bigger the business), the smaller the sweet equity percentage pool. This aligns with expectations as logically it follows that, the larger the pie, the smaller the slice required to deliver the relevant potential economic benefits to the management team. We would typically see private equity houses modelling out potential MEP payouts against the business plan agreed with the management team in order to set the MEP pool size.
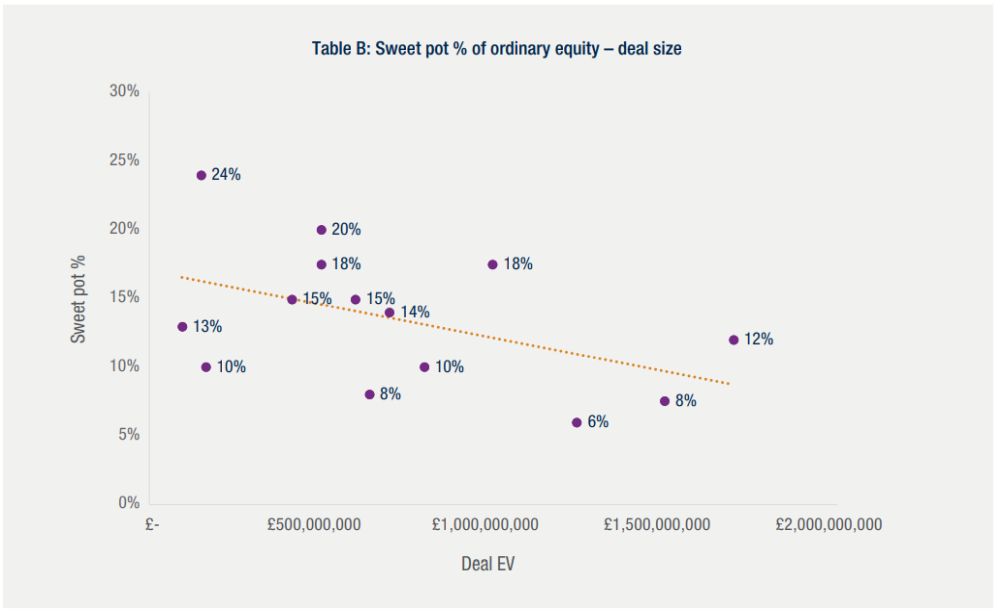
The larger the pie, the smaller the slice required to deliver the relevant potential economic benefits to the management team.
04 DEBT-TO-EQUITY RATIO
UK private equity transactions are typically structured such that a high proportion of the value is funded by fixed income instruments (loan notes or preference shares) with a much smaller proportion of equity to ensure that the investor benefits from growth above the fixed return. For pure UK MEP arrangements, the ratio of fixed income to ordinary share capital is often set at circa 99:1. This assists in making the MEPs affordable for UK managers.
However, over the years management teams have become increasingly international, so much so that when implementing MEPs a comprehensive tax analysis in several jurisdictions is required.
As a general theme, the tax authorities in most of continental Europe may seek to challenge the capital nature of MEPs. Whilst there is no bright line test, the tax authorities will consider a number of factors in assessing whether the growth in value for MEP shares should be categorized as income or capital. One factor is the extent of the shareholder leverage (i.e., the debt-to-equity ratio).
The greater the leverage the more likely it is that the management team will enjoy increasingly disproportionate returns compared to the investor. This is then taken by the tax authorities as evidence of a link to employment and therefore, the risk of reclassification of the proceeds from capital gains tax to employment tax is higher. Increasingly, this risk is being mitigated by reducing the leverage ratio. Whilst this depends on which jurisdictions are relevant, we are seeing ratios reducing to 90:10 or 95:5. The lower the leverage ratio, the lower the risk of reclassification. However, this does increase the cost of the MEP shares for the participants (also noting that for many jurisdictions it is important for participants to pay fair market value, such that they have investment at risk).
Over the years management teams have become increasingly international, so much so that when implementing many MEPs, a comprehensive tax analysis in several jurisdictions is required.
05 RATCHETS
Ratchet arrangements have become a common practice in UK centric private equity transactions, typically providing the management team with the benefit of an additional 2 percent – 5 percent of the sweet pool for outperformance assessed by reference to higher Internal Rate of Return (IRR) or Multiple on Invested Capital (MOIC) hurdles.
In the UK, whilst ratchets can be structured to achieve capital gains tax treatment, the same cannot be said in a number of European jurisdictions. Ratchet arrangements in countries such as Spain, Portugal and Germany can increase the risk of reclassification of MEP shares as employment income in the hands of the management teams, for the same reasons as discussed above with respect to debt-to-equity ratios.
As a result, we are seeing fewer MEPs with predominantly European management teams featuring share based ratchet arrangements being implemented. Instead, ratchet economics are delivered via cash bonuses which clearly are subject to employment tax. Where this is the case, costs should be carefully considered, as some jurisdictions (e.g. France) do not cap employer social security. As a result, the cost of cash based arrangements can be more expensive than the traditional UK capital based program.
06 VALUATION
One of the most emotive discussion points with management teams when implementing an MEP is that of valuation and the knock on impact on the cost of participation.
Aside from certain specific circumstances (i.e. the use of Profits Interests in the US or reliance upon the Memorandum of Understanding between the British Venture Capitalist Association and HMRC in the UK) specific tax valuation exercises are required to help support that management teams are acquiring their MEP shares for no less than fair market value (FMV), (or unrestricted market value, UMV, in a UK context). As noted above, for many countries employees paying for MEP shares (and being at investment risk) determining the FMV is an important factor in the tax analysis.
Whilst the exact approach to tax valuation can vary from country to country, a commonly acceptable approach is to align with International Financial Reporting Standard 2 (IFRS 2) and the use of a forward looking, option-pricing methodology, but with results which are subject to discounts for lack of marketability and control. The practical issue which arises is that using forward looking valuation techniques, it is likely to mean that the FMV of the MEP shares is higher (possibly considerably so) than the price paid by the investor for its ordinary equity. This is primarily because forward looking valuation methods price in the effect of shareholder leverage. Typically, where managers are required to reinvest, the reinvestment monies are applied to MEP shares first, with the remainder being applied to a co-investment on the same terms and for the same instruments as the investor. Where higher than expected funds are allocated to the MEP, the overall manager returns will be reduced and the risk profile of the investment changes. This should be considered at the earliest possible juncture.
Where higher than expected funds are allocated to the MEP, the overall manager returns will be reduced and the risk profile of the investment changes.
07 LOAN FUNDING
Given the potentially high cost for managers of participating in the MEP (see above), one of the key considerations for management teams is the availability of employer provided loan funding to assist with the acquisitions of their MEP shares and the terms of any such loans.
There are two important tax consequences of loan funding which need to be considered:
1. Risk of income reclassification
Particularly in continental Europe, the lack of investment risk is an unhelpful characteristic for discussions with tax authorities when trying to achieve capital gains tax treatment of proceeds from the sale of MEP shares. Given this, the provision of non-recourse loans (or recourse limited to the shares only) to management teams to help acquire shares is typically not recommended, and in many jurisdictions should be avoided. In countries such as France, Spain and Portugal, fully recourse loans will be required to mitigate the risk of reclassification, whilst in countries such as the US, loans should be at least 60 percent personally recourse. This contrasts with the UK position that non/limited recourse loans do not compromise the capital gains analysis of the MEP.
2. Employment tax charges
If less than market rates of interest are charged on the loans to management, this will typically lead to benefit in kind charges arising, creating a tax cost for both the individual and the employer entity providing the loan. Market rate interest is determined on a country by country basis, but is typically benchmarked to the official rates published by the tax authorities or the national bank. It should also be noted that, similar to the recourse requirements mentioned above, some jurisdictions will consider interest free loans to be indicative that the entire MEP should be taxed as employment income. As a result, we are often seeing that loans are subject to interest, so as to align as much as possible with a commercial loan.
Therefore, whilst loan funding has become commonplace, there are a number of considerations to account for when agreeing terms with the management teams to avoid any unwanted tax charges/leakage.
08 WHAT NEXT FOR MEPs?
Over recent years, the private equity industry has grown considerably.
The MEP programs are a part and parcel of this, being a critical tool in attracting and retaining the management teams to deliver considerable growth in value. Whilst the tax analysis has become more complex and less certain (as management teams are based in a more diverse range of jurisdictions), the primary reasons for MEP programs will remain the same. Currently, we are not seeing MEP pools being adjusted (i.e., increased) to compensate for potentially poorer tax outcomes. This mirrors our experience in non-PE sectors.
For example, listed companies do not typically adjust long term incentives simply because some jurisdictions have lower tax rates; allocations are based on gross payout.
The increasing use of wider based MEP programs have not yet impacted MEP pool sizes. This seems to be because of the wider allocations that have been relatively small and not overly dilutive of investor or senior team returns. It will be interesting to see whether this will remain the case if the wider allocations continue to grow.
Originally published 11 July 2025
The content of this article is intended to provide a general guide to the subject matter. Specialist advice should be sought about your specific circumstances.