
- in North America
- in North America
- with Senior Company Executives, HR and Finance and Tax Executives
- with readers working within the Technology industries
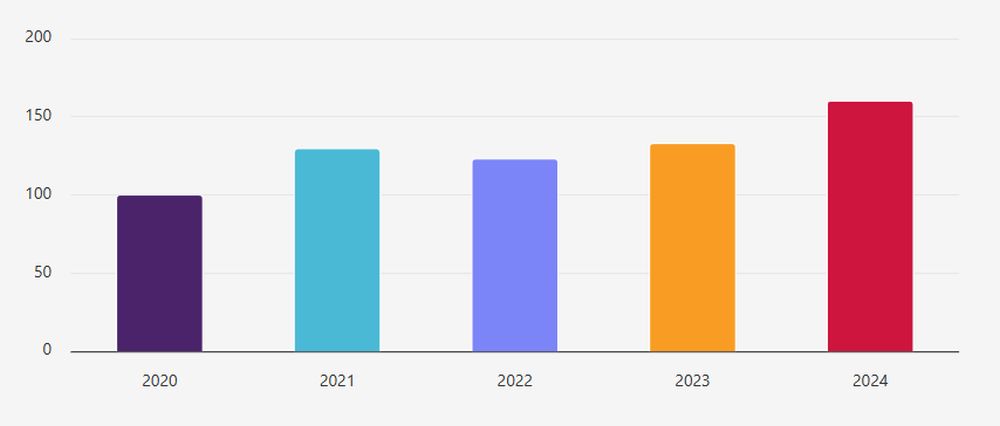
Total preferred share financings, by year
In 2024, Osler represented 160 clients on preferred share financings — more than in any other year reflected in the Deal Points Report. Notwithstanding this data point, when reviewing Canada as a whole, the CVCA reported a decline in the total number of venture financings that closed in 2024 (down 14% from 2023).
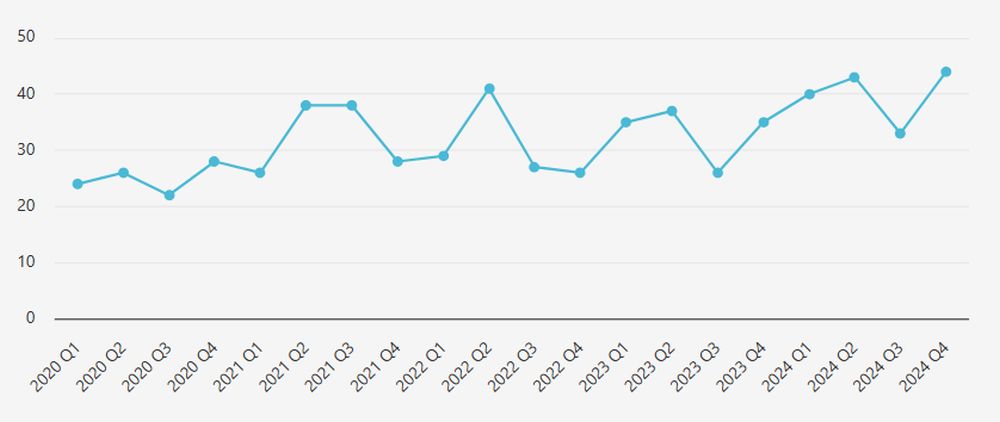
Total preferred share financings, by quarter
Other than Q3, there was a relatively even distribution of financings that closed in each quarter of 2024. By comparison, the CVCA reported that in 2024, the highest number of financings closed in Q2, followed by a decline in the second half of 2024, with the lowest number of financings closing in Q4 2024.
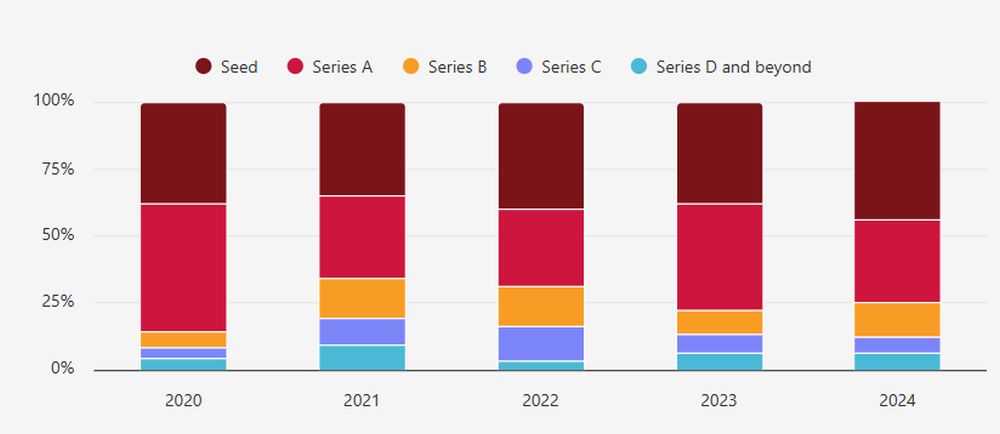
Number of financings, by year and by series
The data for 2024 shows a trend towards earlier stage financings, with an increase in Seed stage financings in 2024 (45% vs. 38% average for the previous four years), which is the highest level in the five-year period covered by the Deal Points Report. Consistent with prior years, Seed/Series A financings continued to represent a majority of the financings completed in Canada (76.3% of all financings; but only 22.7% of all dollars invested), although there was a noticeable decline in the number of Series A financings (down 5.7% from the previous four-year average; and down 9% from 2023).
Notable in 2024 was the relative increase in the number of Series B financings (13% of all financings; representing 22.6% of all dollars invested). Although the number of Series C and Series D and beyond financings only represented 12% of the financings completed in 2024, due to the presence of several mega deals ($50 million+ round size), these rounds represented 54.6% of all dollars invested. Similar to trends experienced in the U.S., where the "big got bigger" in 2024, the presence of these Canadian mega deals temporarily obscured the longer recovery period expected in the market following 2022 and 2023.
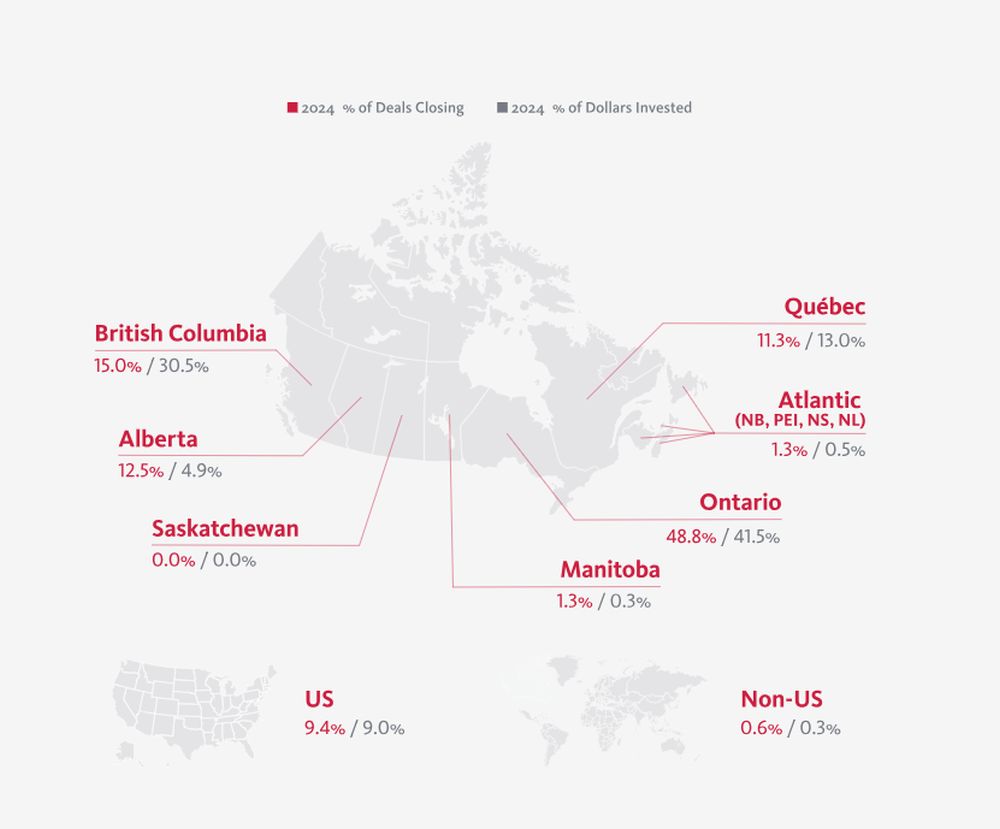
Location of companies
The diagram below displays the location of companies that completed a financing round covered by the Deal Points Report in 2024, including both the percentage of deals completed and the percentage of dollars invested in each province. The data shows the continued high concentration of venture activity in Ontario, British Columbia and Québec (together representing 75.1% of all financings closed and 85.1% of capital invested). As in previous years, Ontario represented the largest number of financings in 2024 (48.8% of financings and 41.5% of dollars invested). British Columbia had a stand-out year in 2024; while the province had 15.0% of all rounds closed (down from the prior four-year prior average of 16.5%), those rounds represented 30.5% of all dollars invested, as a result of mega deals completed by companies such as Clio and Aspect Biosystems. Finally, Alberta continued to be a rising star in the Canadian ecosystem; the province saw an increase in the total number of financings, with 12.5% of the financings closed in 2024 and covered by the Deal Points Report.
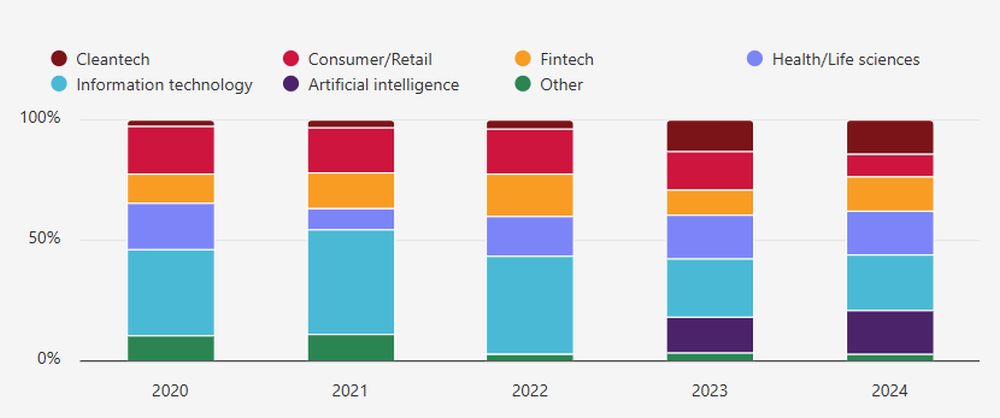
Company distribution by industry, by year
The financings included in the Deal Points Report were for companies distributed across a range of industries:
- artificial intelligence (broken out as a separate industry for 2023 and 2024)
- cleantech
- consumer/retail (including supply chain, logistics and consumer retail)
- fintech
- health/life sciences
- information technology (including blockchain, adtech, edtech and cybersecurity) for years prior to 2023, the data includes artificial intelligence companies
- other (industries which do not reasonably fit within the foregoing industry categories)
In 2024, consistent with 2023, information technology and artificial intelligence financings represented 41.2% of all financings in Canada. As in the U.S., in 2024, artificial intelligence-based companies were a key driver of financing activity for financings covered by the Deal Points Report, representing 18.1% of all financings closed in 2024 and 26.3% of all dollars invested. The largest artificial intelligence round covered by the Deal Points Report was Cohere's record breaking $500 million Series D financing. The data for 2024 also showed a relative increase in the number of cleantech financings (14.4% of 2024 financings; above the previous four-year average of 6.1%). Lastly, health/life sciences continued to be an important sector for Canada, with 18.1% of the financings closed in 2024 and 17.3% of dollars invested, including notable financings closed by Nomic Bio, Aspect Biosystems, and Flosonics Medical.
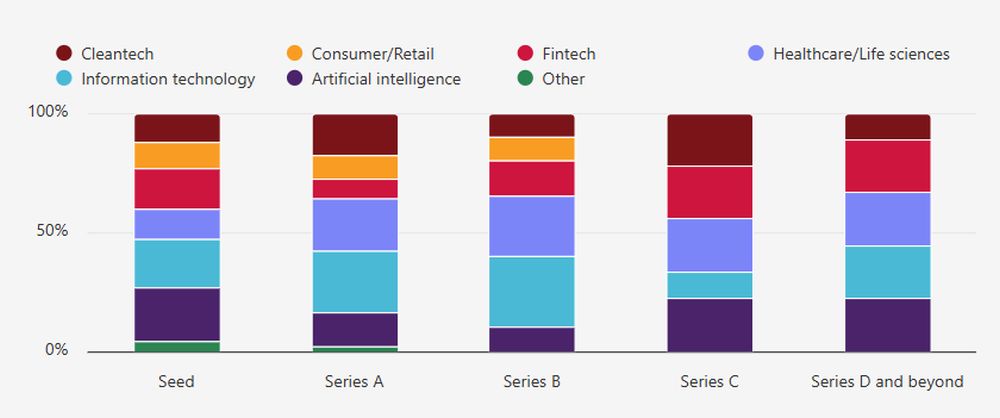
Companies by industry, by series
The chart below illustrates the overall representation of industries based on series of financing, for 2024. The data shows that artificial intelligence companies represented the largest category of companies raising financings in the Seed stage (22.2%), where 62.5% of these Seed stage artificial intelligence companies were headquartered in Ontario (note also that 65.52% of all artificial intelligence companies covered by the Deal Points Report, that raised a financing round in 2024, were headquartered in Ontario). One notable trend for 2024 is that no consumer/retail company raised a round beyond Series B. Other than for Seed financings, healthcare/life sciences companies had the most even distribution across all financing rounds.
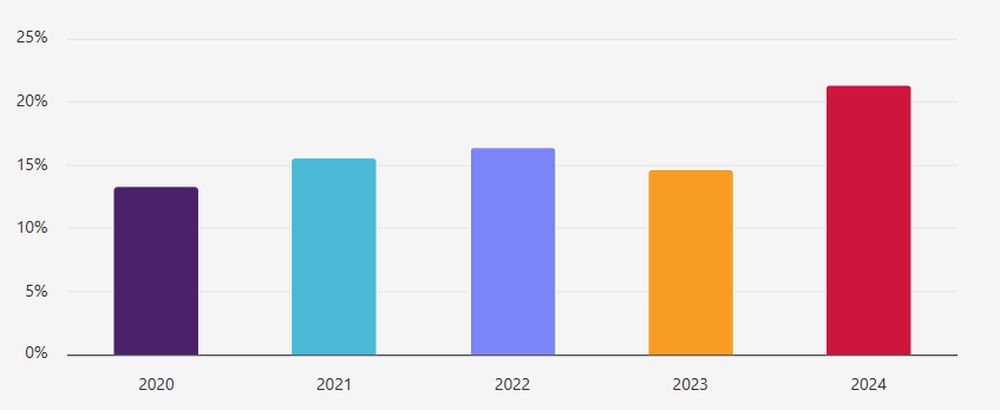
Breakdown of women founders
In 2024, we saw a material increase in the number of woman-founded companies that raised a financing round — from 14.7% in 2023 to 21.3% of all financings raised in 2024 and 12% of total dollars raised in 2024. Of these financings, 61.8% were Seed financings, 29.4% were Series A financings, 5.9% were Series B financings and 2.9% were Series C financings.
By comparison, Pitchbook reported that in the U.S., woman-founded companies raised a total of $38.8 billion (an increase of 27%, year-over-year), but deal count dropped 13.1%, concentrating capital in fewer woman-founded startups.
To help shine a light on the success, stories and journeys of women founders, through the year Osler continued to run our Women in Emerging and High Growth Companies Leadership Series, which included sessions such as Unlocking opportunities for women on boards. We also continued to host intimate and curated dinners as part of our "Seat at the Table" series, which focused on elevating women in the Canadian tech ecosystem and creating long-lasting connections.
Osler supports women at all stages of building their companies by introducing them to our exceptional network of founders, established entrepreneurs and investors. Osler is a proud exclusive legal sponsor of Cap Inclusive's Femtech Breakfast Club, Women Funding Women and OBIO's Women in Health Initiative (WiHI) Breakfast Series. The firm also has a long-standing relationship with Women's Equity Lab. Learn more about Osler's programs for women founders, including links to prior webinar series here.
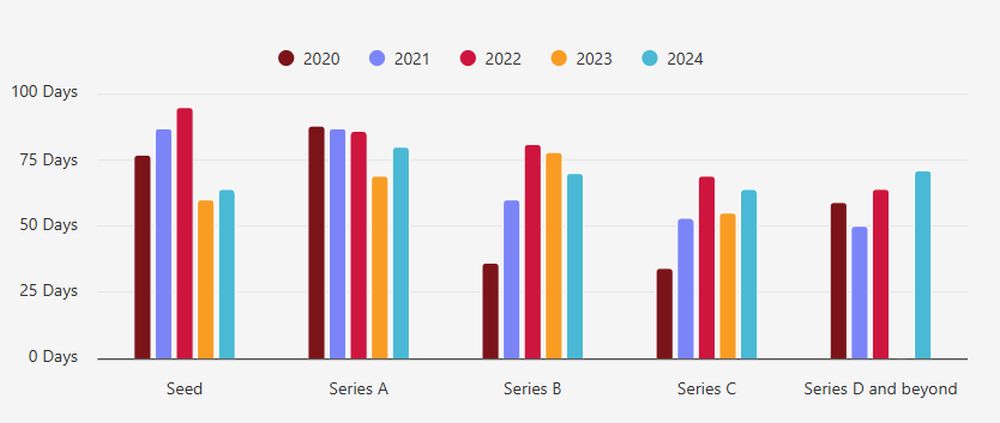
Average time between term sheet signing date and financing closing date (by series)
The chart below illustrates the average time, in days, between the date on which a term sheet was signed and the initial closing of the related financing. On average, it took longer to close a financing, across all rounds, in 2024 as compared to 2023 (with the one notable exception being Series B, which saw an 8-day decline in the average number of days required to close a financing in 2024). In reviewing industry trends, consumer/retail (56 days) and fintech (61 days) had the lowest average closing periods, while health/life sciences (79 days) and artificial intelligence (74 days) experienced the highest average closing periods. Investors' increased focus on due diligence in 2024, the lack of competitive tensions, and in the later stages, the time to syndicate the required investment for "mega rounds," all contributed to the longer closing timelines. Notwithstanding these increased closing timelines, as noted below, the average exclusivity period included in financing term sheets remained at 45 days.
Financings with exclusivity provision, duration (in days) by series
The chart below compares Deal Points Report data from 2020 to 2024 regarding the average exclusivity period included in term sheets, by financing round. The exclusivity period remained relatively consistent across all stages, with an overall average of 45 days.

The content of this article is intended to provide a general guide to the subject matter. Specialist advice should be sought about your specific circumstances.