The fourth instalment in our state-based insights series on the economics of housing in Australia addresses issues relating to current and future demands on Perth's housing stock.
Perth is unique in many ways. With its warm, sunny climate and nearly 200km of beaches, the city offers a distinctive lifestyle.1 Its economy is heavily reliant on resource exports, and the geographic distance and time difference from the rest of Australia have fostered a strong sense of independence and a 'can do' attitude among its residents. However, what truly sets Perth apart is its housing market.
Perth is facing a significant housing supply shortage, driven by population growth, economic recovery, and increased migration. Between 2020 and 2023, the city's population grew by 6.1%.2 Unlike Brisbane, which attracted many Sydneysiders and Melbournians seeking a lifestyle change after COVID-19, Perth's growth has primarily been fuelled by overseas migration.3
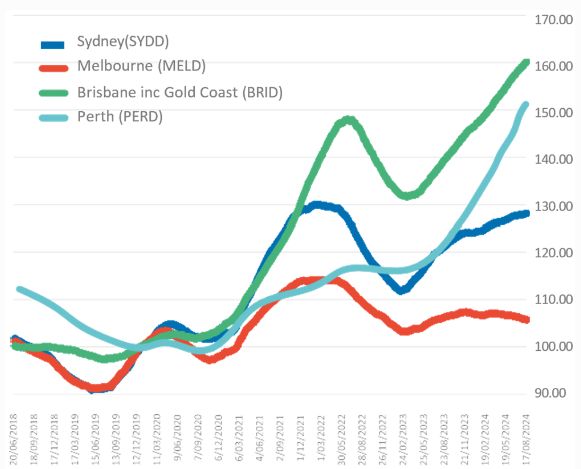
This growth occurred during a time when building approvals in the city were at their lowest in 20 years, following a challenging economic climate and falling house prices. As a result, the influx of new residents happened alongside a decline in housing delivery, which led to rental vacancies dropping to historic lows in subsequent years. Consequently, rents surged, rising nearly 80% between 2020 and 2024 - compared to around 50% in Brisbane, 30% in Melbourne and 40% in Sydney.4
During the same period, house prices have risen by more than 50%, which is double the increase seen in Sydney and nearly 10 times that in Melbourne (see below graph). This initial rise was driven by government COVID-19 stimulus, lower interest rates, and increased savings rates from travel restrictions. Although not as striking as the 60% increase recorded in Brisbane, Perth's price growth has accelerated, with a substantial 25% rise occurring in just the last year.
CoreLogic Dwelling Price Index (Jan 2020 = 100)5
For new arrivals to the city, the rising housing costs present a moderate challenge. However, for existing low-income residents, this situation could be catastrophic.
In response, the Western Australian government has implemented several policies to address the housing crisis, including a $1.1 billion investment in housing and homelessness as part of the 2024-25 Budget. This brings the total new investment since 2021-22 to $3.2 billion. A significant portion of these funds is aimed at increasing the availability of social housing and enhancing the capacity of the construction sector to expand its workforce.
Additionally, the 2024-25 Budget allocates $13.8 billion for port, road, rail and transport infrastructure, including $4.8 billion for the METRONET rail extensions.
In the context of these investments, this article examines different strategies to address the housing challenge by promoting increased supply across different parts of the city. It explores the economic costs and benefits underpinning the trade-offs between building up versus building out, providing valuable insights into the most and least favourable locations for delivering additional housing.
Location, Location, Location
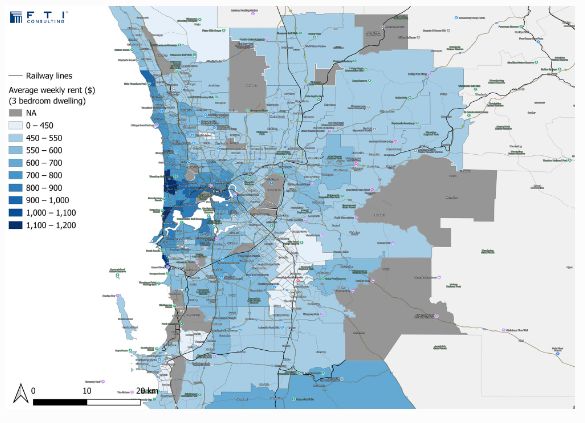
As a starting point, let's explore where people want to live. Suburbs with access to good amenities, in close proximity to jobs and quality schools, and that have access to efficient transport systems, and other desirable features, tend to be in high demand. Disparities in rental prices across suburbs reflect the value residents place on living in a more attractive location.
The following map shows estimated median rents for a three-bedroom house. Unsurprisingly, the closer to the city centre and the coast, the higher the rent. The cost of living in inner-city suburbs with easy beach access is approximately $700 more per week than in fringe locations, totalling over $35,000 annually.
But there are, of course, other factors to consider.
The Societal Costs of Additional Housing in Perth
Increasing the supply of housing causes societal costs. Some of these burdens fall on governments (i.e. taxpayers), who bear the cost of supporting public infrastructure. Local residents bear other costs, such as increased traffic, disruptions and overshadowing. Furthermore, everyone is affected by broader impacts, such as lost biodiversity and heightened carbon emissions.
The costs of housing developments differ significantly across a city. They will vary substantially based on whether the housing is built on a site that is greenfield, brownfield, fringe, infill, transit-oriented or in growth areas. Additionally, each development site will present unique challenges, such as overshadowing, flood risk and heritage protection. However, in general, these costs include:
- Public infrastructure costs on a per dwelling basis vary significantly based on location, with established areas benefitting from existing infrastructure and lower costs. These costs could exceed $150,000 per dwelling in some greenfield locations, while they are typically less than $50,000 in established areas.
- While congestion costs are higher in built-up areas due to increased traffic, better public transport options result in reduced car usage and shorter travel distances. Consequently, commuters living in established areas contribute approximately $1,500 per year in congestion costs for others, compared to more than $4,000 per year for those in fringe locations.6 The completion of major transport investments over the coming years, such as METRONET, will further highlight these disparities.
- The carbon costs associated with development can be complex. Embodied carbon in construction materials and activities may favour simpler construction of stand-alone dwellings common in growth areas, although this may be offset by the smaller dwelling sizes delivered in inner-city locations. Whereas, unit developments are more energy efficient, with fewer windows and external walls. Overall, there may not be significant differences by location.
- Loss of biodiversity is a primary concern in greenfield areas, particularly on the fringe. The cost of greenfield land loss can exceed $20,000 per dwelling.6
These costs can be converted into annual, per dwelling- equivalent societal costs based on location – as shown on the following map. It is important to note that dwellings in fringe areas are typically larger than inner-city infill developments, so they accommodate more residents. Therefore, a strategy to house a larger portion of the future population in infill locations may require the construction of more dwellings compared to a housing strategy focused on greenfield growth, assuming all other factors remain constant. This is reflected in the following analysis.
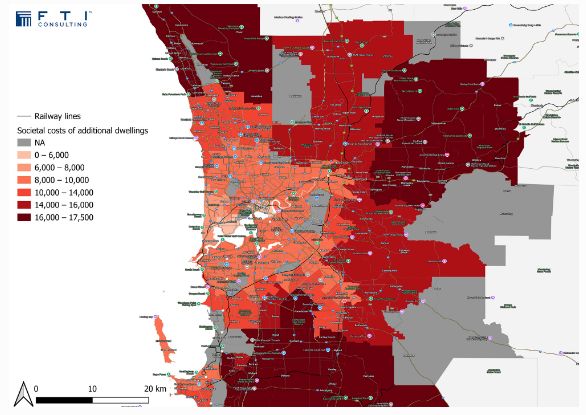
The societal costs associated with building additional dwellings are less than $5,000 per dwelling near the CBD and along major rail and tram routes, but grow progressively higher further away, reaching more than $15,000 per year per dwelling in growth areas.6 These factors must be considered when planning for Perth's future growth.
The Returns Additional Housing Delivers
Additional development can lead to societal costs, but it also brings societal benefits. Again, these vary by location.
- The most significant benefit arises from agglomeration economies, where denser economic activity leads to increased productivity. These economies are fundamental to the existence of cities, attracting firms to large talent pools, shared resources and infrastructure, and robust knowledge exchange, which further enhances productivity. Proximity between workers and employment centres fosters this cycle of productivity gains, valued at close to $20,000 per dwelling annually near the city centre but closer to $5,000 in fringe areas.
- Additionally, encouraging more active lifestyles can promote positive societal benefits. Residents of inner-urban areas typically walk and cycle more as part of their daily routine compared to those in outer areas, improving public health outcomes – valued at over $2,000 per dwelling per year.
The following map shows these benefits, highlighting interesting geographical patterns.
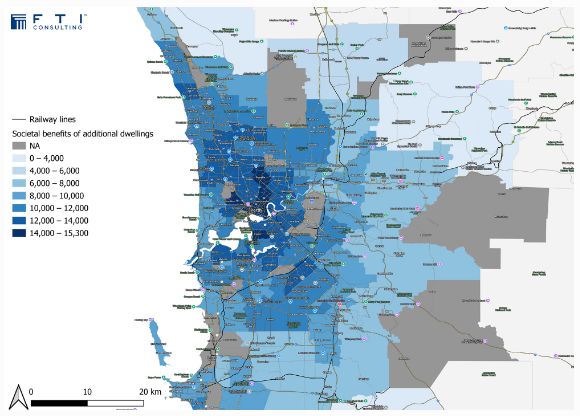
The economic returns to higher-density development are far greater in and near employment centres and, similar to the societal costs, extend along major rail corridors.
What Does It All Mean?
By integrating the societal costs and benefits shown in the previous two maps, we derive the following net benefits of additional density.
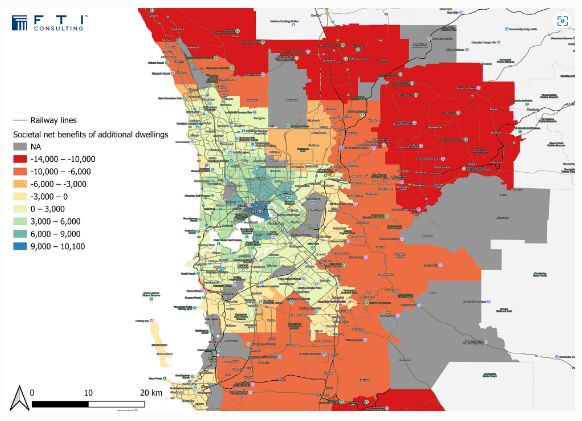
Based on the insights explored in this article, it is clear that the net societal benefits of increased residential density are positive in the city and adjoining suburbs. These benefits continue along rail lines, but become adverse in other areas and on the urban fringe. To effectively address housing shortages, we should restrict further costly urban sprawl and prioritise development in areas where existing infrastructure can be leveraged, supporting a productive economy.
What does this mean for Perth going forward? Well, we can assess the net socioeconomic cost of the city's current trajectory by examining the location of housing development from 2016 to 2021. Over that period, only 7% of new dwellings were delivered in Inner Perth and close to 40% in growth areas – at a net societal cost of around $1bn.7 If, in the future, the Inner Perth area's share of the city's new dwellings can be increased to 15%, and developments in growth areas restricted to 25%, the impact would instead be a net benefit of more than $500m.
It is important to note that this analysis is a high-level, comparative overview of different locations to explore general spatial patterns. It does not suggest we should stop building in red areas or build in all blue areas. Rather, the maps highlight where planning policy settings should allow more residential density, assuming other factors remain constant.
In summary:
- Various attributes make different parts of Perth more attractive to residents, leading to higher rents and house prices. Allowing higher densities in these locations would enable more people to enjoy these amenities.
- Other societal costs and benefits of densification also align with this approach, indicating that additional density should be permitted near employment centres and areas with existing infrastructure that can be leveraged.
How FTI Consulting Can Help
The Western Australian Government should assess how Perth and the state can effectively address the expected strong population growth in the coming decades. The Economic & Financial Consulting team at FTI Consulting understands that every location has unique challenges. We can help organisations navigate opportunities to avoid unintended outcomes by:
- Communicating the net public value a proposed development delivers to the community – encompassing both the general and site-specific impacts of development, such as enabling more productive use of land, improved amenities, better pedestrian access, adaptive heritage reuse and precinct benefits.
- Developing priorities for and assessing the value of outcomes – across precincts including health, biomedicine, education, innovation and cultural events.
- Conducting comprehensive cost-benefit analysis, evaluation and assessment – of urban renewal projects, affordable housing, social housing and infrastructure projects, incorporating all aspects of societal costs and benefits at a site-specific level.
Footnotes
1: Destination Perth Blogger, 'Best Beaches in Perth,' Destination Perth (6 September 2024).
2: "Regional Population 2022-23," Australian Bureau of Statistics (26 March 2024).
3 Rognlien, L., et al. "Addressing Brisbane's Housing Market: Build Out or Build Up?", FTI Consulting (24 September 2024).
4: "CoreLogic RP Data: Daily Back Series," CoreLogic (viewed October 2024).
5: "Weekly Asking Property Prices", SQM Research (accessed October 2024).
6: "FTI analysis of ABS Census data (October 2024).
7: Over 30 years, discounted at 7%.
The content of this article is intended to provide a general guide to the subject matter. Specialist advice should be sought about your specific circumstances.


