
- within Strategy, Employment and HR, Litigation and Mediation & Arbitration topic(s)
- with Senior Company Executives and HR
- with readers working within the Insurance, Healthcare and Utilities industries
INTRODUCTION
Collateralized debt obligations (CDOs) and other structured financial products containing subprime mortgages have been a focal point of the credit crisis, giving rise to a growing amount of investigative journalism as well as credit crisis litigation. It is widely agreed that the leading edge of the credit crisis was the meltdown of the US subprime mortgage market that began in early 2007. Many of these mortgages were structured into asset-backed securities (ABS) that were then further structured into CDOs. Through these processes, exposures were propagated throughout the financial system, ultimately resulting in widespread losses. Concerns about the depth of these losses led to uncertainty about counterparty risk, causing the credit markets to freeze in August 2007. These fears were magnified in the financial market panic of September 2008 that followed the bankruptcy of Lehman Brothers. The government response had been massive, starting with bailouts and investigations by the Securities and Exchange Commission (SEC) and DOJ of potential wrongdoing, alongside an overhaul of financial regulation.
Given their prominent role, it is clear that disputes will continue to revolve around CDOs and other subprime-backed structured products for some time. Through the end of March 2010, the credit crisis had yielded at least 395 securities filings (excluding arbitrations). Of these, at least 41 are CDO-related, which includes suits by investors in CDOs; many others are suits by investors in various of their building blocks, such as ABS and credit default swaps (CDS).2
Though many market participants were conversant with these structures, it will usually be the case that a lay audience does not have such familiarity. The goal of this paper is to go behind the current headlines to describe in plain English the fundamental analytics of the ABS-backed CDOs and synthetic CDOs that were instrumental in the financial crises. We will also discuss the principles of their valuation, including the important issue of correlation. While no short paper can cover the full breadth and detail of the subprime mortgage market, structured finance, and credit derivatives, the fundamentals presented here should help those who desire to increase their understanding of these topics.
SUBPRIME, SECURITIZATION, AND THE FINANCIAL CRISIS
"[G]iven the fundamental factors in place that should
support the demand for housing, we believe the effect of the
troubles in the subprime sector on the broader housing market will
likely be limited, and we do not expect significant spillovers from
the subprime market to the rest of the economy or to the financial
system."
-Federal Reserve Chairman Ben Bernanke, May 17, 2007
"[T]he economic outlook has been importantly affected by
recent developments in financial markets, which have come under
significant pressure in the past few months. The financial turmoil
was triggered by investor concerns about the credit quality of
mortgages, especially subprime mortgages with adjustable interest
rates."
-Federal Reserve Chairman Ben Bernanke, November 8, 2007
"The downturn in the housing market has been a key factor
underlying both the strained condition of financial markets and the
slowdown of the broader economy.... Despite the efforts of the
Federal Reserve, the Treasury, and other agencies, global financial
markets remain under extraordinary stress."
-Federal Reserve Chairman Ben Bernanke, September 23, 2008
At the heart of the financial crisis are bank writedowns on CDOs, mortgage-backed securities (MBS), and ABS with mortgage collateral (called home equity ABS for reasons outlined in the next section). As the housing market declined and both subprime and prime mortgage delinquencies and defaults rose, these securities declined in value and became highly illiquid. Illiquidity and concern about the true value of CDOs and other structured products were the driving force behind TARP. The International Monetary Fund recently estimated that writedowns by US banks will total $885 billion between 2007 and 2010. Residential mortgage loans and securities account for over 40% of the estimated writedowns.3 Here, we briefly review how losses in the subprime mortgage market affected CDO values. As seen in Figure 1, delinquencies and foreclosures on subprime mortgages rose somewhat in 2006 and much more dramatically in 2007.
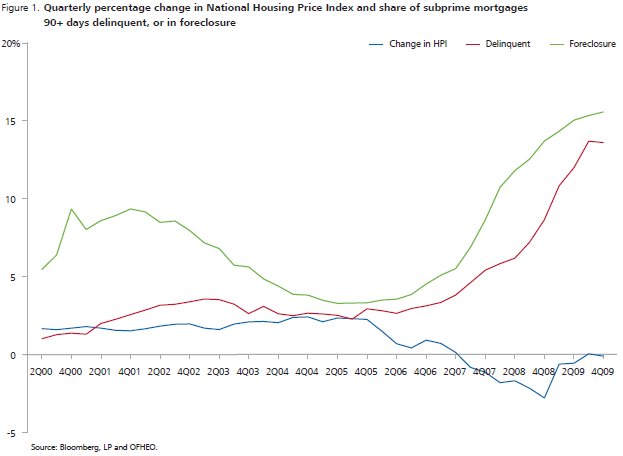
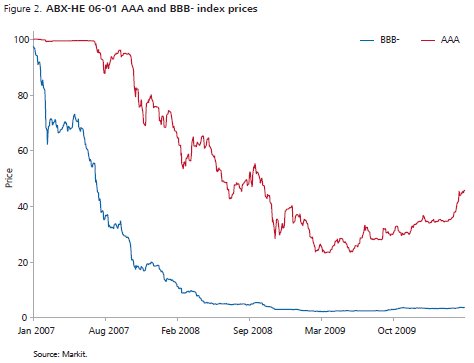
Losses, and fear of future losses, on subprime mortgage loans led to losses on home equity ABS containing those loans. The ABX indices, shown in Figure 2 (and described in detail below) track the value of a set of benchmark subprime-backed securities. The lower-rated BBB- index represents securities that are more sensitive to mortgage loan losses. While this index first began falling in response to problems in the subprime market, even the safest subprime-backed securities, tracked by the AAA index, began falling substantially in value as 2007 progressed.
In turn, losses, and fear of future losses on home equity ABS led to losses on CDOs containing those subprime ABS. By 2007 more than half of CDOs outstanding were what are called "structured finance CDOs"—the term for CDOs that contain structured finance securities including ABS, non-Agency MBS, and tranches of other CDOs.4 As we will discuss later in the paper, subprime-backed securities accounted for most of the collateral backing these CDOs.
The role of subprime in this turmoil is explained in large part by two factors. The first is that the design of subprime mortgages—many of which were originated with high loan-to-value (LTV) and debt-to-income (DTI) ratios—made them very sensitive to declines in housing prices (much more so than traditional mortgages). Defaults on large numbers of subprime loans followed slowdowns in the rate of change of housing prices. The second factor is that the risks underlying subprime mortgages were, through securitization and derivatives trading, distributed throughout the financial system. This reallocation and distribution of risks was believed to dissipate systemic risks. However, the large volume of home equity ABS and CDOs, and their purchase by a wide range of financial firms, caused the deterioration in subprime mortgages to affect balance sheets across the financial sector.5
In what follows, we will describe the vehicles through which subprime mortgage risk was securitized and traded. These vehicles are ABS, CDS, and CDOs, which we discuss in turn. In doing so, we will explain the economics of these vehicles, which will help address important topics such as how to determine their worth and what investors were actually buying and selling.
UNDERSTANDING HOME EQUITY ASSET-BACKED SECURITIES
Background: The Securitization of Mortgage Loans
Securitization is the process of pooling together assets that are not readily tradable, such as mortgages, corporate loans, or credit card loans, and issuing securities that entitle investors to payments based on cash flows that come from the pool.
Prior to the advent of securitization in the 1970s, depository institutions (commercial banks and thrifts) were the predominant originators of residential mortgages. These institutions funded mortgage originations with deposits or by issuing bonds. By the early 1990s, a different kind of financial firm—mortgage bankers—grew to be the predominant originators of residential mortgages. These institutions would fund their lending with short-term lines of credit and repay the loans either by selling the whole loans to a housing agency (e.g., Fannie Mae), or by selling the mortgages into the secondary market, i.e., securitization.6 Today, over half of the $15 trillion in residential US mortgage debt is securitized.7 Under this originate-to-distribute business model, the bank, savings and loan association, or mortgage bank originating a mortgage then sells the mortgage to a trust. The trust enlists an underwriter and issues bonds (MBS or ABS) backed by the future cash flows of these mortgages.8 The trust also enlists a rating agency to place a rating on the MBS and ABS that it issues. The bank (or other originator) typically still services the mortgage (although another firm may do so), collecting payments and forwarding them to the trust, as well as dealing with any delinquencies or defaults. The cash flows from the mortgages are passed through to the purchasers of the bonds, which may include pension funds, insurance companies, mutual funds, hedge funds, or CDOs.
Housing agencies Fannie Mae, Freddie Mac, and Ginnie Mae have historically been responsible for most of the MBS issuance.9 Agency MBS are thought to be very safe in terms of credit risk or default risk; the agencies guarantee full and timely payment, and those guarantees are perceived to be backed by the US government. (In fact, only Ginnie Mae MBS are explicitly backed by the full faith and credit of the US government.) The agencies, though, are restricted as to what mortgage loans they can purchase and securitize. These loans are called "conforming" and meet certain criteria correlated with low historical risk of default.
The many non-conforming mortgage loans are securitized by other private institutions, like banks and mortgage lending companies; these include jumbo, Alt-A, and subprime. Jumbos are securitized pools of high credit quality mortgages whose loan sizes exceed the conforming limit. The mortgages that underlie Alt-A and home equity ABS, on the other hand, usually meet the conforming loan size limit. However, Alt-A mortgages are usually missing documentation, have minor credit problems, or both, while subprime mortgages generally suffer from substantial credit deficiencies.
Subprime mortgages are made to borrowers with a high DTI ratio, an impaired or minimal credit history, or other characteristics correlated with a higher probability of default. Because these borrowers are inherently riskier, subprime mortgages are originated at a premium above the prime mortgage rate offered to individuals with better credit attributes.
The classification of subprime loans and ABS has evolved over time. Residential ABS (as opposed to consumer ABS, such as securitized pools of auto loans or credit card receivables) are distinguished by the purpose of the loan and by the credit profile of the borrower. Residential ABS were once securitized by low balance, second lien mortgages to borrowers with prime credit. The sector became know as home equity loan ABS, or simply home equity ABS. By the late 1990s, the trend in the residential ABS market was toward first lien mortgages to subprime borrowers.10 Eventually, the sector of home equity ABS grew to encompass home equity lines of credit (HELOCs), high LTV mortgages, home improvement loans, and non/re-performing pools. By 2004, most home equity ABS transactions were backed by first lien mortgages to subprime borrowers.11 Because the terminology is standard in the industry, we refer to all ABS whose collateral consists of mortgages as home equity ABS.
The Structure and Economics of MBS and Home Equity ABS
The economics of MBS and ABS are defined by two types of risk. Default risk is the risk that the underlying mortgages will default and the bond investors will not receive their due interest and principal. Interest rate risk, comprised of prepayment and extension risk, is the second key risk type. MBS and home equity ABS can be characterized by how their structure protects certain investors from, or compensates other investors for bearing default and interest rate risks. Differences in structuring will affect how the default and prepayment risk of the mortgage pool is allocated among investors, and may mitigate the total risk. Investors who are allocated more of those risks naturally earn higher yields.
Agency MBS (and other MBS composed of conventional-type mortgages) are secured by fixed rate loans, and their interest and principal payments are guaranteed. For this reason, interest rate risk is central to the economics of these MBS. Prepayment risk is the risk that the mortgages will repay more quickly than anticipated. Fixed-rate mortgage borrowers tend to refinance in low interest rate environments, and when they refinance, the original mortgage is paid off completely. When rates fall, the investor in a bond backed by fixed-rate mortgages is repaid sooner than expected; but he would have preferred not to be, as he can now only reinvest that money at the prevailing lower interest rates instead of the higher interest rate he was receiving from the bond. Extension risk is the converse. This is when borrowers of fixed-rate mortgages—primarily as a result of rising rates—repay their obligations more slowly than anticipated. This extension can cause an investor to earn a lower than market rate of return for an extended period or take mark-to-market writedowns on the position.
Home equity ABS are backed by loans to riskier borrowers. For this reason, their economics centers around default risk. Because subprime collateral has higher default risk, home equity ABS are designed with a number of mechanisms called "credit enhancements" that attempt to mitigate and reallocate the default risk. Common credit enhancements are credit tranching, over-collateralization, excess spread, and monoline insurance.12 As credit tranching is the most common form of credit enhancement, and is fundamental to understanding CDOs as well as their meltdown, we discuss it in detail below.
While prepayment risk affects home equity ABS, it is more complicated than for the case of Agency MBS and other securities composed of conventional fixed-rate mortgages. Typically, subprime mortgages have a short fixed-rate period, after which the loan resets into a floating-rate mortgage. Subprime borrowers commonly refinance at the reset date. Investors in home equity ABS face the risk that borrowers do not refinance and repay principal at the reset date. The failure to refinance extends bond investors' exposure to the default risk of the subprime borrowers. Moreover, their probability of default may rise after the reset date with the rise in their monthly payment obligations.
Understanding Tranching
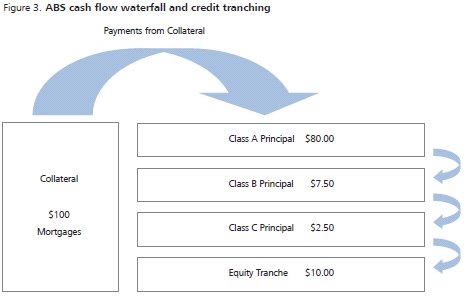
Credit tranching is a senior-subordinate credit structure, set up to provide certain investors in a particular structure with protection against defaults. Starting with a pool of mortgages, one creates two or more classes of bonds (the tranches), where the senior class has payment priority over the other, junior (subordinated) class. In a typical transaction, investors in the junior debt class may not receive any principal or interest until the senior classes have been paid in full. This priority of payments is often referred to as the "cash flow waterfall" and is illustrated in Figure 3. For a typical MBS deal, both the number of tranches and their subordination levels vary depending on the sector and the collateral.
Figure 3 shows a stylized example of an ABS deal with $100 million of collateral (which would be a pool of subprime mortgages, car loans, or other receivables) with four tranches. The senior piece has 20% subordination, meaning that it has rights to the first 80% of cash flows due from the underlying collateral. Assuming subordination is the only credit enhancement in the structure, the senior piece will not be affected unless more than 20% of scheduled principal is not received.13 The two "mezzanine" tranches have 12.5% and 10% subordination, and the "first-loss" piece (also called the equity tranche or residual) has no subordination at all. Because risks increase as we go down in the subordination ladder, bond coupons increase accordingly. As would be expected, more junior tranches receive lower credit ratings.
By cushioning senior tranches from losses, credit tranching can create AAA-rated bonds out of a pool of risky collateral, including subprime mortgages. Suppose the collateral underlying the senior and junior tranches in the example above consists of subprime mortgages. Further, suppose that the loss on that collateral due to borrowers' not making their mortgage payments turned out to be 15% of the $100 million of collateral, i.e., $15 million. Because the equity tranche and junior tranches are subordinated, they would receive no further payments. In addition, only $5 million would be left to pay to the Class B bondholders, as compared to $7.5 million in scheduled principal payments.14 In contrast, the senior tranche would have no loss, and the senior bondholders would receive their entire principal of $80 million. Losses could go as high as $20 million before the senior tranche would be exposed to any loss. Before conferring a AAA rating on the senior tranche, the rating agencies would estimate expected default losses, and they would consider even higher losses in stress scenarios. If, in the rating agency's opinion, the senior tranche had only a small probability of experiencing credit losses, it could receive a AAA rating.
Although investors purchased MBS and ABS bonds directly, many of these securities ended up as collateral themselves inside CDOs. The structure of a CDO shares much in common with that of MBS and ABS. Valuing CDOs depends on understanding the risk in a portfolio of MBS and ABS.
DEVELOPMENT AND STRUCTURE OF THE COLLATERALIZED DEBT OBLIGATION MARKET LEADING UP TO THE SUBPRIME MELTDOWN
CDO Basics
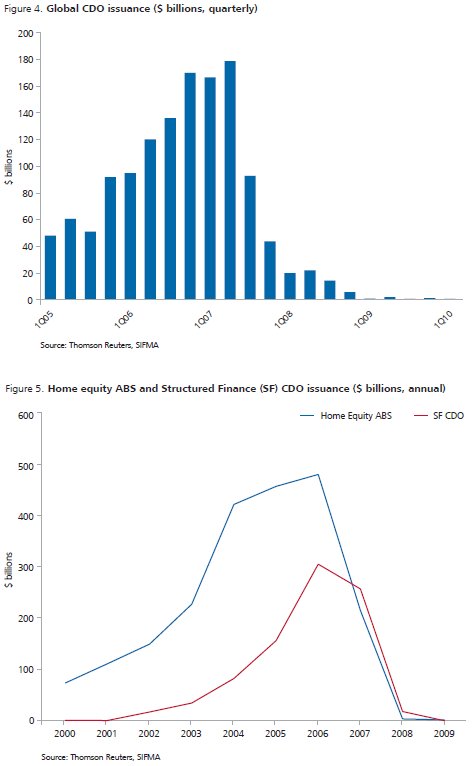
CDOs have been around for two decades, but their growth as an asset class occurred primarily after 2000.15 As can be seen in Figure 4, issuance increased rapidly through the second quarter of 2007, followed by an even more rapid decline from an annual rate greater than $600 billion to a current annual rate of less than $5 billion. This inverted V-shaped pattern resembles a similar pattern in the issuance of ABS containing subprime mortgages (home equity ABS) and structured finance CDOs, as seen in Figure 5.
It is perhaps easiest to think of a CDO as a small, privately held finance firm with a finite life span. In fact, the CDO, which is structured as an independent legal entity, owns assets such as MBS, which generate cash flows to the CDO. These MBS cash flows are in turn derived from interest and principal payments made by the borrowers whose mortgages are owned by MBS structures. The CDO finances itself by issuing a number of debt classes and a thin slice of equity. A CDO entity's debt is issued within a capital structure that includes a strict hierarchy of subordination. The cash flows from the underlying assets (i.e., the cash flows coming into the CDO structure) are distributed (i.e., sent out of the CDO structure) according to a "waterfall" that is described in the CDO's offering memorandum. Interest and principal payments from the underlying MBS assets are paid to the various classes of debt and equity based on capital structure priority (or seniority). Continuing the analogy of the CDO as a firm, the tranches can be thought of like the various seniorities of a firm's liabilities: senior and subordinated debt, preferred stock, and common stock.
CDO Structure: Cash Flow Waterfalls and Coverage Tests
The ratings and safety of the various classes reflect their seniority as claimants on the cash flows from the underlying collateral. Junior classes will not get paid before the more senior tranches are paid.
The creditworthiness of the investors' principal can receive additional protection from regularly scheduled coverage tests. These tests include a variety of over-collateralization and interest coverage ratios. When the tests are passed for a class, the tranche holders receive their scheduled interest payments as well as any principal repayments after the more senior classes (if any) have been paid down. If a test is failed, then the most senior class may be able to liquidate the entire capital structure and some junior classes may receive only partial payment or no payment at all.
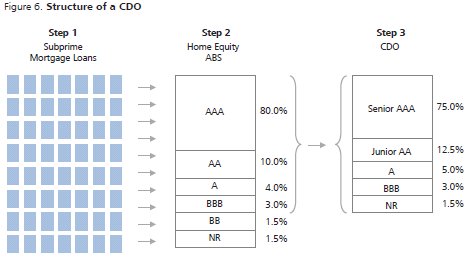
The simplified structure of the typical CDO backed by ABS is shown in Figure 6, below. There, the CDO is divided into five tranches with coupons that increase as the seniority declines: a senior tranche that typically has a AAA rating, a junior tranche rated AA, a mezzanine A-rated tranche, a subordinated B-rated tranche, and an unrated equity tranche that is often retained by the issuer. The CDO has features similar to ABS. One of the differences, however, is that a CDO can have a wide variety of assets for collateral, including not only MBS and ABS, but also commercial MBS, real estate investment trust debt, corporate loans, and debt from a variety of different industries and geographies, and even tranches from other CDOs.
We will focus on CDOs with home equity ABS collateral—the type of most importance to the financial meltdown.16 Such collateral can be diversified by type of subprime mortgage (e.g., equity loan versus primary mortgage) and geography (e.g., Southwest versus Northeast).17 Alternatively, as is now well known, a number of CDOs were issued that were made up of only the A-rated and BBB-rated tranches of home equity ABS—so-called mezzanine CDOs. Even though the CDO was backed by higher yielding, lower credit assets, the tranching mechanism described above made it possible for the senior piece to achieve a AAA rating, though in a smaller ratio than non-mezzanine, ABS-backed CDOs. When the demand for pools of BBB-rated tranches of home equity ABS proved to be less than the demand for ABS CDOs, synthetic CDOs (described below) were created that referenced the BBB-rated ABS tranches but did not actually own them.
Economics of Subprime Mortgages and Impact on CDOs
From 2000 to early 2007, when CDO issuance was rising rapidly, the subprime mortgage market issued a number of types of mortgages that, according to Gorton (2008), were designed to encourage early repayment and refinancing by the homeowner.18 One of the most common subprime mortgage products was given the label 2-28 because it offered a low fixed rate (called a "teaser rate") for two years and then converted (reset) to a high variable-rate mortgage for the remaining 28 years. (Mortgage products that convert from fixed rate to floating rate are often called "hybrids.") Homeowners who could afford the teaser rate, however, might have found themselves unable to afford the subsequent rate two years later. The jump from the teaser rate to the floating rate is greater with 2-28 mortgages as compared to other hybrid products, This reset shock meant that borrowers' monthly payments could jump by 15% to 35% or more when the teaser rate expired, even if market interest rates were unchanged over the period from loan origination to reset.19 The interest rate jump after two years created a strong incentive, if not the need, for the homeowner to refinance into another 2-28 or similar mortgage product after two years.20
The certainty of the rate jump made subprime mortgage delinquency and default rates particularly sensitive to housing prices—much more so than conforming mortgages. If housing prices were to fall, subprime borrowers would find themselves unable to refinance when their teaser rates expired. Because a significant number of subprime mortgages had LTV ratios of up to 100% (versus 80% or less for conforming mortgages), a decline in housing prices could render subprime borrowers "under water" and unable to refinance. The incentive to refinance after only two years gave subprime borrowers little flexibility to withstand even a short-lived drop in housing prices.
The expectation of refinancing after two years led to the belief that prepayment rates on the underlying CDO collateral would be relatively high, thereby causing relatively rapid principal pay-downs on the senior tranches. Indeed, the average life of the higher tranches of CDOs was expected to be less than five years. The principal pay-down feature, if it was triggered, would then lead to a virtuous cycle of increasing creditworthiness for the lower tranches.
This process is illustrated in Figure 7, which is based on the CDO structure from Figure 6, showing two periods in the life of a CDO—period 1 at issuance and period 2 some time later when 25% of the principal has been paid down based on mortgage refinancings and amortizing principal payments.
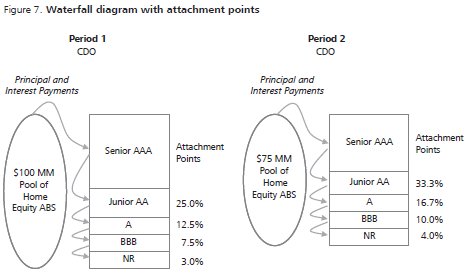
The columns of percentages alongside the tranche breakpoints in Figure 7 show what are called attachment points. This concept shows what percentage of losses can be sustained before a tranche becomes impaired; that is, when there is no longer enough collateral to repay the entire principal due to that tranche. As a CDO amortizes, in the absence of defaults, attachment points for each non-equity tranche will increase. In other words, each tranche's effective subordination for remaining payments will increase as the bond amortizes. The equity tranche generally attaches at zero because any initial defaults reduce cash flows to equity.21 In the Figure 7 structure, the BBB tranche attaches at 3.0% at issuance (Period 1), the A tranche attaches at 7.5% and the AA tranche attaches at 12.5%. But with principal pay-downs to the senior class, and no defaults, the attachment points will all increase. In Figure 7, the assumed amount of the pay-downs is such that the attachment points all increase by a third. This, in turn, increases the value of the junior tranches because it means that a higher default rate on the underlying mortgages will be required before the principal of each tranche becomes impaired.
It should be recognized, however, that attachment points could—and eventually did—decrease for each tranche. If homeowners were to default rather than refinance, the attachment points would be at lower percentages, lowering the effective subordination for remaining payments; as a result, the creditworthiness of all the tranches in the structure would decline.
For this reason, some commentators have pointed out the importance of increasing housing values in supporting the CDO market through the years of rapid growth.22 Although future research may well show that there were other causal factors at work in the collapse of the CDO market following the housing market downturn, the importance of substantial, widespread (hence unanticipated) declines in housing prices as a precipitator will likely remain a key finding.
Diversification of CDO Collateral
CDOs are designed to facilitate diversification because, in part, a diversified portfolio of debt assets will have less risk than its constituent assets and will further reduce risk for the higher tranches in the CDO structure.23 Given that a typical CDO contains 100 or more component securities, there is opportunity for substantial diversification and risk reduction. The extent to which CDO collateral was diversified, however, varied from one CDO to another. Moreover, the amount of diversification, and, therefore, the extent of risk reduction achieved, depends not on the number of different component securities, but on the correlation of default among those securities (which of course, can only be estimated). Specifically, if there is a high correlation of default risk among the collateral assets then risk will not be reduced as much as it would be if the correlation were low. The concept of correlation and its role in valuation of CDOs will be explored in more depth in later sections.
By 2006, the typical high-grade ABS CDO held 50% of its collateral in home equity ABS and the typical mezzanine CDO held 77% of its collateral in home equity ABS and 89% in residential MBS, as seen in Figure 8.
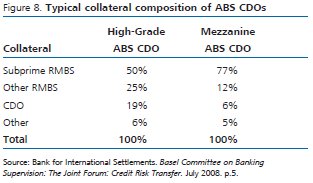
Many CDOs contain tranches of other CDOs as part of their portfolios. Depending on what portion of the portfolio consists of other CDOs, these deals are sometimes referred to as CDO2 ("CDO-squared"). As of 2007, it was estimated that, on average, 6% of the collateral of Mezzanine SF-CDOs (i.e., CDOs comprising of structured finance products, like investment-grade MBS and other ABS) consisted of tranches of other CDOs.24 High-grade SF-CDOs held 19% of collateral in other CDOs in the same year.25 Including tranches of other CDOs was considered a way to further diversify exposure to the risk from underlying mortgages (or other collateral). Because the underlying CDOs were themselves complex structures, a CDO2 turns out to be even more challenging to value.
CDO Market Supply and Demand
The market for CDOs developed because it offered advantages to both the issuers and the investors. On the issuer side, CDOs provided a way for financial intermediaries to remove assets from their books and thereby reduce their regulatory capital requirements, while continuing to earn fees for originating and servicing the mortgages. Also, some types of CDOs—such as synthetic CDOs—were used for hedging default risks that were on the balance sheets of investment banks for client relations or other purposes.
On the demand side, CDOs offered attractive yields over other like-rated notes. By investing in CDOs, an investor could achieve an overall greater level of asset class diversification while maintaining targeted credit risk levels. The most senior tranches of CDOs were structured to achieve AAA ratings even when the underlying collateral assets were BBB or lower—a result of how the rating agencies viewed collateral protection afforded by diversification and seniority in the capital structure. Some institutional investors could not invest directly in the underlying BBB-rated collateral because of restrictions in their investment guidelines, but they could invest in the highly rated, senior class of notes from a CDO. Alternatively, investors willing to take on more risk could invest in lower tranches issued by the CDO. These subordinate tranches came with lower credit ratings and higher coupon rates.
SYNTHETIC CDOS
The Virtual CDO
Whereas a cash-based CDO derives its cash-flows from underlying securities such as ABS, MBS, or other bonds and loans, a synthetic CDO derives cash-flows from CDS (a form of credit insurance) on a basket of reference entities, which could be high-grade corporate bonds, but could also be MBS or ABS. By 2002, US and European synthetic CDOs overtook cash-based CDOs in terms of transaction volume.26 (Refer to the appendix for a primer on CDS.) During 2006 and 2007, the synthetic CDOs of most relevance to the credit crisis were those effectively insuring various tranches of home equity ABS.
In a synthetic CDO, the issuing special purpose vehicle (SPV) enters into a number of CDS contracts where it sells protection on a reference portfolio. The premiums paid by the counterparties (buyers of protection) in these CDS provide a stream of cash flows to investors in the synthetic CDO. If credit events occur, the contingent payments reduce the cash flow to synthetic CDO investors. If large enough, credit events may result in calls on investors in the "unfunded class" of the synthetic CDO to put up cash to fund the contingent payments. Synthetic CDO payment mechanics, as well as funded and unfunded classes will be described in greater detail below.
One can think of a synthetic CDO as a virtual CDO because, in many senses, it mimics the behavior of an ordinary cash-based CDO that contains the reference portfolio as its collateral. However, in addition to the different source of cash flows, there are two basic features that distinguish synthetic structures from cash-based ones. The first lies in the degree to which the CDO is managed. While there is a range of management styles that one might see in the case of a cash-based CDO, synthetics are typically static. The other main difference lies in the funding of the liabilities. Cash-based CDOs are fully funded, meaning that investors pay in advance for their bonds. The money is used, in turn, to purchase the securities that back the structure. Synthetic CDOs, on the other hand, are only partially funded. In addition to the funded classes, they include an unfunded class (typically the super senior tranches) for which investors need not put any money down initially.
Funded and Unfunded Classes
Synthetic CDOs can have funded and unfunded classes. Noteholders of the funded classes purchase interests in the synthetic CDO by making a payment up front. In return, they are entitled to cash flows subject to availability. Assuming no (or limited) credit events, they will continue to receive payments of principal and interest (as derived from premiums from the buyers of protection).
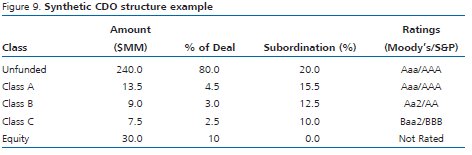
Like cash CDOs, synthetic CDOs have senior-subordinate structuring, as illustrated in Figure 9. Because the funded classes are subordinate to the unfunded ones, they enjoy a higher coupon, but take on a greater risk of losing some or all of their investment. Because of the initial capital payment made by the investor in a funded class, their experience is akin to
that of bondholders. By contrast, the investing experience of someone who has an interest in the unfunded class is much more like a seller of protection in a CDS. The unfunded classes form what is called the super-senior tranche of a synthetic CDO. Investors in the super-senior tranche put no money down and receive periodic payments with lower coupons than the funded noteholders. The risk they face lies in their obligation to compensate buyers of protection if sources from the funded class subsequently prove insufficient should severe credit events occur.
Payment Mechanics
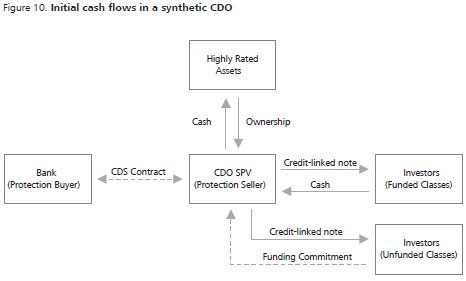
The easiest way to understand the payment mechanics of a synthetic CDO is to start by considering the funded classes. The funded notes are purchased with cash, and in return, the investors receive security from one of the CDO tranches. This instrument is called a credit-linked note (CLN). The CLN, issued by the synthetic CDO trust, is effectively a high-grade bond with an embedded CDS. This means that unless there is a credit event in the reference entities, the investor is entitled to full coupons and the full repayment of his principal. The up-front payments made by investors in the funded classes are then invested in low-risk, highly rated securities, like Treasuries. These securities, now owned by the trust, are set aside as a source of good faith money, akin to margin, for the protection buyers (again, external to the CDO), should there be a credit event.27 Buyers of the unfunded class receive a security in exchange for a conditional funding commitment. See Figure 10.
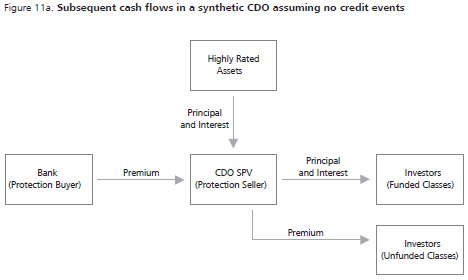
During the life of the transaction, the cash flow from the insurance premiums is used to meet both the funded and unfunded noteholders principal and interest payments. The funded noteholders also receive interest from the highly rated securities purchased by their principal payment. These synthetic CDO cash flows are illustrated in Figure 11a.
What if There is a Credit Event?
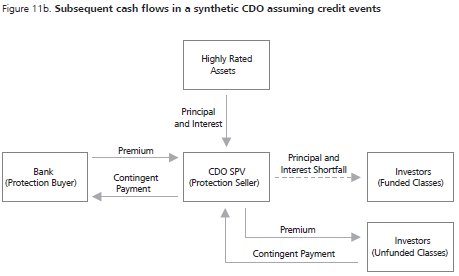
If there is a credit event in the reference portfolio, the CDS contracts require the synthetic CDO to make credit event-contingent payments to buyers of protection. Contingent payments are first funded by interest income from the highly-rated assets, purchased with the initial payments of funded class investors. Consequently, the holders of funded notes receive reduced payments when contingent payments occur. If the credit events are particularly severe, the synthetic CDO might be required to liquidate some or all of the highly rated assets. Note that as long as up-front capital of the funded class is available to meet contingency payments, the unfunded class is immune from losses—consistent with the senior-subordinate structure as described above. Only if the highly rated assets are fully depleted do the unfunded noteholders get called upon to make contingency payments. These post-credit event cash flows are illustrated in Figure 11b.
THE ABX INDEX AS A SUBPRIME PRICE BENCHMARK
A challenge faced when trying to value subprime-backed CDOs is that mortgage-based structured products are traded over the counter (OTC).28 Information about the prices of various mortgage-backed asset classes usually requires calling dealers to obtain quotes or recent transaction values. In an efficient market, transaction prices reflect publicly available information as processed by the multitude of market participants. Prior to 2006, however, no such exchange with publicly available data existed for a security whose value was dependent on the performance of subprime residential mortgages.
The January 2006 introduction of the ABX.HE indices provided daily, publicly available data. These indices are among a larger family of credit and structured finance indices that are administered by Markit, an organization of dealers in home equity ABS.29 Each ABX.HE index tracks the value of CDS (which also trade OTC) on specified tranches of home equity ABS.30 A separate index was initially constructed for each of the following five investment grade ratings: AAA, AA, A, BBB, and BBB-.
The January 2006 indices were followed by three additional versions, or vintages, introduced in July 2006, January 2007, and June 2007. Each index is based on home equity ABS originated in the prior six months. So the January 2006 index, ABX.HE 2006-1 for short, references ABS issued during the last half of 2005. New vintages were then released semi-annually to gather a representative sample of home equity ABS originated since the last index. No new indices were introduced following the decline in the value of the indices after the first half of 2007. Consequently, a total of 20 ABX.HE indices—four vintages and five investment grades within each vintage—were created.
The indices for each vintage are constructed from CDS on tranches of a selected sample of 20 home equity ABS deals. Each ABS deal must have a tranche at each of the five rating levels. Thus, the same 20 deals serve as the reference entities for the CDS that make up the indices for a single vintage. That is, the 2006-1 vintage, released in January 2006, has five indices that are all based on different tranches of the same 20 ABS deals. The index constituents do not change over the life of the index.
These Markit indices are not merely data series that track constituents over time—they also underlie tradable OTC contracts used by broker-dealers and other market participants to hedge, speculate, and trade. (i.e., the indices are used to buy and sell protection against defaults and other credit events.) The protection buyer pays a fixed rate of a set number of basis points, quoted on a per annum basis, to the protection seller each month. The protection seller pays the protection buyer in the case of credit events including interest shortfall, principal shortfall, or a writedown of the underlying home equity ABS.
Importantly, Markit makes daily closing prices available on its website along with some historical data. For each ABX index, Markit solicits closing mid-market transactions prices. Markit then uses an algorithm to compute the daily fixing that is taken from the way the British Banker's Association calculates LIBOR.31
The introduction of the ABX indices added a great deal of visibility to trends in market opinion regarding home equity ABS. By introducing CDS on subprime risk, the ABX created greater liquidity and price transparency than existed for the reference home equity ABS. This is not unique to the ABX. CDS are often so liquidly traded that they respond to market information faster than the bonds they reference. As Longstaff (2008) has stated:
Despite the lower liquidity of the ABS CDO market, we find that ABX index returns developed significant predictive power for subsequent Treasury bond and stock market returns as the crisis unfolded.32
The availability of market-based prices for credit risk is an important step forward in being able to value CDOs. The 20 ABS deals in any given ABX index will differ from the collateral of any given CDO, and, moreover, the typical CDO will contain many more than 20 ABS deals. As such, there will be basis risk between the movements in the ABX index and a CDO's collateral securities, even if they are all home equity ABS and of a similar vintage. Although CDO valuation is most often based on models, a model that has as its basic inputs price data from liquid markets will be more reliable. Also, to the extent that the price data from the ABX indices are sensitive indicators of the value of new information coming into the market, they can indicate events that occurred during the market meltdown which had the most impact on perceived credit, counterparty, and liquidity risk.
THE IMPORTANCE OF CORRELATION AND LONG CORRELATION TRADE
To value a CDO, one needs to understand the credit risk of its portfolio of assets. This portfolio credit risk has two parts. First, for each asset, there is the probability that it will default. (Normally, one would also need to make assumptions about the loss severity given default, but we will ignore this aspect to keep matters simple.) Second, there is the default correlation among the assets. For most financial market participants, the first part is easy to grasp (the difficulty is in quantifying it), but the second is more difficult. Before describing how CDOs are valued in more detail, it is worthwhile trying to develop an intuitive understanding of the importance of correlation for the overall credit risk of a diversified portfolio of risky bonds. We will use the analogy of a coin-flipping game to show how correlation can change the risk profile of the tranches in an ABS.
No Correlation of Default
Let us suppose that I-bank develops a very simple CDO of very risky bonds that it divides into two tranches that it sells to two other people—Tranche A Investor and Tranche B Investor. The rules are as follows:
- I-bank sells shares in the Trust separately to Tranche A (Senior) Investor and Tranche B (Subordinate) Investor.
- With the money raised, I-bank buys two bonds, Bond 001 and Bond
002, from different issuers. It places the bonds into the Trust as
Collateral to be held for Tranche A Investor and Tranche B
Investor.
- Each bond either matures in one year and pays $100 in principal, or it defaults and pays back nothing.
- For each bond, the probability of default is 0.5.
- At the end of one year, then, the bond principal repayments are
distributed to Tranche A and Tranche B according to the following
waterfall:
- If neither bond defaults then all $200 of the cash from the bond repayments is used to pay Tranche A Investor and Tranche B Investor $100 each (we assume a zero interest rate for simplicity).
- If one bond defaults and the other does not, then $100 in cash from the non-defaulting bond principal repayment is paid to Tranche A Investor and Tranche B Investor receives nothing.
- If both bonds default then neither Tranche A Investor nor Tranche B investor receive anything.
Admitting these are very risky investments because of the high default rates, it is worthwhile trying to figure out the value of each tranche; the two investors might not actually want to pay a full $100. If both investors are risk neutral, then how much should Tranche A Investor be willing to pay for Tranche A?33 And how much should Tranche B Investor be willing to pay for Tranche B?
To analyze this further, let us put the probabilities of repayment versus default into a simple cross-tabulation.
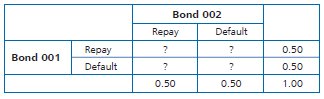
Recall we are assuming there is 50-50 chance of default for each of the bonds. But knowing this does not by itself tell us the probability of the outcomes of interest. What we need to know is the joint probability of (Repay, Repay), (Repay, Default), (Default, Repay), and (Default, Default). In other words we need to fill in the cells inside this matrix where we now have question marks.
To fill in the cells, we need more information. Based on what we know, the only requirements for these joint probabilities are that: the sum of the joint probabilities in each row (that is the sum of the two cells in each row) equals 0.5; the sum of the joint probabilities in each column (that is the sum of the two cells in each column) equals 0.5; and all joint probabilities are non-negative.
If we were to think of the bond payoffs as being two separate coin flips, we would then assume that the default rates of Bond 001 and Bond 002 are independent of each other—in other words, that they are uncorrelated. A property of independent probabilities is that the probability of a joint outcome (such as Default-Default) is the product of the probability of each of two separate outcomes (the probability of Bond 001 defaulting times the probability of Bond 002's defaulting is like the probability of flipping two Tails). Consequently, we can fill in the table as follows:
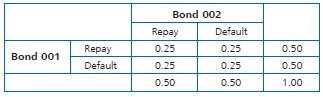
We are now in a position to determine the probabilities of each of the following outcomes:
|
(1) |
Neither Tranche A nor Tranche B gets wiped out |
= |
P(Repay, Repay) |
= |
0.25 |
|
(2) |
Tranche A gets wiped out |
= |
P(Default, Default) |
= |
0.25 |
|
(3) |
Tranche B gets wiped out |
= |
P(Default, Default) + |
= |
0.75 |
Consequently, the expected payoffs to Tranche A and B are as follows:
|
Tranche A expected payoff |
= |
(1 – .25) × $100 |
= |
$75 |
|
Tranche B expected payoff |
= |
(1 – .75) × $100 |
= |
$25 |
Therefore, Tranche B Investor should pay no more than $25 for Tranche B and Tranche A Investor should pay no more than $75 for Tranche A.34
One would be skeptical, however, of the assumption of no correlation of default—bond payouts are not determined by coin flips, but by economic factors. For example, macroeconomic circumstances might be expected to affect the prospects of both Bond 001 and Bond 002; in a declining economy, both would be expected to become less creditworthy than in a growing economy. Such skepticism is warranted because if there is high default correlation, either positive or negative, then the effects on the expected payoffs to tranche holders can be quite profound.
*Click here to read article in full*
Footnotes
* The opinions expressed herein do not necessarily represent the views of NERA Economic Consulting or any other NERA consultant. Please do not cite without explicit permission from the authors.
1. Dr. Frederick C. Dunbar is an Economic Fellow at the SEC. Prior to joining the SEC, he was a Senior Vice President at NERA. This paper expresses the author's views and does not necessarily reflect those of the Commission, the Commissioners, or other members of the staff.
2. NERA proprietary database.
3. IMF Global Financial Stability Report, April 2010.
4. Thomson Reuters, SIFMA, "Global CDO Issuance by Underlying Collateral," http://www.sifma.org/uploadedFiles/Research/Statistics/SIFMA_GlobalCDOData.pdf.
5. See, for example, Alan Greenspan's remarks to the Federal Reserve Bank of Chicago in May 2005; a speech titled "Risk Transfer and Financial Stability," http://www.gov/bfederalreserveoarddocs/speeches/2005/20050505/default.htm:
"Two years ago at this conference I argued that the growing array of derivatives and the related application of more-sophisticated methods for measuring and managing risks had been key factors underlying the remarkable resilience of the banking system, which had recently shrugged off severe shocks to the economy and the financial system. [...] As is generally acknowledged, the development of credit derivatives has contributed to the stability of the banking system by allowing banks, especially the largest, systemically important banks, to measure and manage their credit risks more effectively."
6. Basics of Mortgage-Backed Securities, Joseph Hu, Frank J. Fabozzi Associates, New Hope, PA, 1997, p.8.
7. Federal Reserve Board, Statistical Supplement to the Federal Reserve Bulletin, http://www.federalreserve.gov/pubs/supplement/2008/08/table1_54.htm.
8. There is a veritable alphabet soup of terms used to refer to securitizations of mortgages, including CMO (Collateralized Mortgage Obligation), and REMIC (Real Estate Mortgage Investment Conduit). Some of these terms refer to the trust or special purpose vehicles that issue the bonds and not the bonds themselves. One important example, though, are bonds backed by subprime mortgages, and labeled as ABS (Asset-Backed Securities).
9. The agencies are formally named the Federal National Mortgage Association ("Fannie Mae"), the Federal Home Loan Mortgage Corporation ("Freddie Mac"), and the Government National Mortgage Association ("Ginnie Mae").
10. Frank J. Fabozzi and Steven V. Mann, Handbook of Fixed Income Securities, 7th Ed. (New York: McGraw-Hill, 2005), 591.
11. "Home Equity ABS Basics" Nomura Fixed Income Research, November 1, 2004.
12. For an overview of these credit enhancement options, see The Handbook of Mortgage-Backed Securities (Frank J. Fabozzi, ed., 6th edition, 2006).
13. An exception could arise if there were an unforeseen shortfall in cash flows, as payments made to subordinated bondholders cannot be clawed back. Consider the following simplified example of an ABS with two payment periods (with expected equal payments) and two classes, a senior class with 20% subordination and a junior class. In the first payment period, the ABS received 100% of cash flows due and anticipated no shortfall in the second period, so paid 80% of cash flows to the senior class and 20% to the junior class. In the second period, cash flows unexpectedly fall to 75%, all of which are paid to the senior class. Although 88% of total cash flows are received, the senior class experiences a shortfall of 2.5%.
14. Depending on when the losses become anticipated, the junior or Class C tranche may have already received some principal payments, such that the principal available to Class B bondholders would be reduced by that amount.
15. See Douglas J. Lucas, Laurie S. Goodman & Frank J. Fabozzi, Collateralized Debt Obligations: Structures and Analysis 3 (2nd ed. 2006).
16. In July 2007, Morgan Stanley estimated that subprime mortgages represented 46% of the collateral in high grade structured finance CDOs, with potential additional exposure via the 20% of collateral in tranches of other CDOs, and 77% of the collateral in mezzanine structured finance CDOs. "Ratings Action: Something Had to Give," Morgan Stanley CDO Market Insights, July 16, 2007.
17. The underlying MBS are already assembled with an eye towards diversification in its mortgage pool: by geography, by services, etc. By investing in MBS issued by different mortgage originators, though, CDOs can diversify their mortgage exposure even more.
18. Gary Gorton, "The Panic of 2007," Fed. Res. Bank of Kansas City Jackson Hole Conference (August 2008, August 4, 2008 ver.), available at http://www.kc.frb.org/publicat/sympos/2008/gorton.08.04.08.pdf at 3. ("The key security design feature of subprime mortgages was the ability of borrowers to finance and refinance their homes based on the capital gains due to house price appreciation over short horizons and then turning this into collateral for a new mortgage (or extracting the equity for consumption). The unique design of subprime mortgages resulted in unique structures for their securitization, reflecting the underlying mortgage design. Further, the subprime residential mortgage-backed securities (MBS) bonds resulting from the securitization often populated the underlying portfolios of collateralized debt obligations (CDOs)...").
19. Authors' calculations based on four bonds from each of the ABX-06-1 and 07-1 indices, where bonds are all those for whom the necessary data was publicly available.
20. Or, if the homeowner then qualified, a conforming loan.
21. Many CDOs are over-collateralized as a form of credit enhancement. For example, if $100 were owed to bondholders, the CDO would have $105 in collateral and any cash flows in excess of $100 would flow to the equity tranche holders. In CDOs without overcollateralization, equity tranche holders would receive payment only if $100 in collateral yielded more than $100 in cash flows.
22. Steven L. Schwarcz, "The Future of Securitization," Duke Public Law & Legal Theory Research Paper Series no. 233, Nov. 2008, available at http://ssrn.com/abstract=1300928, at 4 ("The failure of subprime mortgage securitization was thus caused by its almost absolute dependence on home appreciation.").
23. All else equal, diversification is a way to achieve a higher rating. See U.S. CMBS: Sensitivity of CRE CDOs to Key Credit Variables (Moody's Investor Service), Sept. 21, 2006.
24. Assuming that the CDOs held by a mezzanine CDO were also holding the typical amount of RMBS, this implies that the typical mezzanine CDO held about 94% subprime or other RMBS.
25. Basel Committee on Banking Supervision, Credit Risk Transfer: Developments from 2005 to 2007 (April 2008).
26. Frank J. Fabozzi and Steven V. Mann, Handbook of Fixed Income Securities, 7th Ed. (New York: McGraw-Hill, 2005), p. 698.
27. This portfolio of high-grade securities is called, somewhat confusingly, collateral. In the cash CDO, the collateral is, say, the actual tranches of the MBS owned by the CDO. In the synthetic CDO, these same tranches of MBS would be called the reference portfolio.
28. Corporate and municipal bonds also trade over the counter. However, all transactions must be reported. Corporate bond trades must be reported to the TRACE system within 15 minutes and is reported to other dealers in real time; municipal bond trades must be reported to the MSRB Trade Reporting System by midnight of the same day. All reported prices are publicly available within a day.
29. The other major credit indices are described in a following section. The initial dealers were: Bank of America, Barclays Capital, Bear Stearns, BNP Paribas, Citigroup, Credit Suisse, Deutsche Bank, Goldman Sachs, JP Morgan, Lehman Brothers, RBS Greenwich Capital, Merrill Lynch, Morgan Stanley, UBS, and Wachovia.
30. For a description of credit default swaps, see Appendix. Also, Markit, "Market Credit Indices: A Primer," (June 2008), available at https://www.markit.com/news/Credit%20Indices%20Primer.pdf.
31. Index Methodology for the ABX.HE Index for the Sub-Prime Home Equity Sector ("ABX.HE Index Rules"), Sept. 5, 2008, available at http://www.markit.com/assets/en/docs/products/data/indices/structured-finance/ABX%20rules%20revised%209-9-08.pdf. For comparison to the calculation of BBA LIBOR, see BBA website, http://www.bbalibor.com/bba/jsp/polopoly.jsp?d=1627.
32. Francis A. Longstaff, The Subprime Credit Crisis and Contagion in Financial Markets (UCLA Anderson School and NBER, Aug. 2008), available at http://www.claremontmckenna.edu/rdschool/seminar/Longstaff_subprime.pdf.
33. Investors are "risk neutral" when they only care about the expected return of an investment. They always prefer a portfolio with higher expected returns, regardless of how risky the portfolio is, and they are indifferent between two portfolios with the same expected return. A "risk neutral" investor, on the other hand may prefer a portfolio with a lower expected return, if it is also less risky.
34. As a check, it is worth noting that the sum of these payments is $100. That is, the issuer of the CDO would have a total of $100 to purchase the two bonds. Because each bond has a 50-50 chance of paying either zero or $100, the expected value of each bond is $50 which, therefore, would also be the market value for each. Consequently, the amount raised from the investors just covers the market value of the bonds in the CDO.
The content of this article is intended to provide a general guide to the subject matter. Specialist advice should be sought about your specific circumstances.