
- within Criminal Law, Immigration and Cannabis & Hemp topic(s)
Key Take-Away:
2025 data reflects a rebalancing of risk and capital allocation in early-stage licensing & collaboration deals, with proportionately more value being allocated earlier in development and modest compression in back-end economics.
- Median total deal value for early-stage deals increased modestly, with a larger share of value allocated to upfront and development milestone payments.
2025 By the Numbers:
$23B+
Total Deal Value1
73%
Exclusive Royalty-Bearing Licenses
88%
Worldwide Licenses
Data Vantage Point: Life Sciences
Our proprietary database tracks more than 200 life sciences licensing and collaboration transactions. Built from our experience handling life sciences transactions, this database covers product types such as biologics (48%), small molecules (27%), devices (6%), and other products (19%). Updated quarterly, interactive visualizations are available on our database.
Trends in Life Sciences Licensing & Collaboration Deals:
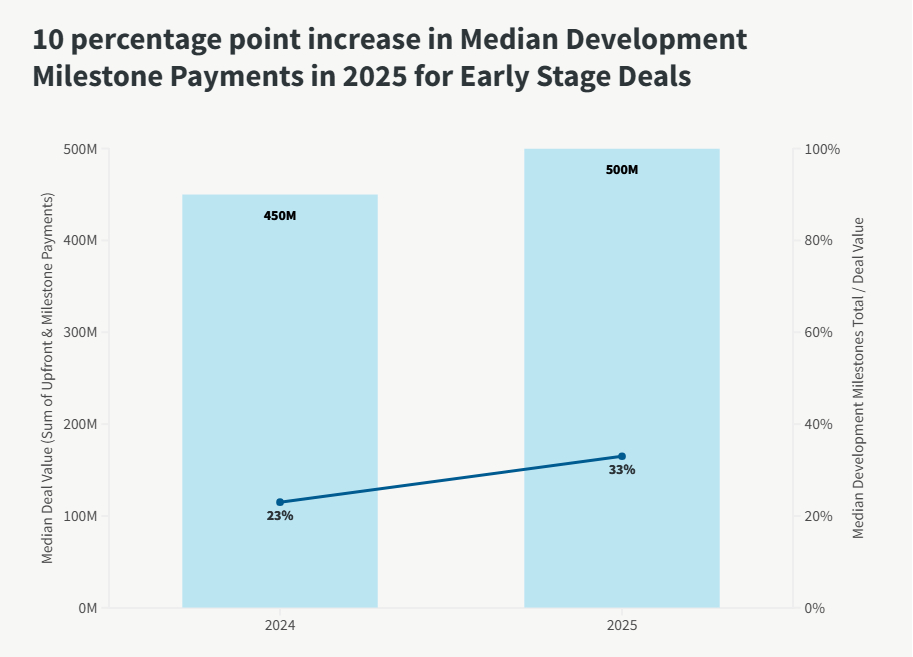
1. Median Deal Value Increased to $470M in 2025 from $460M in 2024 for early-stage deals2, and the composition shifted earlier in the development lifecycle:
- Upfront Payments more than doubled as a percent of overall deal value for early-stage deals from 1.5% to 3.7%.
- 10 percentage point increase in median development milestone payments from 23% to 33% (see chart below).
- Sales milestones still made up the majority of total deal value, but overall percentage declined from 73% to 64%.
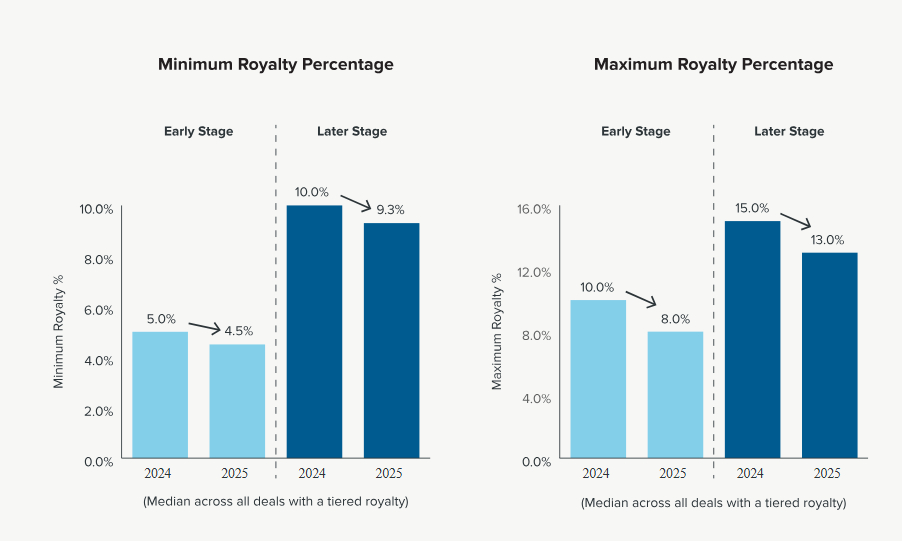
2. Royalty tiers compressed across both early- and later-stage deals (see charts below):
- Early-Stage Deals
- Median Low Rate Tier: 4.5% (-.5% from 2024)
- Median High Rate Tier: 8% (-2%)
- Later-Stage Deals3
-
- Median Low Rate Tier: 9.3% (-.7%)
- Median High Rate Tier: 13% (-2%)
3. Equity grants by licensees remained selective (22% of deals), suggesting they were used strategically in targeted collaborations.
- For those deals with an equity grant, the median amount was 20%.
4. Consistent with 2024, 17% of deals included an opt-in, with an option as the predominant mechanism.
5. Control allocation continued to favor licensees, with licensees typically having the first right to prosecute & enforce (66% and 74% of deals respectively).
Footnotes
1 Total Deal Value = Upfront + Development Milestones + Sales Milestones
2 Early-Stage Deals = Discovery & Pre-Clinical
3 Later-Stage Deals = Phase 1+
The content of this article is intended to provide a general guide to the subject matter. Specialist advice should be sought about your specific circumstances.