
As more companies and investors disclose on their carbon footprints, a common question is: "How do we perform versus our peers?" The practice of carbon footprint benchmarking has therefore grown in relevance but, whilst investors are adept at comparing financial performance, they struggle with comparing carbon footprint data. In this article, we will outline the main challenges with respect to carbon footprint benchmarking, and how to properly navigate this complex landscape.
Which scopes are in scope?
The Greenhouse Gas Protocol (GHG) is the main accounting standard for measuring and reporting greenhouse gas emissions. It delineates three distinct 'scopes' of carbon. Scope 1 and 2 are considered to be part of the organisation's operational footprint: Scope 1 direct emissions arise from assets owned or controlled by the company, whereas Scope 2 emissions are indirect emissions due to the purchase of energy, e.g., electricity or district heating. These two scopes are quite well-defined, but the main benchmarking challenge lies in Scope 3 emissions, which sometimes functions as a 'catch-all' bucket for all value chain emissions. In comparing emissions to those of peers, the scopes to be compared must be clearly stated, to prevent any misrepresentations.
If your organisation wishes to compare Scope 3 emissions in addition to Scope 1 and 2 emissions, care must be taken to identify the Scope 3 sources reported by peers, as a full Scope 3 assessment may not have been undertaken. Rather, so-called Scope 3 data may be limited to a small subsection of categories that are easily measurable, such as business travel. For more complex emission categories, such as purchased goods and services, or end-of-life treatment of sold products, the data (and, indeed, the methodology) may be limited or lacking in sophistication. As such, companies may simply exclude these categories from their Scope 3 assessment, resulting in an incomplete report 1.
Peer comparisons can be useful as a motivational pat on the shoulder indicating that a firm is on the right track – but they should never be considered an excuse to sit and become complacent.
In addition to the potential incompleteness of Scope 3 data, there are more fundamental issues that come into play. Firstly, the start- and endpoint of a firm's value chain is typically set unilaterally, and this can lead to differences in value chain boundaries. For instance, if a company is a producer of electronic equipment and uses copper in producing printed circuit boards, should it include the mining of that copper, or only the smelting, or only the transportation to the factory? Secondly, due to the fundamental complexity and novelty of Scope 3 measurements for many companies, mistakes and judgment errors are common, making the reference benchmark less reliable.
The central paradox for benchmarking is that a company or investor that values carbon accounting will tend to invest more in measuring its footprint. In essence, this is a good development, because it provides a complete view of the organisation's carbon hotspots. However, this can create a benchmark bias when comparing to peers whose reporting is incomplete. It may appear that frontrunning companies and investors with comprehensive reporting have a higher total footprint, whereas the actual situation could be the reverse.
How to compare, precisely
Organisations are often grouped by industry and region to increase the comparability of their reported footprints. Naturally, a typical company in the services industry will have a lower carbon footprint (per million euros of revenue) than an oil and gas company. Still, even within sectors, there is significant spread, making meaningful comparisons a challenge. Let's take two e-commerce companies, for example. One mainly sells books, the other mostly personal electronic equipment. Since the latter distributor needs to account for the use-phase emissions of the products in its Scope 3 downstream emissions, it will have a far higher emission profile than the e-commerce company selling books (that do not consume energy in their use phase).
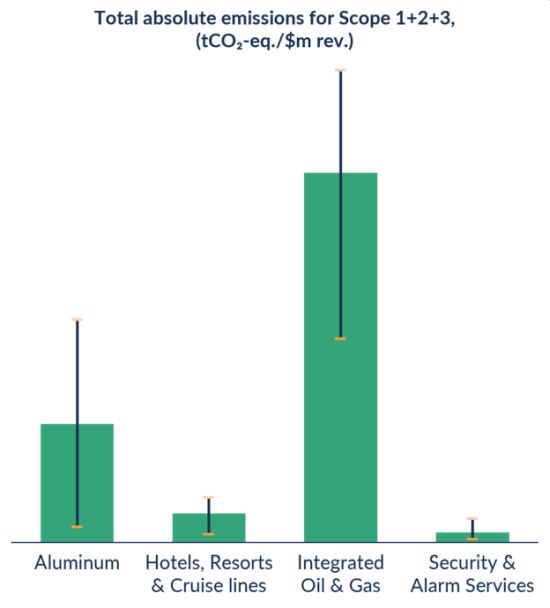
Figure 1: Comparing footprints between and within sectors is no sinecure. Lower and upper bounds can differ as much as the expected value. Values omitted for data confidentiality purposes.
Moreover, if the desire is to compare only very similar companies, the necessary segmentation could dramatically reduce the sample size, thereby making a benchmark meaningless. Typical datasets on carbon emissions use listed companies as proxy data and contain between 10 and 20 thousand companies, in total. If regional and subsector segregation were to be employed (assuming approximately 200 and 160 GICS subindustries) the sample size becomes very small for certain combinations.
Fortunately though, the 2025 Corporate Sustainability Reporting Directive (CSRD) will push larger private companies to provide higher quality disclosure, hopefully leading to increased transparency and a larger pool of data for benchmarking. Until then, however, companies and investors will need to accept certain biases in industry emission averages.
So, setting aside all current complexities in benchmarking, how should carbon footprints be compared, in an ideal world? To benchmark in a like-for-like fashion, an organisation should compare with peers that share:
- A similar business model: They do not necessarily need to be in the exact same industry, but the operational model should be alike (e.g., logistical movements, production methods, etc).
- A similar size: Larger companies tend to leverage economies of scale and are thus more 'carbon-effective' in terms of their revenue than smaller companies.
- Similar geographies: This is particularly pertinent for electricity emissions, which can differ significantly per country.
- Similar accounting mechanisms, emission factors and units of comparison: This may seem trivial, but it is paramount that all parties follow the GHG Protocol, are as comprehensive as possible, and are transparent about the emission factors they assign to certain emission sources.
The bottom line
Ultimately, the focus should never be on comparison at the expense of action. The goal for carbon emissions is clear: net-zero as soon as possible, and at the latest by 2050 for hard-to-abate sectors. Any remaining carbon emissions should be reduced until all practical decarbonisation measures have been employed. That exercise should be repeated annually, as technological innovations will create more practical measures for decarbonisation. Peer comparisons can be useful as a motivational pat on the shoulder indicating that a firm is on the right track, but they should never be considered an excuse to sit and become complacent. Consider it a time trial rather than a direct race against other contenders. The winning time is only known at the end of the race, so for everyone who wants to win, the goal is clear: go as fast as you possibly can, with nothing holding you back. There's no difference in the race towards net-zero. "Run, Forrest, run!"
Footnote
1. – Scope 3 Carbon Emissions: Seeing the Full Pictur
The content of this article is intended to provide a general guide to the subject matter. Specialist advice should be sought about your specific circumstances.

