Background
We analyzed the terms of venture financings for 124 companies headquartered in Silicon Valley that reported raising money in the second quarter of 2013.
Overview of Fenwick & West Results
While valuation related results for 2Q13 were generally healthy,
certain trends bear watching. Specifically, although the percentage
of up rounds declined only mildly, to 64%, the number of down
rounds doubled to 22%. Additionally, while the average share price
increase improved modestly compared to 1Q13 (62% to 57%), the
median share price was relatively low at 19%, and for the second
quarter in a row was noticeably below the 30% average median
increase in 2012.
Here are the more detailed results.
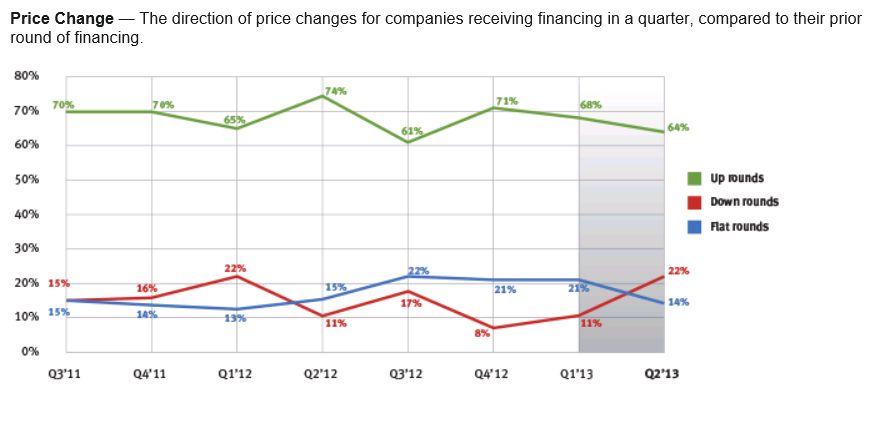
- Up rounds exceeded down rounds in 2Q13, 64% to 22% with 14% of rounds flat. This was a decrease from 1Q13 when 68% of rounds were up, 11% were down and 21% were flat.
- The Fenwick & West Venture Capital Barometer" showed an average price increase of 62% in 2Q13, a slight increase from the 57% reported in 1Q13.
- The median price increase of financings in 2Q13 was 19%, an increase from the 1Q13 results of 14%, but a noticeable decline from prior quarters.
- The results by industry are set forth below. In general the software industry was the strongest, followed by internet/digital media and hardware, with life science lagging. The three financings with the largest percentage increase in price were all in the software industry.
Overview of Other Industry Data
Third party reports of the venture environment for the second quarter of 2013 showed:
- A mild increase in venture investing in 2Q13 compared to 1Q13, with 2Q13 improving as the quarter progressed. But the first half of 2013 lagged 2012.
- IPOs were up significantly in 2Q13 due to the largest number of biotech IPOs since 3Q00, but IT IPOs were flat.
- The number of acquisitions of venture backed U.S. companies was the lowest since 3Q09. The total amount paid was an increase over 1Q13, but still relatively low.
- Venture fundraising was again weak, declining against both 1Q13 and 1H12, and continued to trail the amounts invested by venture capitalists in companies.
- Corporate venture investing was at its highest levels (as a percentage of total investment) since 2001.
- Venture capitalist confidence improved for the fourth straight quarter, as venture capitalists noted various trends likely to improve venture capital returns over the next three to five years.
The more detailed results follow:
- Venture Capital Investment
Dow Jones VentureSource ("VentureSource") reported a 12% increase in venture investment and a 6.5% increase in the number of venture financings from 1Q13 to 2Q13. Specifically, $7.2 billion was invested in 801 financings in 2Q13 compared to $6.4 billion invested in 752 financings in 1Q13 (as reported in April 2013).1 Similarly, the PwC/NVCA MoneyTree" Report based on data from Thomson Reuters (the "MoneyTree Report") reported a 13.5% increase in venture investment and a 6% increase in venture financings from 1Q13 to 2Q13. They reported that $6.7 billion was raised in 913 financings in 2Q13 compared to $5.9 billion raised in 863 financings in 1Q13 (as reported in April 2013).1 The MoneyTree Report also noted that biotech investment increased 41% from 1Q13 to 2Q13. Both services reported that venture investment in 1H13 lagged 1H12. CB Insights and TechCrunch each reported that venture investing trended up noticeably as 2Q13 progressed.
- IPO Activity
There was a significant increase in IPOs in 2Q13, with 18 IPOs raising $1.7 billion in 2Q13, compared to 9 IPOs raising $0.6 billion in 1Q13, according to VentureSource. Ten of the IPOs were in healthcare, as IT IPOs were flat compared to 1Q13. Thomson Reuters reported similar results and noted that there were the most biotech IPOs in a quarter since 3Q00.
The increase in healthcare IPOs was attributed to increasing new drug approvals (the 39 new drugs approved by the FDA in 2012 was the highest since 1997) and strong performance by public biotech companies. (VentureWire, Rockoff and Demos, July 1, 2013).
- Merger and Acquisition Activity
VentureSource reported an 11% decline in the number of venture backed U.S. companies that were acquired, but a 66% increase in the amount paid for such acquisitions, in 2Q13 compared to 1Q13 (as reported in April 2013).1 Specifically there were 84 transactions for $8.0 billion in 2Q13 compared to 94 transactions raising $4.9 billion in 1Q13. This was the fewest number of acquisitions in a quarter since 3Q09.
Similarly, Thomson Reuters reported 84 acquisitions in 2Q13 and noted that overall the number of acquisitions in 1H13 was much lower than 1H12.
- Venture Capital Fundraising
Thomson Reuters reported a 29% decrease in dollars raised, although an increase in the number of funds raising money, in 2Q13 compared to 1Q13. Specifically 44 funds raised $2.9 billion in 2Q13 compared to 35 funds raising $4.1 billion in 1Q13. The amount raised was the lowest since 3Q11. The top 5 venture funds accounted for 55% of the total.
Similarly, VentureSource reported a 15% decline in fundraising in 1H13 compared to 1H12.
- Venture Firm Trends
The environment in which venture firms operate has changed significantly in recent years, with the growth of micro-VCs, accelerators, angels, crowd funding, investor matching sites and secondary exchanges. Additionally limited partners have become more willing to question their relationship with general partners, as evidenced by the Kauffman Report opining that the limited partner/general partner relationship needed changes.
These changes have been driven in large part by the reduced need for capital to start new IT companies, mediocre venture investment returns over the past decade, changes in the legal environment, and external economic events that have reduced liquidity exits, especially IPOs.
In response, some venture capitalists are making changes to their operating model. -
- As many startups need less money, and early stage investing has become more competitive, many VCs are focusing on ways to distinguish themselves from their competitors.
- As reported in the Venture Capital Journal, one example of this is the "agency" model, exemplified by Andreessen Horowitz, who have 50 people dedicated to providing ancillary services like public relations, recruiting, etc. to their portfolio companies.
Another example is the "community" model, exemplified by First Round Capital, which has created a web platform to transform their portfolio companies into a community where entrepreneurs can exchange information, ideas and best practices among themselves.
- Venture capitalists are also using technology to identify trends, companies and people at earlier stages, by mining information from data bases like Crunchbase, social media like Twitter, app store information and proprietary data sources, per TechCrunch. This information can be used not only to identify trends and information directly of use to the VCs, but also to assist their existing portfolio companies. Examples of these endeavors are Grove (by Sequoia) and Dragnet (by Kleiner Perkins). (VentureWire, Evelyn Rusli, May 22, 2013).
- Branding has also become a growing focus of VCs, evidenced by
the recent branding survey undertaken for the
NVCA by DeSantis Breindel. This survey emphasized the value of
branding but also focuses on some differences in how VCs try to
brand themselves, and what entrepreneurs value.
For example, 22% of VCs said that branding themselves as "hands on" was important, while only 1% of entrepreneurs agreed. Similarly, 28% of VCs felt that the reputation of their other portfolio companies was the most important factor in driving a positive brand image, while only 5% of entrepreneurs agreed.
- Corporate VC Investing
The MoneyTree Report reported that 13.5% of all amounts raised in venture deals in 2Q13 came from corporate venture capitalists ("CVCs"). This was a significant increase from the 8.35% average over the prior 4 quarters. CVC investment percentages at this level had not been seen since 2001. CVCs were especially active in telecom, networking, biotech and cleantech, where they invested in over 17.5% of all venture deals. GoogleVentures was the fourth largest investor (by number of deals) in 2Q13 according to VentureSource.
- Angels and Accelerators
The Halo Report for 1Q13 reported that for angel only rounds, the median round size was $680,000, a five quarter high, the median pre-money valuations were stable at $2.5 million and that 67% of investment went into internet, healthcare and mobile/telecom companies. AngelList announced a service that lets angel investors syndicate a deal with each other and allows the lead angel to collect a carried interest from other participating angels, according to TechCrunch.
- Venture Capital Return
Cambridge Associates reported that the value of its venture capital index increased by 2.5% in 1Q13 (2Q13 information has not been publicly released), but this lagged the 8.2% increase in Nasdaq. For longer time frames, the venture capital index surpassed Nasdaq for the 3 year period and for 15 years and longer, but trailed for the 1, 5 and 10 year period, and trailed the S&P 500 for all periods of less than 15 years.
An article to be published in the Journal of Finance reports that despite these disappointing results, investors in not only the first quartile of venture funds, but also the second quartile, have beaten public market investments since 2000. (VentureWire, John Shinal, June 14, 2013).
- Venture Capital Sentiment
The Silicon Valley Venture Capitalists Confidence Index® by Professor Mark Cannice at the University of San Francisco reported that the confidence level of Silicon Valley venture capitalists was 3.78 on a 5 point scale in 2Q13, a slight increase from 3.73 in 1Q13 and the fourth consecutive quarterly increase in the index. Reasons given for the increase included high expectations for disruptive technologies such as cloud, mobile and social, declining uncertainty in the macro economic environment, and the limited availability of venture capital funds, which were expected to result in an improvement in venture capital returns.
- Nasdaq
Nasdaq increased 4.1% in 2Q13, and has increased an additional 7% in 3Q13 through August 13, 2013.
Price Change — The direction of price
changes for companies receiving financing in a quarter, compared to
their prior round of financing.
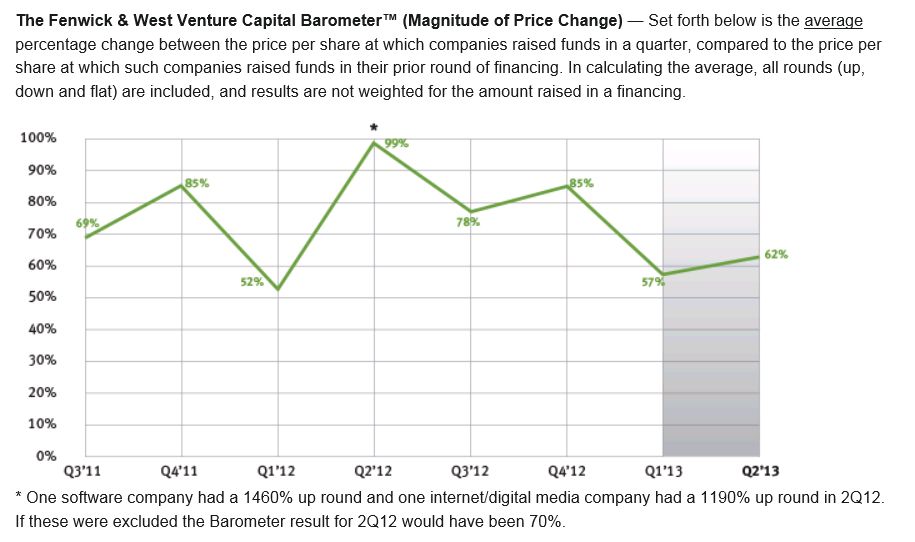
* One software company had a 1460% up round and one internet/digital media company had a 1190% up round in 2Q12. If these were excluded the Barometer result for 2Q12 would have been 70%.
To view this article in full please click here
The content of this article is intended to provide a general guide to the subject matter. Specialist advice should be sought about your specific circumstances.