Trends in Terms of U.S. Life Science Venture Financings (First Half 2012)
Survey Introduction and Background
For the past ten years, Fenwick & West has published a quarterly survey of trends in the valuations and terms of venture financings in Silicon Valley. A copy of the most recent version of that survey is available here.
In 2011, we began publishing a separate survey of biopharmaceutical and medical device companies ("life science") companies. We believe this separate survey focusing on life science companies better highlights issues and trends that are affecting the life science industry differently than other industries.
This survey reflects our analysis of the terms of venture financings for 186 life science companies headquartered in the United States that reported raising money during the first half of 2012. The results are summarized below.
Overview of Fenwick & West Results
Results from our survey indicate that financings occurring during the first half of 2012 were more likely to involve an increase in valuation, in comparison to 2011 financings. In addition, the average round-to-round price change (as measured by the Fenwick & West Life Science Venture Capital Barometer") for the first half of 2012 was higher than previous periods.
However, while our survey indicates that for those companies able to complete a financing during the first half of 2012, valuation-related metrics have improved somewhat, the overall life science venture funding environment remains difficult, with industry reports indicating that the level of financing activity during the first half of 2012 fell off significantly.
Key observations and highlights include the following:
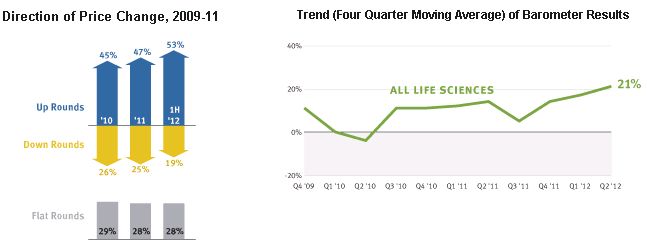
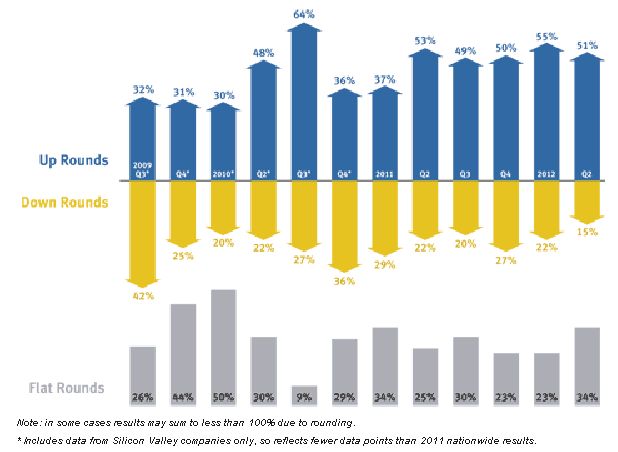
- During the first half of 2012, up rounds outpaced down rounds 53% to 19%, with 28% of rounds flat. This represents a modest improvement over results from 2011, which averaged 47% up rounds and 25% down rounds.
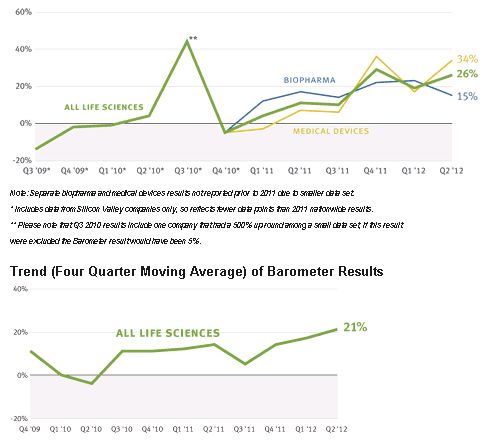
- The Fenwick & West Life Science Venture Capital Barometer") showed average round-to-round price increases of 19% for Q1 of 2012 and 26% for Q2 of 2012. For comparison, Barometer results for Q1 and Q2 of 2011 were 4% and 11%, respectively. Barometer results have continued to trend upward modestly from 2010 levels, with the four quarter moving average as of Q2 of 2012 rising to 21%.
- Data on first half of 2012 financing terms show a substantial use of senior liquidation preferences, which appear in 47% of all rounds and a majority of Series D and higher rounds. Participating liquidation preferences are also common, appearing in majority of all rounds, and uncapped in approximately two-thirds of the cases.
- In addition, life science financings during the first half of 2012 were significantly more likely to involve senior liquidation preferences, participation rights and "pay-to-play" provisions, in comparison to other industries covered by our Silicon Valley survey.
Analysis of Third Party Reports
The financing environment remained challenging for venture backed life science companies during the first half of 2012. As detailed below, the levels of life science-related investment and venture capital fundraising are off markedly from 2011 and below historical averages. Exit activity is also down, but in comparison to investing and fundraising remained somewhat stronger, driven in part by large company buyers' continuing need to refill their product pipelines through acquisition.
The challenges of the current financing environment are particularly acute for companies pursuing earlier stage and higher risk innovations, and have pushed some participants in that segment of the market to explore different business and financing models. For example, large life science companies, which continue to rely on venture-backed start-ups to advance promising new technologies and provide new products with high growth potential, have become more involved in providing funding to the sector, and more creative in the means by which they do so. In particular:
- The venture arms of larger corporations have always played a role in the life science sector, but participation has been increasing recently, with the National Venture Capital Association and Thompson Reuters reporting that corporate venture capitalists participated in 17.5% of all life science financings during the 2011 through 1H 2012 period, up from 15.3% of all financings during the 2010 through 2011 period.
- In addition, anecdotally it appears that large corporations are increasingly partnering directly with established venture capital firms, both by making direct investments into venture capital funds and by forming innovative collaborations that combine corporate and venture capitalist resources and expertise to identify and develop promising early stage technologies. Recent examples of this trend include collaborations between Merck and Flagship Ventures (2012), Johnson & Johnson, GlaxoSmithKline and Index Ventures (2012), Rusnano and Domain Associates (2011) and Shire Pharmaceuticals and Atlas Ventures (2011).
The increased involvement of large life science companies in funding early-stage innovation in the sector is a welcome development, but does not alter the basic fact that there is currently less funding available for venture-backed life science companies. Looking ahead, we expect that the overall life science venture financing environment will remain challenging in the near future, and accordingly that efforts to develop different business and financing models will continue to be important.
A more detailed summary and analysis of results from third-party reports follows below:
Venture Capital Investment
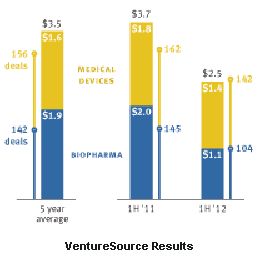
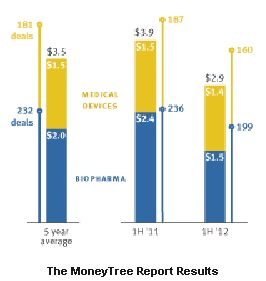
- Investments in venture-backed life science companies fell off significantly during 1H 2012. Both VentureSource and The MoneyTree Report showed double-digit decreases in dollars invested and number of deals occurring during 1H 2012, in comparison to results from 1H 2011, and levels of investment were below historical averages (as indicated by the five-year averages included in graphs below).
- In addition, other indicators of the health of the financing environment, such as the percentage of venture financings accounted for by life science companies, and the number of "first round" (initial) life science venture financings, were also off markedly.
- The fall-off in activity was more pronounced in the biopharmaceuticals sector, while the medical device sector fared modestly better.
According to Dow Jones VentureSource ("VentureSource"), equity investments in U.S. venture-backed life science companies totaled $2.5 billion across 246 deals during 1H 2012, a 34% decrease in dollars and 20% decrease in deals in comparison to 1H 2011. Within the life science sector, biopharmaceutical investments were off 46% in dollars and 28% in number of deals during 1H 2012 in comparison to 1H 2011, whereas medical device investments were off 20% in dollars and 12% in number of deals.
|
The PwC/NVCA MoneyTree Report based on data from Thomson Reuters ("The MoneyTree Report") showed generally similar results, reporting that investments in venture-backed life science companies totaled $2.9 billion across 359 deals in 1H 2012, a 25% decrease in dollars and a 15% decrease in deals in comparison to 1H 2011. The MoneyTree Report also showed a more pronounced decrease in biotechnology investments, which were reported to be off 35% in dollars and 16% in number of deals during 1H 2012, as compared to medical device investments which were off 9% in dollars and 14% in number of deals. |
For comparison, VentureSource reported that for 1H 2012 overall equity investments (measured across all industry sectors) decreased 7% in dollars in 5% in number of deals in comparison to 1H 2011. Similarly, The MoneyTree Report showed a 11% decrease in dollars and a 12% decrease in number of deals. According to both VentureSource and The MoneyTree Report, the percentage of financing activity accounted for by life science companies during 1H 2012 was the lowest of any half-year period during the last five years.
Venture Capital Fundraising
- Fundraising by venture capitalists in all industries increased during 1H 2012, and if the pace of fundraising continues for the remainder of the year, total 2012 fundraising would be $23-26 billion, higher than any year since 2008.
- However, our analysis of the underlying data, as summarized below, indicates that the portion of venture capital fundraising likely to be allocated to life science investment has been decreasing in recent periods.
In overall fundraising, Dow Jones reported that U.S. venture capital funds raised $13.0 billion in 1H 2012, an increase from the $10.2 billion raised in 1H 2011. Similarly, Thomson/NVCA reported that U.S. venture capital funds raised $11.5 billion in 1H 2012, an increase from the $10.1 billion raised in 1H 2012.
In contrast, however, our analysis of the underlying data from Dow Jones indicates that the proportion of fundraising accounted for by funds that focus primarily on healthcare or life science investing has decreased, going from 14% in 2011 to 6% in 1H 2012. Furthermore, we estimate, based on the methodology described below, that only 13% of the funds raised in 1H 2012 are likely to be allocated to life science investment, in comparison to 15% of 2011 funds and 17% of 2010 and 2009 funds.
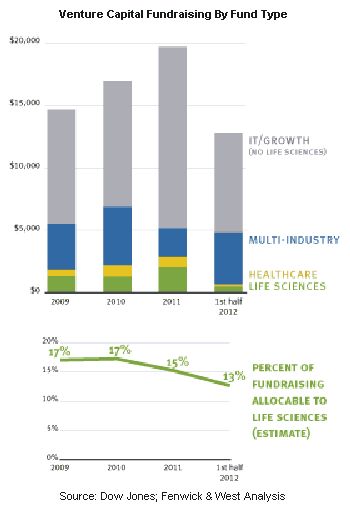
In order to calculate this estimate we categorized funds as either life sciences, healthcare (i.e., making both traditional life sciences and healthcare IT/services investments), multi-industry (i.e, making both healthcare and IT/growth investments) or pure IT/growth, and assumed that one half of healthcare funds and one quarter of multi-industry funds would be allocated to life science investment.
The methodology and estimates described above have their limitations, but in any event they strongly indicate that the percentage of venture capital fundraising likely to be allocated to life sciences is significantly below the percentage of investment into venture-backed companies accounted for by the life sciences sector (which has averaged 25-28% over the past 5 years). Accordingly, the reduced levels of life science investment seen during 1H 2012 are likely to continue for some time.
Merger and Acquisition Activity
- Data on private company life science M&A activity for 1H 2012 were mixed. However, industry observers have generally described life science M&A activity in 1H 2012 as reasonably robust, albeit a step down from the very strong levels seen in 2011.
- Overall M&A activity for venture-backed companies (measured across all industries) during 1H 2012 showed a 2% decrease in dollar terms and a 21% decrease in number of deals as compared to 1H 2011, according to Dow Jones.
As a measure of industry-wide activity, Burrill & Co., which reports on public and private company M&A activity for U.S.-based companies across a diversified set of life science sectors reported total deal volume of $41.6 billion for 1H 2012, a 26% decrease from the $56.0 billion reported for 1H 2011, but on pace to exceed the full year 2010 total of $71.8 billion.
In private company biopharmaceutical sector M&A, Dow Jones reported 10 acquisitions of U.S. venture-backed companies during 1H 2012, in comparison to a record-high 26 acquisitions reported for 1H 2011. In contrast, the HBM Partners Pharma/Biotech M&A Report ("HBM Report"), reported that the number of sales of U.S. venture-backed companies remained relatively steady (at 12 for 1H 2012, in comparison to 10 for 1H 2011) but that dollar volume was lower ($1.2 billion upfront in 1H 2012, which is off the pace of the $3.7 billion upfront reported for full year 2011). We note that the HBM Report does not include certain categories of transactions (such as diagnostics companies and reverse mergers) which are counted by Dow Jones, which may partially account for the differences in number of deals.
In private company medical device sector M&A, Dow Jones reported 8 medical device acquisitions of U.S. venture-backed companies during 1H 2012, a slight decrease from the 10 acquisitions reported in 1H 2011. Other industry reports indicate that the number of deals for 1H 2012 remained on par with 2011, but dollar volume was lower.
Four of the ten largest acquisitions of U.S. venture backed companies reported by Dow Jones during 1H 2012 involved life science companies, including Avila Therapeutics (acquired by Celgene in March 2012), KAI Pharmaceuticals (acquired by Amgen in May 2012), and BARRX Medical and superDimension (acquired by Covidien in January 2012 and May 2012, respectively).
Initial Public Offerings
- Life science IPO activity during 1H 2012 was in line with 1H 2011 and represented an improvement over the slower 2H 2011 period.
- Life science IPO activity was stronger during the first quarter of 2012, falling off somewhat during the second quarter. This pattern matched the quarter to quarter pattern for the overall IPO market for venture-backed companies, measured across all industries.
Dow Jones reported that 6 U.S. venture-backed life science
companies (all in the biopharmaceutical sector) went public in 1H
2012, even with 6 life science IPOs (all in the biopharmaceutical
sector) during 1H 2011 and 4 life science IPOs
(two biopharmaceutical and two medical device) during 2H 2011.
Similarly, Thompson/NVCA reported that 7 U.S. venture-backed life science companies went public in 1H 2012, in comparison to 9 life science IPOs during 1H 2011 and 4 during 2H 2011. Note, however, that the Thompson/NVCA numbers include results for healthcare services companies (which are included together with medical device companies), which may partially account for the difference with Dow Jones results.
For comparison, the IPO market for venture-backed companies, measured across all industry sectors, was relatively strong during the first quarter of 2012 (with a total of 20 venture-backed IPOs reported by Dow Jones, the highest number since Q4 of 2007). The number of venture-backed IPOs fell off during the second quarter of 2012, with the exception of the record-setting Facebook IPO during May.
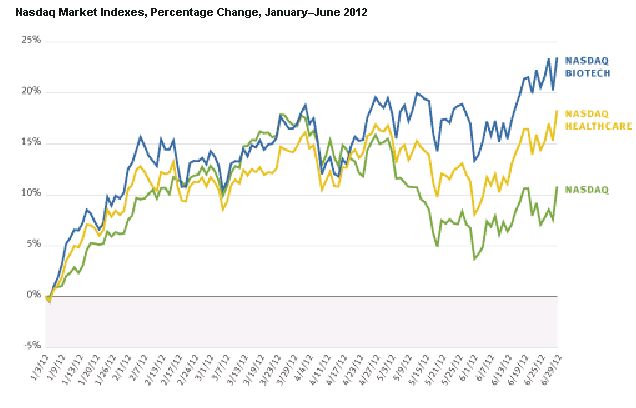
Nasdaq
In the Nasdaq public markets, life science stocks out-performed the broader market index during 1H 2012. The Nasdaq Composite (IXIC) increased 10.8% during 1H 2012. In comparison, the Nasdaq Biotech Index (NBI) increased 23.5% during 1H 2012, and the broader Nasdaq Healthcare Index (IXHC) increased 18.3%.
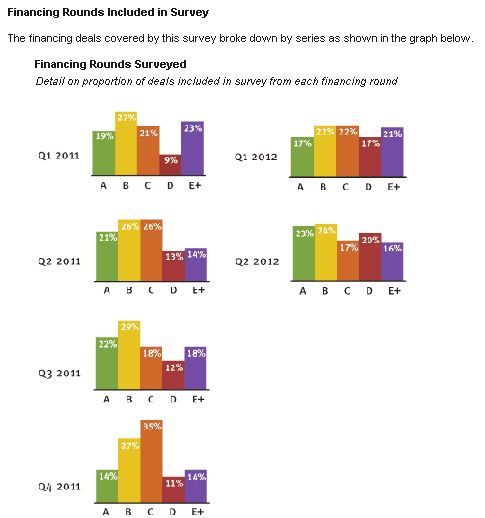
DETAILED FENWICK & WEST RESULTS
Valuation - Direction of Price Change
Up rounds outpaced down rounds during 1H 2012, with a substantial number of flat rounds in each quarter. This is similar to the pattern from our 2011 results, although the ratio of up rounds to down rounds has increased slightly over 2011 averages. The results from 1H 2012 are a clear improvement over 2009/2010 life science results from our Silicon Valley Survey, which show several quarters in which down rounds exceeded up rounds.
Results from this survey and our earlier Silicon Valley surveys indicate that flat rounds occur more often in life science deals, as compared to other industry sectors. This is likely due to the higher percentage of life science financings that are "inside led" (i.e. where funding is provided entirely by existing investors, without a new outside party setting the valuation).
Direction of Price Change
Percentage of deals in which the direction of price change was up, down or flat
Valuation - Magnitude of Price Change (Barometer)
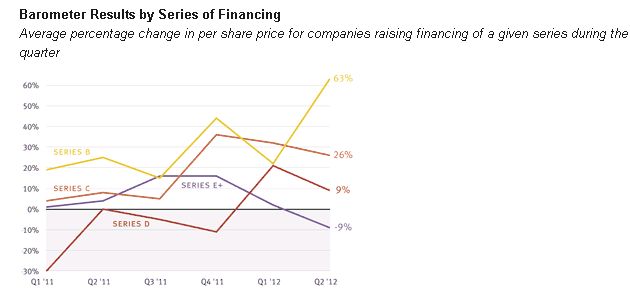
The Fenwick & West Life Science Venture Capital Barometer") it showed average round-to-round price increases of 19% for Q1 of 2012 and 26% for Q2 of 2012, which represents an improvement over results from Q1 and Q2 of 2011. Barometer results for Series B financings were noticeably higher during Q2 of 2012 at 63%.
Overall Barometer results have trended modestly upward in comparison to 2009/2010 levels, with the four quarter moving average as of Q2 of 2012 rising to 21%. (For an explanation of how the Barometer is calculated, see "Notes on Methodology" at the end of this survey.)
The graph immediately below shows the average percentage change between the price per share at which companies raised funds in a given period, compared to the price per share at which such companies raised funds in their prior round of financing, which is a calculation we refer to as the Fenwick & West Life Science Venture Capital Barometer. Subsequent graphs show a four-quarter moving average of Barometer results and results by series of financing.
Fenwick & West Life Science Venture Capital Barometer")
Average percentage change in per share price for companies raising financing during the quarter
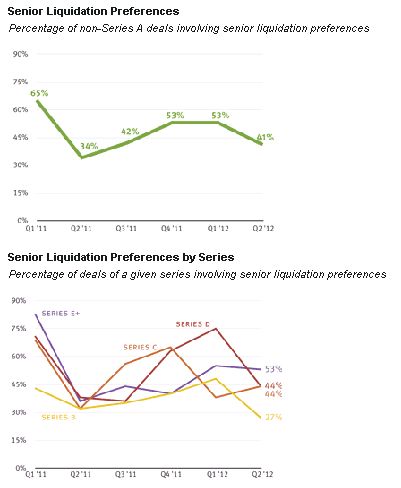
Terms - Liquidation Preference
Senior liquidation preferences appear in a substantial portion of life science deals, and are more frequent in later rounds of financing. Participation rights are also common, appearing in an average of 65% of life science deals during 1H 2012, and uncapped in an average of 64% of the deals in which they are used.
The following graphs show the percentage of deals in which senior liquidation preferences were used, both overall and by series of financing.
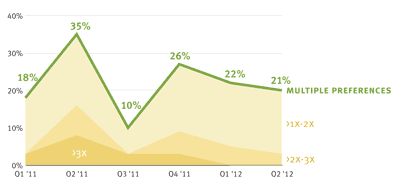
The following graph shows the percentage of deals involving
senior liquidation preferences in which the preference was greater
than the investors' purchase price (i.e., involving multiple
preferences). The color bands indicate the proportion of multiple
liquidation preference deals in which the total preference was
1-2x, 2-3x or greater than 3x the investors' purchase
price.
Multiple Preferences
Percentage of senior liquidation preference deals involving multiple preferences
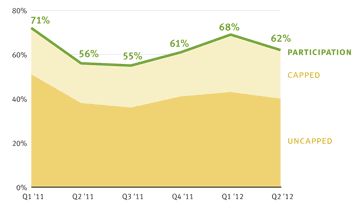
The following graph shows the percentage of deals involving participation rights. The color bands indicate the proportion of participation right deals in which the participation rights were capped (i.e., limited to a specific multiple of liquidation preferences or other amount) and uncapped.
Participation Rights in Liquidation
Percentage of deals involving participation rights
Terms - Pay-to-Play Provisions
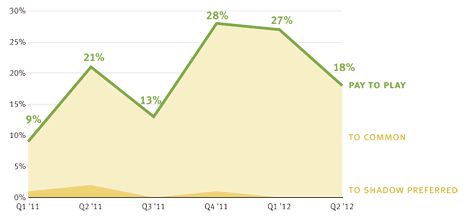
Pay-to-play provisions appeared in an average of 23% of life science deals during 1H 2012. All pay-to-play provisions included in the 1H 2012 results provided for conversion to common stock, as opposed to a shadow series of preferred stock.
The following graph shows the percentage of deals involving pay-to-play provisions. The color bands indicate the proportion of pay-to-play provisions that involve conversion to common stock and shadow preferred stock.
Pay-to-Play Provisions
Percentage of deals involving pay-to-play provisions
Terms - Other Provisions
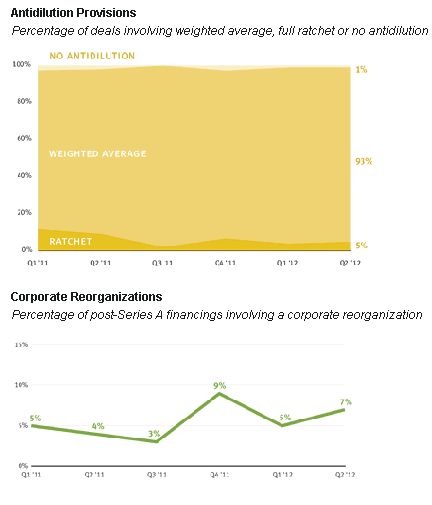
Cumulative dividends and redemption rights appeared in an average of 33% and 42%, respectively, of life science deals during 1H 2012. Anti-dilution provisions were predominantly weighted average.
Cumulative Dividends
Percentage of deals involving cumulative dividends

Terms - Regional and Industry Variations
In comparing results from our 1H 2012 nationwide life sciences survey to the corresponding results from our quarterly Silicon Valley surveys, we observed several notable variations in the frequency of certain financing terms.
In particular,
- Senior liquidation preferences and pay-to-play provisions are significantly more common in life sciences deals as compared to non-life sciences deals. This is consistent with the fact that, in comparison to other industries, life science companies typically need to raise more capital over longer periods of time.
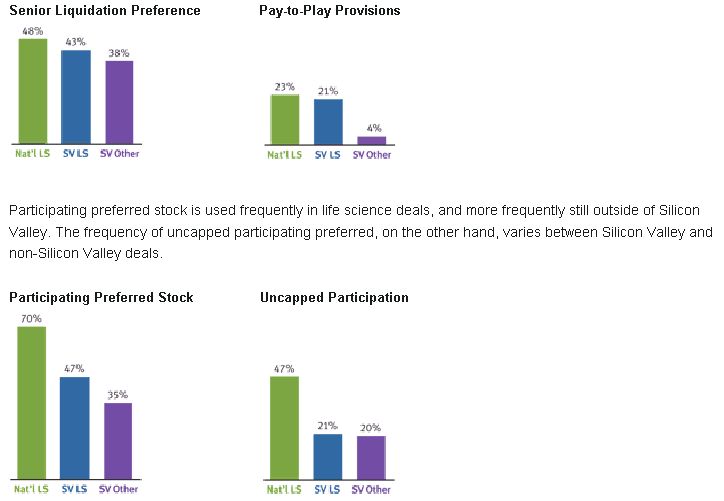
- Cumulative dividends and redemption rights are significantly more common outside of Silicon Valley, but within Silicon Valley are no more common in life sciences deals than in other industries.
The graphs above compare the frequency of various deal terms between (1) nationwide life science deals, not including deals from Silicon Valley, (2) Silicon Valley life science deals, and (3) Silicon Valley deals for industries other than life sciences. The percentages in the graphs above represent the average frequency of a particular term across all 1H 2012 results.
Notes on Methodology
For purposes of this survey, we use the term "life sciences" to refer to companies operating in the traditionally FDA-regulated biopharmaceutical and medical device sectors. We recognize that companies operating in adjacent sectors such as healthcare IT or biofuel production also comprise part of the life sciences industry, broadly defined. But because companies in these sectors are subject to different regulatory requirements and business conditions, and often are funded by venture capital firms that do not participate in the biopharmaceutical and medical device sectors, we have elected to exclude these companies from the survey to provide more comparable and relevant results.
The Fenwick & West Life Science Venture Capital Barometer⢠measures the average percentage change between the price per share at which companies raised funds in a given period, compared to the price per share at which such companies raised funds in their prior round of financing. In calculating the average, all rounds (up, down and flat) are included, and results are not weighted for the amount raised in a financing. When interpreting the Barometer results please bear in mind that the results reflect the average price increase of companies raising money in a given quarter compared to their prior round of financing, which was in general 12-18 months prior. Given that venture capitalists (and their investors) generally look for at least a 20% IRR to justify the risk that they are taking, and that by definition we are not taking into account those companies that were unable to raise a new financing (and that likely resulted in a loss to investors), a Barometer increase in the 30-40% range should be considered normal.
The content of this article is intended to provide a general guide to the subject matter. Specialist advice should be sought about your specific circumstances.