
- within Employment and HR topic(s)
US MARKET REVIEW AND OUTLOOK
Market Review
In 2011, the venture capital market produced its heaviest deal flow in a decade, with total proceeds that rivaled the levels of 2007 and 2008, despite lingering economic uncertainty and poor capital market conditions in the late summer and early fall. Liquidity performance was also impressive, with a steady stream of VC-backed IPOs and the highest median acquisition price in VC-backed M&A transactions since the peak of the dot-com boom in 2000.
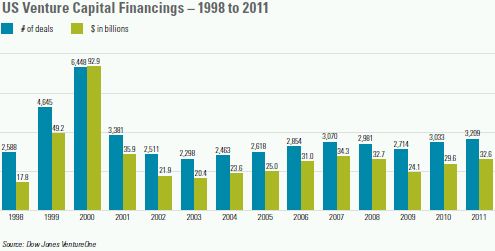
There were 3,209 reported venture capital financings raising total proceeds of $32.6 billion in 2011, compared to 3,033 financings that raised $29.6 billion in 2010. The number of financings in 2011 was the highest since 2001, when 3,381 deals were reported. Deal volumes were fairly level throughout 2011, producing quarterly totals of 754, 835, 817 and 803 transactions. Total proceeds in 2011 were nearly as high as the amounts raised in 2007 and 2008, before the global economic recession that curtailed investment activity. Once all transactions have been reported, financing proceeds in 2011 are likely to represent the largest annual tally since 2001.
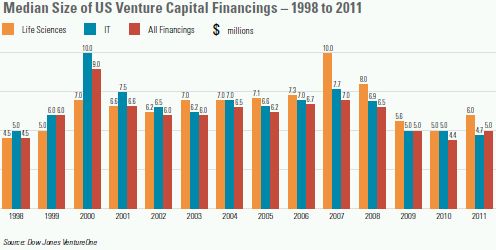
The median size of all venture capital financings increased from $4.4 million in 2010 to $5.0 million in 2011, reversing three consecutive annual declines, although the median financing size in 2011 was still lower than the figure for each year in the period from 1999 to 2008. The median financing size for life sciences companies increased from $5.0 million in 2010 to $6.0 million in 2011, its highest level since 2008. For information technology companies, the median financing size declined again, from $5.0 million to $4.7 million, representing the lowest median financing size since at least 1998. The steady decline in the median financing size for information technology companies partly reflects the ability of many technology companies to commence operations with lower levels of funding than historically required, due to various technological advances.
Amid strong competition for attractive deals, valuations of venture-backed companies increased sharply from 2010 to 2011. The median pre-money valuation for all venture financings was $21.0 million in 2011—the highest figure since 2000—compared to $17.0 million in 2010. Among life sciences companies, the median pre-money valuation nearly doubled, increasing from $13.1 million in 2010 to $24.8 million in 2011. Information technology companies saw a more modest increase in median pre-money valuation, from $11.2 million to $15.0 million.
Seed and first-round venture capital financings accounted for 42% of the total number of venture financings in 2011 (compared to 37% in 2010) and 18% of the total amount of venture capital investment (unchanged from the level in 2010). Seed and first-round financings have constituted between 29% and 42% of the total number of all venture financings in each year since 2001. The proportion of seed and first-round investing activity over the past decade, however, is significantly lower than the proportion prior to 2001. The increase in early-stage investing in 2011 reflects a reduction in the average time from initial funding to a liquidity event—which decreases the amount of money needed for investment in later-stage companies—as well as lower barriers to entry in certain technology sectors, resulting in an increase in the number of companies being formed and funded.
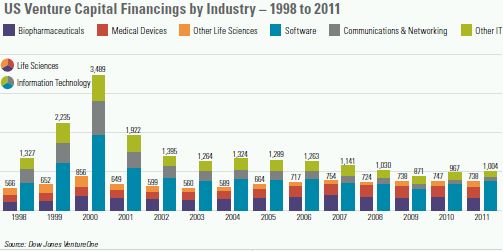
Venture capital investing by industry sector in 2011 was largely consistent with longer-term trends. Information technology companies represented 31% of all venture capital financings in 2011 (compared to 32% in 2010), while life sciences companies constituted 23% in 2011 (compared to 25% in 2010). In 2011, for the third consecutive year, the amount invested in life sciences companies ($8.4 billion) exceeded the amount invested in information technology companies ($7.9 billion).
The geographic breakdown for venture capital investing has remained fairly constant since 1996 (the first year for which this data is available). California— which has led the country in this regard in each year since 1996—accounted for 42% of all venture financings in 2011 (1,344 financings). Massachusetts, home to 10% of the companies receiving venture financing in 2011 (332 financings), again finished second in this category, as it has in each year since 1996, narrowly edging out New York, also with a 10% market share (317 financings). Texas (143 financings) and Pennsylvania (124 financings) rounded out the top five positions for 2011, concluding a repetition of the state rankings from 2010.
The IPO market remained receptive to VC-backed companies in 2011, continuing the recovery that began in 2010 after VC-backed IPOs all but disappeared for most of 2008 and 2009. In 2011, a total of 42 US venture-backed companies went public in the United States, down just one from the 43 in 2010. The largest VC-backed IPO of 2011 was the $1.0 billion offering by Zynga, followed by Groupon's $700 million IPO. The median amount of time from initial funding to an IPO was 6.5 years in 2011, down from 8.1 years in 2010 and the lowest since the 5.6-year median recorded in 2005.

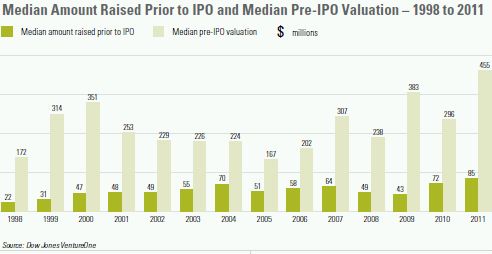
The ratio of pre-IPO valuations to the median amount raised prior to IPO by venture-backed companies going public increased to 5.4:1 in 2011 from 4.1:1 in 2010—the second-highest level since 2000 (a higher ratio means higher returns to pre-IPO investors). This ratio was between 3.1:1 and 5.3:1 for each year from 2001 to 2008. In contrast, this ratio ranged from 7.7:1 to 10.0:1 from 1997 to 2000, due to very large pre-IPO valuations by younger companies, and spiked temporarily to 8.9:1 in 2009 based on a very small sample size of VC-backed IPOs that year.
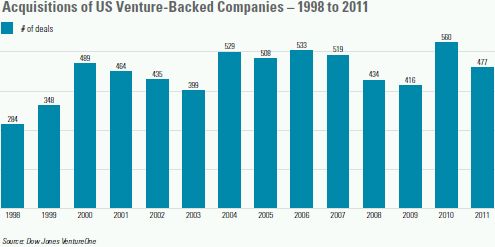
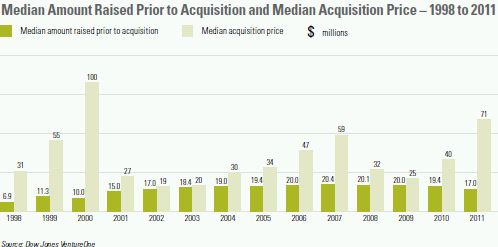
The M&A market for venture-backed companies was favorable in 2011. Although the number of reported acquisitions of VC-backed companies declined from 560 in 2010 to 477 in 2011, purchase prices jumped, fueled by the availability of large cash balances by strategic buyers. The median acquisition price for venture-backed companies soared to $71 million in 2011 from $40 million in 2010. The median amount of time from initial funding to acquisition dipped to 5.3 years in 2011 from 5.4 years in the prior year—continuing a four-year trend of annual declines. With a shorter timeline to liquidity, the median amount raised prior to acquisition also declined in 2011—dropping from $19.4 million to $17.0 million.
The largest VC-backed company acquisition of 2011 was Plexxikon's acquisition by Daiichi Sankyo for $805 million (plus milestone payments of up to $130 million), followed by Ardian's acquisition by Medtronic for $800 million (plus milestone payments based on annual revenue growth). There were a total of 14 VC-backed company acquisitions for at least $500 million in 2011, compared to eight in the prior year.

The ratio of median acquisition price to median amount raised prior to acquisition was 4.2:1 in 2011, compared to 2.1:1 in 2010 and 1.3:1 in 2009 (a higher ratio means higher returns to pre-acquisition investors). The spike in this ratio in 2011 reflected the combination of very strong valuations and shorter time periods to acquisition. The 2011 ratio was the highest since the stratospheric ratio of 10.0:1 in 2000 at the height of the dot-com craze, when young companies routinely were acquired for outsized prices.
The above comparison of the ratios of valuations to the financing amounts required to achieve liquidity events indicates that returns to venture capital investors remain higher on IPOs than on M&A transactions. The higher valuations ascribed to IPO companies are offset, in part, by the fact that the median amount raised prior to liquidity event for M&A companies ($17.0 million in 2011) is generally much lower than the amount for IPO companies ($85.0 million in 2011), and the longer timelines from initial funding to liquidity for IPO companies (6.5 years in 2011) than for M&A companies (5.3 years in 2011). Moreover, venture investors generally achieve liquidity more rapidly in an M&A transaction (which frequently yields the bulk of the purchase price in cash at closing) than in an IPO (which generally involves a post-IPO lockup period of 180 days and market uncertainty on the timing and prices of subsequent sales).
The ratio of M&A transactions to IPOs for venture-backed companies was 11:1 in 2011 and 13:1 in 2010. Compared to the preceding two years, when this ratio was approximately five times higher, the results for 2010 and 2011 are close to historical norms. The M&A/IPO ratio for VC-backed exits was 10:1 during the period 2004–2007, 19:1 during the period 2001–2003, and less than 3:1 during the Internet boom of 1998–2000.
Outlook
The outlook for the venture capital market over the coming year is generally positive. Early results for 2012 bear out this optimism, although economic concerns and the continuing sovereign debt crisis in Europe could dampen expectations.
In the first quarter of 2012, venture capital investing was largely consistent with the comparable period of the prior year and overall trends in the marketplace, while liquidity outcomes improved further from the already positive results of 2011.
Approximately $6.3 billion was invested in 717 reported venture capital financings in the first quarter of 2012. These totals were lower than the reported amounts for the corresponding period of 2011, although the number of financings in the first quarter of 2012 should approach the prior year's figure once all financings have been reported. Final proceeds for the first quarter of 2012 will likely fall short of the corresponding figure from the first quarter of 2011, but the prior year's results were inflated by several extremely large financings by mature private companies.
The overall number of IPOs by venture-backed companies increased from 11 in the first quarter of 2011 to 20 in the first quarter of 2012, including prominent IPOs by several well-known companies. In May 2012, Facebook produced the largest VC-backed IPO in history— with $16.0 billion in proceeds.
Reported acquisition activity declined from 139 deals in the first quarter of 2011 to 94 deals in the first quarter of 2012, although delayed reporting probably explains much of the decrease in volume. The average acquisition price more than doubled, however, from $92 million to nearly $193 million, underscoring the willingness of strategic buyers to pay large amounts for attractive targets. The largest transaction of the first quarter of 2012 was the acquisition of Liberty Dialysis by Fresenius Medical Care for $1.7 billion. Subsequently, Facebook announced an agreement to acquire Instagram for $1 billon.
The level of venture capital financing activity over the balance of 2012 will be significantly affected by general economic conditions, investor confidence and the health of the IPO market for VC-backed companies.
Investor interest in the consumer Internet sector should remain strong, although valuations may undergo a correction from the recent levels that at times have seemed reminiscent of the dot-com era. Valuations in other sectors could also come under pressure if conditions in the economy at large and in the capital markets worsen.
The clean technology and renewable energy sector should benefit from heightened environmental awareness, the availability of government funding, and the long-term trend in rising energy prices. Problems with distribution, larger numbers of competing technologies, and the need in many cases for significantly larger investment amounts than in traditional VC-backed industries may cause some investors to approach this market cautiously.
Ongoing globalization in venture investing is likely to continue. International markets such as China, India and parts of Southeast Asia, as well as portions of Eastern Europe and South America, are spawning increased entrepreneurial activity and innovation, and the regulatory environments in those countries are also becoming more hospitable to foreign investment.
The liquidity outlook for VC-backed companies remains bright. On the heels of a very good IPO market for venture-backed companies in the preceding two years, deal flow picked up in the first quarter of 2012. In addition, the JOBS Act, enacted in early April, should encourage additional VC-backed companies to join an already robust pipeline of IPO candidates.
Prospects for the M&A market also appear promising. Strategic acquirers have excess cash to deploy, and the existence of a credible IPO alternative enhances the leverage of venture-backed companies in negotiating acquisition prices. Both the IPO and M&A markets could soften if the economy stagnates or extreme volatility returns to the capital markets.
REGIONAL MARKET REVIEW AND OUTLOOK
California
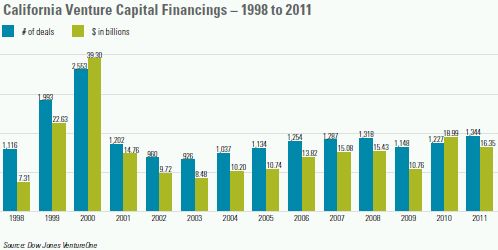
California companies reported 1,344 financings in 2011, up 10% from the 1,227 financings in 2010. After soaring to nearly $19 billion in 2010, proceeds declined 14% to $16.35 billion—still the second-highest total since 2000. Liquidity outcomes for California VC-backed companies were generally strong in 2011.
Roughly four times the size of the next-largest venture capital market in the United States, California was responsible for 42% of the nation's financing transactions in 2011. The year's deal tally was the largest ever achieved in
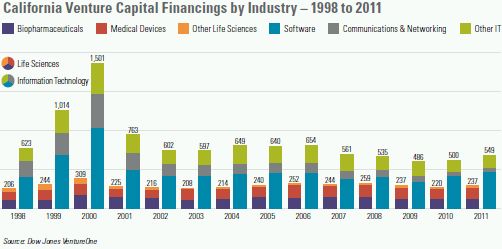
California, other than during the peak of the dot-com boom—in 2000, California produced a staggering 2,553 financings, with nearly $40 billion in proceeds. California's venture capital market spans all industry sectors, with particular strengths in consumer Internet, information technology, life sciences, cleantech, consumer retail and media/ entertainment. With a 41% market share, information technology was the largest sector in the state in 2011, followed by life sciences at 18%. California's best-known VC-backed companies are, of course, in social media.
The state generated 22 IPOs by VC-backed companies in 2011, compared to 19 in 2010. The number of reported acquisitions of California VC-backed companies declined from 274 in 2010 to 228 in 2011, but still surpassed any other year on record. In 2011, California produced three of the country's five largest VC-backed IPOs and the two largest venture-backed company acquisitions.
We expect California to maintain its venture capital leadership in the coming year. Future growth in financing activity and continued strength in liquidity will depend, in part, on general economic conditions, the willingness of strategic buyers to pay attractive premiums, and the overall health of the capital markets. Year-to-date liquidity highlights include Facebook's $16.0 billion IPO, Instagram's proposed acquisition for $1 billion (also by Facebook), and Efficient Frontier's $400 million acquisition by Adobe Systems.
Mid-Atlantic
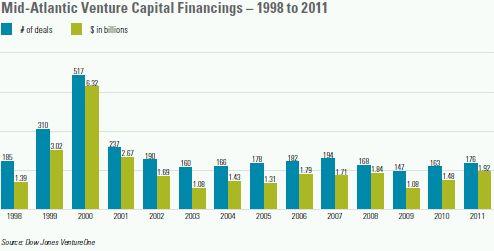
The number of reported venture capital financings in the mid-Atlantic region of Virginia, Maryland, North Carolina, Delaware and the District of Columbia increased 8%, from 163 in 2010 to 176 in 2011, while proceeds jumped 30%, from $1.48 billion to $1.92 billion—the highest level of proceeds since 2001. Although they do not rival the deal activity that prevailed between 1999 and 2001, annual tallies for venture capital financings and proceeds in the mid-Atlantic region remain above the levels seen in the pre-bubble years.
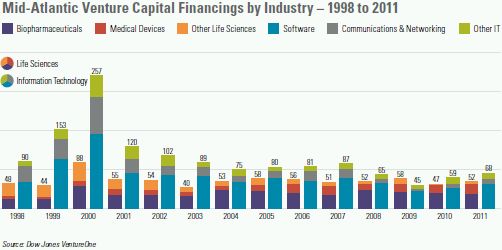
The percentage of all mid-Atlantic financings completed by information technology companies increased from 36% in 2010 to 39% in 2011. The region's life sciences sector—which had outpaced the information technology sector in 2009—saw its market share inch up from 29% to 30%.
After three VC-backed IPOs in 2010, the mid-Atlantic region produced only one IPO in 2011—Tranzyme's $54.0 million offering.
In contrast to the downturn in the region's IPO activity from 2010 to 2011, the number of reported acquisitions of mid-Atlantic VC-backed companies increased from 36 to 50. Virginia continued to lead the region in VC-backed M&A transactions in 2011, with 27 deals, followed by North Carolina with 11 and Maryland with nine. The region's largest M&A transaction of the year was the $650 million acquisition of TARGUSinfo by Neustar, followed in size by Open Text's acquisition of Metastorm for $182 million.
In the coming year, we expect that the mid-Atlantic region will remain a leading investment center for technology and life sciences companies and will spawn additional candidates to pursue IPOs. We also expect the region to continue to produce attractive acquisition candidates. Year-to-date liquidity highlights include BioReliance's acquisition by Sigma- Aldrich for $350 million and Millennial Media's IPO raising $132.6 million.
New England
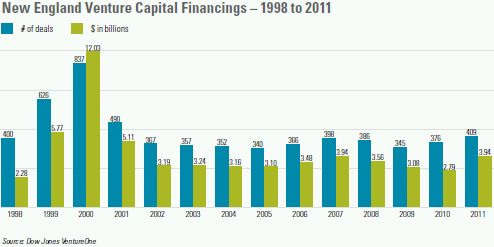
New England companies reported 409 financings in 2011, up 9% from the 376 financings in 2010, while proceeds leapt 41%, from $2.79 billion to $3.94 billion. The number of financings and amount of proceeds were the largest in New England since 2001.
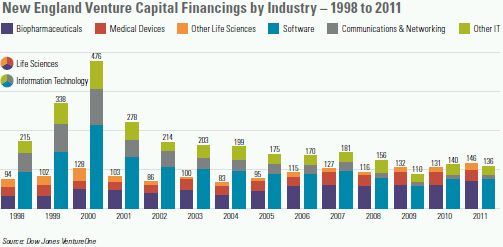
New England continues to be a leading center of activity for technology and life sciences companies. In 2011, the number of financings by life sciences companies edged out the number of financings by information technology companies, as the two sectors swapped places in the rankings again. Information technology companies accounted for 33% of New England's venture capital financings in 2011 (down from 37% in 2010) and life sciences companies contributed 36% of the region's financings (up from 35%).
New England generated four venture-backed IPOs in 2011—from BG Medicine ($35.0 million), Carbonite ($62.5 million), Tangoe ($100.9 million) and Zipcar ($174.3 million)—compared to three IPOs in the prior year.
The number of reported acquisitions of VC-backed companies in New England declined from 82 in 2010 to 73 in 2011— still the second-highest figure since 2007. The region produced three of the nation's 10 largest deals of 2011: the acquisition of Advanced BioHealing by Shire for $750 million, the acquisition of ITA Software by Google for $700 million, and the acquisition of Salient Surgical Technologies for $525 million by Medtronic. In addition, BioVex Group was acquired in 2011 by Amgen for $1 billion (including potential milestone payments).
We expect New England—and Massachusetts in particular—to remain one of the country's most appealing environments for emerging companies and a hub of venture capital and IPO activity during the coming year. Year-to-date liquidity highlights include the acquisition of Kiva Systems by Amazon.com for $775 million and the IPOs of Demandware ($101.2 million), Merrimack Pharmaceuticals ($105.3 million) and Verastem ($63.3 million).
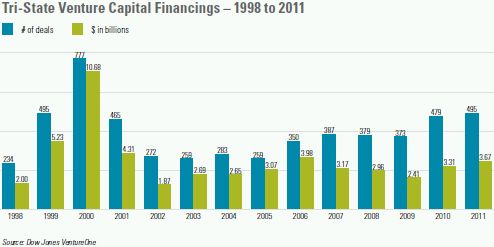
Tri-State
The number of reported venture capital financings in the tri-state region of New York, New Jersey and Pennsylvania increased from 479 in 2010 to 495 in 2011—the region's highest annual tally since 2000—while proceeds rose from $3.31 billion to $3.67 billion. New York led the region's financing activity, with 317 financings—once again just behind Massachusetts in the state rankings. Underscoring the pronounced shifts in tri-state investments over the past decade, between 2001 and 2011, the number of financings in New York increased by 45%, while deal flow was relatively constant in Pennsylvania and dropped by more than half in New Jersey.
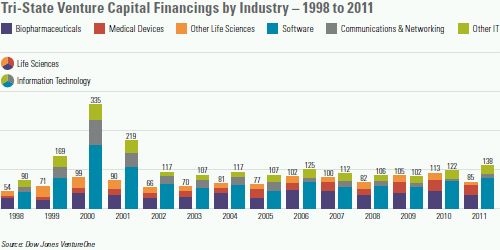
Information technology companies garnered the largest share of the tri-state region's VC financing market in 2011, with 28% of the region's financings, up from 25% in 2010. Life sciences companies, after leading the tri-state region's rankings in 2009, accounted for only 17% of the region's financings in 2011, down from 24% in the prior year.
After generating a robust total of eight VC-backed IPOs in 2010, the tri-state region had one solitary IPO in 2011—the $42.0 million offering of Pacira Pharmaceuticals—as exit activity shifted toward acquisitions.
Reported acquisitions of venture-backed companies in the tri-state region increased 9%, from 89 in 2010 to 97 in 2011, on the heels of the doubling of VC-backed company M&A activity from 2010 to 2011. The region's largest deal of 2011 was the acquisition of Quidsi by Amazon.com for $545 million.
We believe that, over the coming year, the tri-state region's strengths in the life sciences and information technology industries—particularly in the consumer Internet space—will continue to foster a favorable environment for VC-backed startup companies and produce viable IPO and acquisition candidates. Year-to-date liquidity highlights include the IPOs of EPAM Systems ($72.0 million) and FX Alliance ($62.4 million).
To read the rest of this Report, please click here.
The content of this article is intended to provide a general guide to the subject matter. Specialist advice should be sought about your specific circumstances.