
INTRODUCTION
Since 2007, the losses and write-downs resulting from the credit crisis have reached over $2 trillion worldwide.2 As the losses have mounted, securities litigation has followed and over 450 related securities cases, both class actions and others, have been filed. The litigation has covered a wide array of products ranging from mortgage loans to securities such as mortgage-backed securities (MBS), asset-backed securities (ABS), and structured finance collateralized debt obligations (CDOs), whose cash flows are backed by the principal and interest payments of loans. In addition, many disputes and regulatory investigations have centered on a particular type of CDO known as a synthetic CDO. A synthetic CDO "is the application of a CDS to a pool of reference credits. For example, the pool of reference credits could be tied to loans or to structured finance securities that reside on the sponsor's balance sheet (a synthetic balance-sheet transaction). Or the pool of reference credits could be tied to a defined group of corporations (typically an arbitrage transaction)."3 Of particular interest to the litigation are a set of credit default swaps (CDS), or credit derivatives, known as the ABX indices (ABX).
Plaintiffs have cited the ABX indices in a variety of credit crisis cases, where they allege that the ABX indices should have been used as market indicators to mark subprime-related securities including MBS and CDOs, to foresee additional losses on subprime investments, and to revise loan loss reserves. In addition, the ABX indices have been cited in various court decisions.
In this article, we focus on the ABX indices, explain their economic functions, and explore how these indices are currently used in related litigation. The ABX indices reflect important information for market participants, but a full understanding of the economics behind the indices is critical. Simple arguments and approaches about how the ABX indices should be used are bound to be flawed. The indices are meant as a publicly available measure of investors' perception of the subprime market and their expectations about the underlying mortgage collateral. But as the crisis unfolded and liquidity declined and even disappeared at various points—from all markets, not just the subprime market—the prices of the ABX indices reflected more than an expected increase in default risk on the underlying mortgages; they also reflected the increased perception of risk, lack of liquidity, increased uncertainty, and significant changes in the macroeconomic environment. Current academic literature reflects the difficulties in deciphering the changes in ABX prices and highlights the importance of careful analysis of the components of these indices to ensure that they are used appropriately in valuations and other purposes.
We start with a brief introduction about the non-agency mortgage market, the CDS market, and how CDS became a mechanism through which to participate in the non-agency mortgage market. We then focus on a specific type of CDS, the ABX indices, and how they are administered, priced, and traded. Then, we discuss the allegations and decisions involving the ABX. Finally, we assess the current academic literature that analyzes the role of the ABX derivatives in the liquidity and valuation of securities that are backed by subprime mortgages.
Overview of the Non-agency Mortgage Market, Issuance Volume, and Loan Characteristics
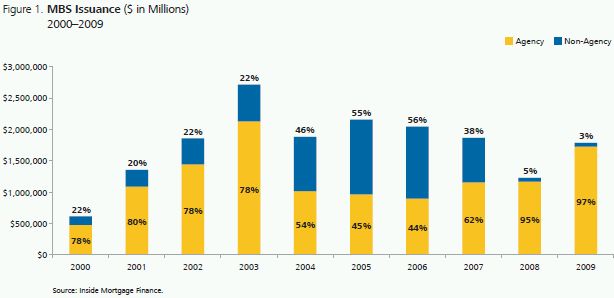
The mortgage market is largely segmented into two sectors, agency and non-agency. The agency market is composed of MBS issued or guaranteed by a government agency, such as Ginnie Mae, or a government-sponsored entity, such as Fannie Mae or Freddie Mac. One of the key characteristics of the agency market is that the credit risk associated with the MBS (subject to reps and warranties) is held by the agency itself, not by the underwriter or investor. The non-agency market is comprised of MBS that are not issued or guaranteed by the various agencies discussed here. Most notably for our purposes, investors in the non-agency market are exposed to the credit risk associated with homeowners' defaults and failures to make timely mortgage payments. As a result, many investors have sought methods to sell or share this risk with the market.
Prior to the crisis, the non-agency market grew rapidly and eventually represented 56% of MBS issuances in 2006, as shown in Figure 1. The non-agency market declined significantly once the crisis ensued; total issuance of MBS nearly rebounded to 2004 levels by 2009 on the strength of the agency market.
Basics of the CDS Market and Differences between Corporate CDS and ABS CDS
Investors in the corporate market can purchase protection against individual names (companies) using CDS contracts. A CDS is a bilateral contract whereby the protection buyer pays a premium to a protection seller as a kind of insurance against the default of an underlying entity. Neither the protection buyer nor the protection seller needs to hold any of the securities issued by the underlying entity. Contracts in this market have a few key elements:
- Reference entity (the entity whose bond is being insured)
- Calculation agent (usually the dealer)
- Credit events: These are the events that lead to payment obligations. These include bankruptcy, failure to pay and financial restructuring for most US and European investment-grade debt. CDS on high-yield debt often include only bankruptcy and failure to pay as credit events. Events that trigger a payout are typically based on publicly available information only.
- Deliverable obligations: These often include requirements that the debt be a non-subordinated bond or a loan with a maturity of less than 30 years. It is also typically required that the debt be denominated in a major currency and be free of transfer restrictions other than 144A.
Growth in the non-agency market generated interest among investors in mechanisms that would track the performance of the market (and subsets of this market) and enable investors to trade exposures to the non-agency mortgage market without holding cash bonds. Markit,4 a global financial information services company, sought to provide these capacities through the creation and administration of the ABX indices.
What are the ABX Indices?
The ABX.HE (home equity asset-backed securities) indices are "a series of equally weighted, static portfolios of asset-backed CDSs referencing 20 HEL MBS transactions" (Fender and Scheicher, 2009). The indices were meant to be used as a benchmark for the performance of subprime MBS. Each index is composed of CDS on tranches of 20 of the largest subprime ABS for the relevant time period.5 The reference subprime ABS, in practice, are said to reflect the subprime originations over the period in terms of the characteristics of the loans and credit performance. The function of the ABX indices was to provide a means for investors to gauge market sentiments around the asset class and to take short and long positions accordingly.
As explained by Markit, the deals in each index would have been issued within the six months prior to the release of the index and the deals must include one-month LIBOR-based floating rate tranches with ratings of AAA, AA, A, BBB, and BBB-.6 The original deal size (of all bond tranches issued by a specific ABS issuer) must be at least $500 million and the original weighted average FICO credit score cannot exceed 660. The deals each have an equal weight of 5%.
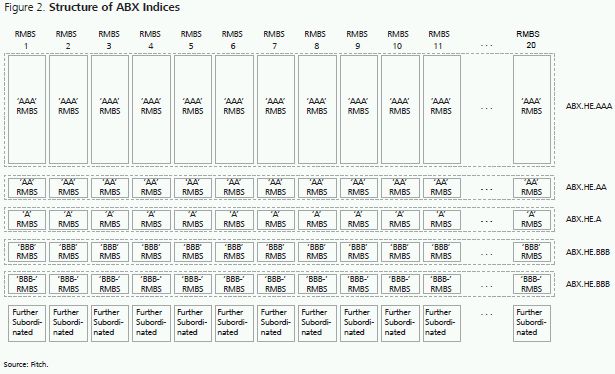
The first set of the indices were the ABX 2006-1 indices. The indices started trading in January 2006 and represented deals that were issued in the second half of 2005. Markit originally planned for the indices to roll semi-annually in January and July of each calendar year. However, due to the limited issuance of subprime deals in the second half of 2007, the 2008-1 indices did not roll and no indices have rolled since. The existing indices are the 2006-1, 2006-2, 2007-1 and 2007-2 indices and they span deals from the second half of 2005 to the first half of 2007. The indices within each vintage are separated according to the credit ratings of the different tranches of the 20 deals. So, the 2007-1 AAA Index will represent CDS on the AAA-rated tranches of the 20 underlying deals while the 2007-1 BBB Index will represent the BBB-rated tranches of those same 20 deals. The licensed dealers are Bank of America, Barclays, Citigroup, Credit Suisse, Deutsche Bank, Goldman Sachs, JP Morgan, Morgan Stanley, Nomura, Royal Bank of Scotland, UBS, and Wachovia. See Figure 2 for an illustration of the structure of the ABX.HE indices.
The Pricing and Trading of ABX CDS7
An investor who buys protection using a CDS referencing the ABX will get compensated when the index declines. This investor is said to be shorting the index and the protection seller is said to be long the index. As Inger and Scheicher (2008) explain,8 the prices of the ABX indices are determined by the two payment legs. The protection buyer pays the fixed leg that is based on the index coupon. The protection seller, as the floating leg, makes conditional payments that depend on actual principal write-downs, principal shortfalls, and interest shortfalls as determined by Markit.
Pricing of an ABX CDS depends on the present value of the expected coupon cash flows and the present value of the expected write-downs. If the market (meaning those submitting indicative prices to Markit) expects write-downs to increase, for example, then the value of the ABX would decline, all else being equal. Other factors, such as the expectations of counterparty risks, have an impact on the indications that market participants provide to Markit.
Markit posts closing index levels daily for the ABX indices. Markit solicits closing mid-market prices for transactions from the dealers, removes the top and bottom quartiles, and calculates the arithmetic mean of the remaining values. The ABX levels published by Markit reflect an average of various dealers' estimations (and transaction values when available) of the index. The prices submitted by dealers can vary substantially and there are no guarantees that anyone has actually traded at the published index level (i.e., these are not exchange prices).
Goodman et al. (2008) provides details of the ABX trading mechanism. At the inception of a trade, if the price of the index is not equal to 100, then there must be an upfront payment. This is due to the fixed coupon for the ABX indices. If the price of the index is below 100, then the protection buyer pays the protection seller an upfront payment amount equal to (100-index level)/100 times the notional amount of the trade times the "factor." The factor is the portion of the original balance of the deals that is currently outstanding. If the index is above 100, then the protection seller will pay the protection buyer. Also, at inception, the protection seller would pay the protection buyer the accrued premium from the end of the last accrual period until the effective trade date.
Once a trade takes place, cash flows are exchanged on a monthly basis. The protection buyer would pay the coupon, based on the notional amount and factor, to the protection seller. As the mortgage loans amortize and the outstanding principal of the tranche declines, the effective size of the notional amount would decrease, via a decrease in the factor, and the size of the coupon would also decrease. The protection seller will pay the protection buyer in case of interest shortfalls, principal shortfalls, and write-downs. If there are reimbursements regarding shortfalls, the protection buyer must pay them back to the protection seller. ABX CDS do not allow for physical settlements and all payments are pay-as-you-go. Distressed rating downgrades are not considered a condition of default.
At the termination of a trade, if the price of the index is not equal to 100, then there must also be a closing payment. If the price of the index is below 100, then the protection seller pays the protection buyer, and vice-versa. The closing payment amount would be equal to (100-index level)/100 times the notional amount times the factor.
Valuation Models
There are several approaches to valuing the ABX indices.9 The valuation approaches discussed below are used to estimate a hypothetical value of the index based on a credit assessment. That is, the valuations may not reflect the actual index values at a given time and will vary significantly based on model assumptions and inputs as well as liquidity and other technical factors. One approach is an econometric approach using regression models to forecast expected future cash flows for each of the 20 subprime ABS deals in an ABX index. This approach requires running regressions models to estimate conditional prepayments, delinquencies, defaults, and severity. Another approach is simpler but still involves several steps. It starts with estimating the cumulative losses for each subprime ABS using the current delinquency pipeline, estimating the level of cumulative losses needed to cause the first dollar loss on each referenced ABS, determining whether the ABS will be written down or not by comparing the cumulative loss forecast with the cumulative loss needed to cause the first dollar of loss, and finally aggregating the number and timing of the bonds written down out of the 20 ABS referenced by each particular ABX index.10
ALLEGATIONS IN THE CREDIT CRISIS CASES THAT ARE RELATED TO THE ABX INDICES
The ABX indices have been cited in many credit crisis securities complaints and were used as the basis for different types of allegations against financial institutions such as issuers, underwriters, and lenders.
The ABX and the Valuation of Subprime-related Securities
In one set of allegations, the ABX is used by plaintiffs to dispute the valuation of subprime-related securities. The allegations relate to the timing of write-downs. In these types of cases, the plaintiffs usually assert that the ABX represented an observable measure or indicator of an asset's value, namely subprime-related ABS, CDOs, and even CDS where the reference entity is subprime-related. Plaintiffs claim that the defendants should have marked down the value of their assets in line with declines in the value of the ABX, but failed to do so, which led to inflated asset values and allegedly caused damages to the plaintiffs.
For example, CIT Group Inc. Securities Litigation is a class action shareholder suit in which the plaintiffs allege they suffered damages arising from false statements and omissions regarding CIT's subprime home lending and private student lending businesses. Plaintiffs claim that CIT's subprime home loan portfolio should have been marked down in value and impaired in light of "red flags" that included the sharp decline of the ABX from late 2006 to 2007.11
In The California Public Employees' Retirement System v. Richard S. Fuld, Jr., et al., the plaintiff alleges that Lehman Brothers failed to write down its subprime-related assets in a timely fashion and failed to disclose its true financial condition and performance. Specifically, the complaint alleges that Lehman Brothers failed to disclose losses and exposure in connection with its subprime and Alt-A lending activities and the true value of the company's mortgage-related assets.
The complaint notes that Lehman Brothers announced a $7 billion write-down of mortgage-related holdings, mostly in Alt-A holdings, on 10 September 2008.12 The plaintiff alleges that these write-downs did not occur in a timely manner because Lehman Brothers improperly shifted these mortgage assets into Level 3 assets.13 The plaintiff contends that the Alt-A holdings should have been considered Level 2 assets and that market data such as the ABX and CMBX indices were usable for the valuation of these Alt-A holdings.14 Lehman Brothers' valuation of mortgage-related assets, therefore, should have reflected the decline in the ABX during 2007: "As a result, Level 2 assets that had to be valued in relation to market price should have been marked down... By improperly categorizing assets as Level 3 and by using inappropriate models to inflate the reported values of those assets, Lehman reported inflated values for billions of dollars of assets."15
In several other cases, plaintiffs allege that defendants made materially false and misleading statements and omissions of material fact regarding exposure to mortgage-related CDOs. For example, in one case against Citigroup, plaintiffs claim that Citigroup failed to properly calculate the fair value of its CDO assets by treating these holdings as Level 3 assets and ignoring observable market indicators such as the ABX and TABX indices.16 The complaint states:
It cannot be emphasized enough that throughout, the ABX and TABX indexes (the TABX was introduced in February 2007) worked at all times to synthesize the above-discussed fundamental factors (subprime mortgage performance, refinancing opportunities, housing price data) into efficient market valuation of CDOs' primary assets (subprime RMBS tranches, via the ABX) and of Mezzanine CDO tranches (via the TABX). These indexes were, in sum, directly relevant, directly observable market indicators of CDO value.17
Similar claims also appear in a case against the Royal Bank of Scotland, in which the plaintiffs assert that the defendants' CDO holdings should have been written down in light of declines in the ABX and TABX indices. The complaint states:
By August 3, 2007, in response to rising default rates on subprime mortgages and the collapse of several subprime mortgage originators, the ABX indices that were comprised of the very classes of securities held by RBS and which were thus key indicators of the market value of its MBS and CDOs, declined by 19% for high-grade tranches and 46% for mezzanine tranches... Despite these precipitous declines in relevant market indicators, which clearly indicated the need to write down the value of RBS's CDOs and MBSs, the Exchange Act Defendants failed to do so.18
In some of the disputes between investors and investment funds, the plaintiffs claim that the defendants should have recorded reductions in the value of their asset portfolios after the decline in the ABX index in 2007. Plaintiffs claim that the funds disregarded the performance of the ABX in order to keep the funds' NAVs at inflated levels. In a complaint against Bear Stearns Asset Management, Inc., for example, the plaintiff contends that specific funds administered by Bear Stearns Asset Management, Inc. should have reported values that reflected the decline in the ABX index because they had purchased subprime assets. The plaintiff states that the "ABX index is considered by participants in the financial markets to be a fair proxy of the value of subprime-backed securities with similar average lives and characteristics."19 In some instances, the plaintiffs even suggest that the ABX index is a valuation indicator for MBS in general. In a complaint against Morgan Keegan & Company, Inc., plaintiffs state that defendants "recklessly disregarded the ABX.HE Index, which is a default swap index based on subprime mortgages and is widely recognized as a reliable pricing mechanism for mortgage-backed securities."20 As a result, plaintiffs assert that the fund at issue reported NAVs at inflated levels.
The ABX and the Foreseeability of Losses
In addition to allegations of inaccurate valuations, plaintiffs also have used the ABX to support the claim of foreseeability. In Landmen Partners Inc., et al. v. The Blackstone Group L.P., et al., the plaintiffs allege that the Blackstone Group failed to disclose the likelihood of loss of performance fees due to its investment in a monoline insurer. The plaintiffs claim that losses from insuring CDOs backed by subprime mortgages were foreseeable by mid-2007 and use the ABX as one of the signs of problems in the subprime mortgage market. The plaintiffs argue that the "the collapse of the non-prime series within the ABX Index" was a sign of a high probability of incurring massive losses from subprime exposure, which would have reduced the value of the monoline insurer investment.21
Similarly, in a shareholder class action against the monoline insurer and asset manager ACA Capital, plaintiffs point to the ABX index as an alleged sign of highly likely losses. Specifically, plaintiffs state that "the collapse of the non-prime series within the ABX Index indicated that at the time of the IPO, ACA Capital had a very high probability of incurring massive losses on its CDO investments and the CDSs it issued."22 The defendants allegedly failed to disclose the risk of these losses in registration statements for ACA Capital's November 2006 IPO.
The ABX and Loan Loss Reserves
In addition to using the ABX in allegations involving the valuation of subprime mortgage-related assets and foreseeability, plaintiffs also reference the ABX in allegations involving loan loss reserves. Under GAAP, companies are required to have adequate reserves for: (1) estimated credit losses for loans specifically identified as being impaired; (2) estimated credit losses for loans or groups of loans with specific characteristics that indicate probable losses; and (3) estimated credit losses inherent in the remainder of a loan portfolio based on current economic events and circumstances.23 In several cases, such as In re CIT Group Inc. Securities Litigation, the plaintiffs argue that the decline in the ABX indices should have been one of the red flags that led issuers of subprime-related securities to increase their loan loss reserves. In similar cases, plaintiffs claim that defendants allegedly disregarded the decline in the ABX and misled investors about the growth prospects of subprime-related assets including ABS, CDOs and other mortgage-related products.
ABX REFERENCES IN DECISIONS AND OPINIONS
In addition, the performance of the ABX has been discussed in several court decisions, but it is too early to reach a conclusion on the role that the ABX will play in determining the outcomes of these cases. For example, in a dismissal opinion for Blackmoss Investments Inc., et al. v. ACA Capital Holdings, Inc., et al., Judge Robert Sweet states that the decline in the ABX index did not occur until after ACA Capital's November 2006 IPO. As a result, he concludes that the ABX index decline does not establish evidence that the defendants would have had the knowledge of a "rising trend of delinquencies and foreclosure in sub-prime RMBS."24
In a partial dismissal decision for In Re Citigroup Inc. Securities Litigation, Judge Sidney Stein reviewed the arguments by plaintiffs and defendants regarding the ABX index. He did not offer an opinion regarding the ABX-related allegations but stated, "These arguments amount to factual disputes that this Court cannot resolve on a motion to dismiss. Accepting the Complaint's factual allegations as true, plaintiffs have adequately pled that Citigroup's CDO valuations were false between February 2007 and October 2007."25
A partial dismissal opinion for Marshall Freidus, et al. v. ING Groep N.V., et al. seems to limit the applicability of the ABX indices as broad market indicators. In this case, purchasers of perpetual hybrid capital securities of ING Group, N.V. ("ING") assert that defendants failed to make timely impairments and loan loss reserve increases for its Alt-A and subprime-related RMBS portfolio. Defendants allegedly ignored indicators such as the decline in the ABX index.
In his opinion, Judge Lewis Kaplan notes that the decline in ABX tranches cited by plaintiffs occurred in tranches that were rated lower than the RMBS assets held by ING. He states:
Perhaps most importantly, the only allegations that concern Alt-A and subprime RMBS – the categories of assets ING owned – before September 2007 discuss the performance of [ABX] tranches that were lower-rated, and therefore riskier and more prone to loss, than those that ING held. Such allegations are, at best, consistent with a theory that ING's assets were "extremely risk" [sic] or not of "relatively high quality" in September 2007... But absent some factual allegations suggesting that ING's assets had been impacted by the general market conditions at the time the allegedly misleading statements were made, the CAC "stops short of the line between possibility and plausibility" that the September 2007 Offering Materials were misleading in a way that required additional disclosure. It therefore fails to state a claim on this basis.26
WHAT THE ABX INDICES CAN AND CANNOT TELL US
Part of assessing the allegations discussed above requires an understanding of what the ABX indices can and cannot reveal. In this section, we will evaluate three separate areas that may help illuminate key features of the ABX indices. The first of these three areas is the degree to which the ABX indices have been an accurate reflection of mortgage default rates. The second area is the so-called liquidity effect. The third area is a short summary of existing academic controversy and discussion on the role and impact of the ABX indices.
Have Prices of the ABX Been Consistent with Mortgage Default Rates?
Financial indices in general, and the ABX indices in particular, can be used as market gauges of a particular economic sector, market, or set of assets. These indices are useful for a wide range of reasons, from providing general information about the state of the sector or set of assets to serving as a financial tool in the construction of portfolios, under normal market conditions. As the credit crisis unfolded, the ABX indices showed dramatic changes (see Figure 3); as this occurred, serious questions emerged about what the ABX was measuring. Figure 3 presents the index levels of the various tranches of each ABX index. For example, the chart on the upper left-hand side presents the various indices of the ABX.HE 06-01, which consists of deals issued in the second half of 2005. The 2006-01 indices were issued in January 2006 at par and the decline started in 2007 with the BBB and the BBB- tranches, followed by the higher-rated tranches. For example, if you invested $100 dollars in the ABX 06-01 BBB- index in January 2006, the $100 dollars would be worth about $2 dollars as of the end of 2008.
The question is whether the default probabilities of the mortgage market as a whole are a sufficient statistic for the changes in the index.27 If not, what factors influence the index? At times of increased uncertainty and illiquidity, the true credit losses and the losses implied by the market prices of credit derivatives like the ABX could deviate significantly.

A 2008 study by the Bank for International Settlements (BIS) points out that macroeconomic factors such as risk appetite, interest rates, and concerns about market liquidity strongly impact ABX pricing. The study suggests that declining risk appetite and greater concerns about market illiquidity contributed to the collapse in ABX prices.28 A Bank of England Financial Stability Report from April 2008 also documents the deviation between implied losses as calculated from the ABX prices and actual credit losses on the underlying MBS. The study used the prices of the 2007 ABX indices to model the implied expectations of ultimate losses on the underlying subprime collateral. The BIS model estimated a loss rate of 38% on the 2007 H1 vintage in 2008, which would be "consistent with a loss given default of 50% and a risk neutral probability of default of 76%, both of which would be unprecedented. This suggests these prices may have become detached from the expected path of the real economy and hence from credit fundamentals."29 So even though the ultimate losses on subprime mortgages could be high, the market prices of the ABX seem to be overestimating the scale of the actual losses.
What is the Liquidity Effect? And Why does it Matter?
Liquidity is an important component of pricing any debt instrument. The credit spread, which is the premium investors demand over safer securities such as treasuries, provides compensation to investors of risky investments for additional credit risk and liquidity risk, among other risks.
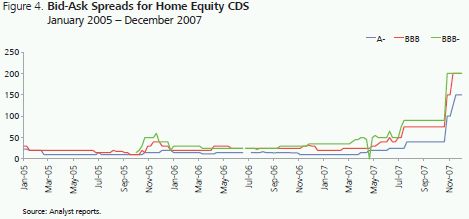
As the credit crisis unfolded and the flight to quality intensified, funding and lending started to cease and many found it difficult to borrow. Part of this difficulty emerged because of uncertainty around the credit quality of various assets; many had to be sold at far below face value. Figure 4 illustrates the increased perception of risk in the home equity market during the crisis with the significant spike in the bid-ask spreads.
Academic and industry sources have documented that liquidity conditions deteriorated for a wide range of financial asset classes during the crisis, along with a decline in the corresponding prices. The problem of distinguishing credit and liquidity effects in analyzing prices of various instruments including the ABX is a challenging one and has led to research on how to interpret interest rates on risky products. For example, Longstaff, et al. (2004) examined the spreads of corporate bonds and found that the default component does not account for the entire spread, which means that there are important individual-level and market-wide liquidity dimensions that factor in the determination of spreads.
The same phenomenon of risk premia being related to liquidity and other risks is true for the ABX indices as well. The underlying subprime ABS, which is the collateral of the ABX indices, have credit risk arising from the probability that borrowers of the underlying mortgages will not pay. They also have liquidity risk from various sources including funding obligations. Most of these vehicles/banks fund themselves using shorter maturity liabilities than the ABS on the asset side of their balance sheet. This leads to the risk that liquidity providers may not be willing to roll over funding. As a result, the prices of the ABX reflect various types of risks including liquidity risks. For example, Scheicher (2008) finds that liquidity factors are priced into nearly all tranches of the European iTraxx and the North American CDX indices—these are credit derivatives similar to the ABX but are designed to represent the investment grade part of the Euro and the US credit markets—with liquidity risk playing a bigger role since the financial crisis and the role of credit risk declining.
Prices of the ABX were also used to examine the contagion of the crisis and how the crisis spread from one sector to the other. Longstaff (2010) finds that ABX returns contained very little information for forecasting returns in other markets before the crisis. However, the author finds that the ABX returns became highly correlated and predictive for corporate yield spreads, Treasury bond yields, stock market returns, and even changes in the VIX volatility index during the crisis. The study concludes that an analysis of the ABX returns shows that the contagion of the credit crisis took place through a liquidity shock and a flight to quality. That is, investors who suffered losses in one sector realized that they could not obtain funding, which led to a downward spiral in the overall market.
The fact that liquidity risk is a component of ABX prices means that efforts to use the ABX indices either for hedging, mark-to-mark valuations, or as measures of housing market default risk must be undertaken with caution. Liquidity risk premia are difficult to quantify due to the difficulty in separating funding liquidity from default risk and therefore require caution (Schwarz, (2010)).
What is the Academic Controversy over the Use of the ABX to Price Subprime Mortgages?
ABX indices provide important functions in the subprime mortgage market for at least two reasons. The first is that they are potentially an aggregate measure of default probability in the subprime market, but not necessarily for specific securitization deals, as each deal should be examined at an individual level. However, as suggested by the above section, there is increasing evidence that the ABX indices do not only measure default risk. As the crisis unfolded and the ABX indices collapsed, many incorrectly equated the decline in the ABX to a sharp increase in actual defaults, instead of an increase in projected losses as well as other factors such as liquidity risks.
The second reason that the indices are important is that they are a measure of investor risk appetite. The investors' willingness to buy the assets is essential to pricing, particularly for high-yield securities such as low-rated tranches of subprime ABS.
As a result, some controversy has arisen in the academic literature as to the role and use of the ABX indices in pricing mortgages, particularly during and after the crisis. For example, if one wishes to price an illiquid CDO tranche, how appropriate is it to use the ABX? One must consider a variety of factors including the liquidity of the CDO tranche and the ABX index at the relevant time period and the comparability between the security and ABX index in terms of default risk and risk appetite of investors.30 As an example, the Bank of England (2008) compares actuarial measures to market-implied measures for subprime losses and finds that the two are not strongly related. The difference between actuarial to market-implied measures reflect the importance of non-credit factors, like market liquidity. This difference is particularly great for the AAA ABX indices as compared to the lower-rated ABX indices.
The use of the ABX indices would also depend on the correlation to macroeconomic factors. The Bank of International Settlements (2009) finds that general economic effects may differ across tranches, with safer tranches reacting more to the deterioration of the financial market and riskier tranches reflecting more of the credit quality deterioration. The study concludes that observed ABX prices are not good predictors of future default-related cash flow shortfalls on outstanding subprime MBS.
Perhaps most important is the fact that the ABX indices are based on a limited set of deals, and thus are not necessarily representative of the market as a whole. Again, the 2009 BIS study states:
As a result, limited index coverage makes it difficult to translate the performance of, say, the ABX 07-1 AAA index into information on how other AAA subprime bonds originated in the second half of 2006 have or should have performed. This, in turn, suggests that users of ABX price quotes (for purposes such as the "marking" of subprime MBS bonds or the estimation of market-wide subprime-related valuation losses for a universe of instruments that includes bonds not referenced by the ABX indices) have to be careful to avoid misrepresenting actual valuation effects.31
In sum, there is no consensus on the appropriate use of the ABX indices as indicators of overall market conditions. In some models and analyses, the patterns and linkages are relatively systematic and in others, it is noted that the ABX is composed of a limited number of deals, subject to liquidity factors that could be firm or deal-specific, and thus may not be broadly indicative.
ADDITIONAL THOUGHTS
As the credit crisis litigation proceeds, it is important to understand what the ABX indices can and cannot tell us. The indices are a publicly traded measure of investors' perception of the subprime market. But as the crisis unfolded and liquidity declined and even disappeared at various points, from not just the subprime market but all markets, the levels of the ABX indices reflected not just the increased default risk on the underlying referenced mortgages but also the increased perception of risk, lack of liquidity, increased uncertainty, and significant changes in the macroeconomic environment. It is critical to conduct careful analysis of the components of these ABX derivatives to properly use them as inputs in valuation.
Bibliography
Berndt, Antje, Rohan Douglas, Darrell Duffie, Mark Ferguson, David Schranz. "Measuring Default Risk Premia from Default Swap Rates and EDFs." BIS Working Papers, No. 173 (March 2005).
Coval, Joshua D., Jakub W. Jurek, Erik Stafford. "Economic Catastrophe Bonds." Working Paper. (June 2007).
Fabozzi, Frank J. The Handbook of Fixed Income Securities. 7th ed. (McGraw-Hill, 2005).
Fender, Ingo and Martin Scheicher. "The ABX: How Do the Markets Price Subprime Risk?" BIS Quarterly Review (September 2008). pp 67-81.
Fender, Ingo and Martin Scheicher. "The Pricing of Subprime Mortgage Risk in Good Times and Bad: Evidence from the ABX.HE Indices." BIS Working Papers, No. 279 (March 2009).
Fender, Ingo and Peter Hördahl. "Overview: A Cautious Return of Risk Tolerance." BIS Quarterly Review (June 2008).
Goodman, Laurie, Shumin Li, Douglas Lucas, Thomas Zimmerman and Frank Fabozzi. Subprime Mortgage Credit Derivatives. (John Wiley and Son, 2008).
Longstaff, Francis A. "The Subprime Credit Crisis and Contagion in Financial Markets." Journal of Financial Economics. No. 97 (2010). pp. 449.
Longstaff, Francis A. and Arvind Rajan. "An Empirical Analysis of the Pricing of Collateralized Debt Obligations." The Journal of Finance, Vol. 63, No. 2 (April 2008).
Longstaff, Francis A., Sanjay Mithal, Eric Neis. "Corporate Yield Spreads: Default Risk or Liquidity? New Evidence from the Credit-Default Swap Market." NBER Working Paper No. 10418 (April 2004). Available at http://www.nber.org/papers/w10418.
Scheicher, Martin. "How Has CDO Market Pricing Changed During the Turmoil? Evidence From CDS Index Tranches." ECB Working Paper Series, No. 910 (June 2008).
Schwarz, Krista. "Mind the Gap: Disentangling Credit and Liquidity in Risk Spreads." Working Paper. (31 October 2010).
Bank of England. "Financial Stability Report." Issue 23 (April 2008).
Footnotes
1 Dr. Cohen-Cole is an Assistant Professor in the Finance Department of the University of Maryland Robert H. Smith School of Business and a Special Consultant to NERA, and Dr. Sabry is a Senior Vice President at NERA. The authors would like to thank Chris Laursen, Anne Gron, Sungi Lee, Eric Wang, and Anmol Sinha for all their helpful comments. All errors are ours.
2 Bloomberg download.
3 Frank J. Fabozzi, The Handbook of Fixed Income Securities, 7th ed., p. 701.
4 Markit is a global financial information services company that provides independent data, valuations, and trade processing across various asset classes. They administer various types of indices including the ABX. http://www.markit.com/en/media-centre/about-markit-cds-pricing-page.
5 A tranche is a class of the bond or security.
6 http://www.markit.com/en/products/data/indices/indices-page.
7 See Goodman, et al. Subprime Mortgage Credit Derivative, Second edition, 2008, for a detailed analysis of the pricing and trading of the ABX indices.
8 Inger and Scheicher, "The ABX: how do the markets price subprime mortgage risk?" BIS Quarterly Review, September 2008.
9 For a detailed discussion of the valuation approaches, see Frank J. Fabozzi, The Handbook of Fixed Income Securities, 7th ed.
10 Goodman, Laurie, Shumin Li, Douglas Lucas, Thomas Zimmerman, and Frank Fabozzi. Subprime Mortgage Credit Derivatives (John Wiley and Son, 2008).
11 Consolidated Complaint, In re CIT Group Inc. Securities Litigation, ¶134.
12 Complaint, The California Public Employees' Retirement System v. Richard S. Fuld, Jr., et al., ¶93.
13 A Level 3 asset is an asset whose fair value has unobservable inputs.
14 Complaint, The California Public Employees' Retirement System v. Richard S. Fuld, Jr., et al., ¶95. A Level 2 asset is an asset whose fair value can be determined from observable inputs.
15 Complaint, The California Public Employees' Retirement System v. Richard S. Fuld, Jr., et al., ¶95–96.
16 The TABX.HE (Tranched ABX) index is a benchmark for the performance of ABX tranches created from the constituents of the ABX.HE indices.
17 Consolidated Class Action Complaint, In Re Citigroup Inc. Securities Litigation, ¶216.
18 Consolidated Complaint, In Re Royal Bank of Scotland Group PLC Securities Litigation, ¶150.
19 Amended Complaint, Stillwater Market Neutral Fund II LP v. Bear Stearns Asset Management Inc., et al., ¶475.
20 Complaint, Hayne Palmour III, et al., v. Morgan Keegan & Company, Inc., ¶61.
21 Consolidated Amended Class Action Complaint, Landmen Partners Inc., et al. v. The Blackstone Group L.P., et al., ¶110.
22 Consolidated Amended Class Action Complaint, Blackmoss Investments Inc., et al. v. ACA Capital Holdings, Inc., et al., ¶45.
23 See Statement of Financial Accounting Standards No. 114 and Statement of Financial Accounting Standards No. 5.
24 Consolidated Amended Class Action Complaint, Blackmoss Investments Inc., et al. v. ACA Capital Holdings, Inc., et al., ¶58. See also Opinion, Blackmoss Investments Inc., et al. v. ACA Capital Holdings, Inc., et al., p. 10.
25 Opinion and Order, In Re Citigroup Inc. Securities Litigation, p. 44.
26 Memorandum Opinion, Marshall Freidus, et al. v. ING Groep N.V., et al., p. 26.
27 A sufficient statistic x, for some other variable, y, is one in which x describes all of the variation of y. In this case, it would mean that default probabilities explain all of the variation of the ABX, to the exclusion of other factors.
28 Inger and Scheicher, "The ABX: how do the markets price subprime mortgage risk?" BIS Quarterly Review, September 2008.
29 Bank of England, "Financial Stability Report", Issue 23, April 2008, pp. 17–20.
30 Longstaff and Rajan (2008) find that a three-factor portfolio credit model explains almost all of the time-series and cross-sectional variation in CDX index tranche prices. This implies that one may be able to use these same factors to price untraded CDOs. On the other hand, Coval et al. (2007) find that CDX tranches behave like economic catastrophe bonds, and that senior CDO tranches are under-compensated for the large systematic risk they bear. Therefore, they are difficult to approximate by a simple model.
31 Fender and Hördahl (2008) also reveal potential pitfalls with the ABX HE index. The authors note that past estimates of valuation losses at the AAA level may have been inflated by more than 60%.
The content of this article is intended to provide a general guide to the subject matter. Specialist advice should be sought about your specific circumstances.
