EXECUTIVE SUMMARY
Almost all data generated today has some form of geographical reference.1 A-level results, crime statistics and even well-being survey data can all be tied to a location and plotted on a map.
Our digital world would have been the envy of many ancient civilisations who struggled to create even the simplest representations of the planet's geography. We have become masters of cartography, capable of crafting maps that show places and things and other abstract concepts in precise detail and in various hues.
Geospatial analytics should, therefore, be radically transforming the public sector. However, the explosion of data – from official sources as well as from the proliferation of smartphones, social media updates and the vast array of internet-enabled devices – presents challenges and opportunities that cannot be resolved with cartographic skills alone. While the fundamentals of mapping have never been more important, geospatial insights can only be uncovered by more sophisticated analysis, which is now being enabled by greater access to tools and skills, and through instruments such as the Public Sector Mapping Agreement for Ordnance Survey data.2
This paper presents a step-by-step approach, illustrated with examples, to help public sector organisations understand how geospatial analysis can be used to derive insights that:
- focus on efficiency and deliver cost-savings
- improve service quality and effectiveness
- engage the public
- enable collaboration with other organisations.
Analysing data from a geographical perspective can help organisations paint a more detailed picture of the issues and events that affect public service delivery. Connecting seemingly disparate data points by referencing their location can reveal the relationships between public services, businesses and citizens. The context of place is a universal language that everyone can understand, enabling organisations to cut through the noise, break down data silos and get to the root causes of the challenges they face. In short, public sector bodies can use location data to develop geospatial insight that reshapes how decisions are made.
WHAT IS GEOSPATIAL INSIGHT?
Location, location, location
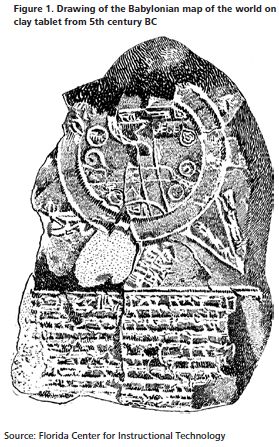
People have always been fascinated by their physical environment. Since the dawn of civilisation, attempts have been made to portray on maps the geography of continents, countries, cities, landscapes and a host of other natural and man-made features. These attempts have contributed essential knowledge about our planet over the ages. One of the earliest known maps dates back to the fifth century BC and takes the form of a clay tablet depicting the world as the Babylonians saw it. As time unfolded, and as humankind's thirst for exploration and discovery advanced, so too did the cartographic tools and skills needed to render their new discoveries on stones, silk and eventually paper.
Over the centuries, surveying techniques were perfected to produce much more accurate maps that captured the precise scale and location of physical objects. These skills also made it possible to add more abstract data to maps – data that did not necessarily form part of the physical landscape but nevertheless could be associated with a particular position in three- dimensional space, even if it were only transitory. People were starting to use maps to generate new ideas about the intersection of significant events and geographic location, and thus the concept of geospatial insight was born.
For example, in 1854, a particularly severe and virulent outbreak of cholera swept through the Soho district of London, killing hundreds of people in a matter of days. Against the prevailing theory of miasma, or 'bad air', a physician named John Snow – already certain of the waterborne nature of the disease – marked the location of each death as a dot on a map centred on Broad Street in an attempt to identify the source of the epidemic. His map clearly showed large clusters of fatalities in the vicinity of the Broad Street pump, from where the majority of residents drew their drinking water and which he suspected of being the source. But far from being conclusive, Snow's map also showed a number of deaths elsewhere, closer in proximity to water pumps on other streets. This, he feared, would undermine his theory for how the disease was spread.
Snow therefore added a further line to his map – an irregularly shaped loop that marked the boundary between the Broad Street pump and other pumps in the same district. This, however, was not a physical feature; it was, instead, a line that depictedtime. For every resident or worker within the boundary, the Broad Street pump represented the quickest walk.
Snow's map now much more clearly demonstrated that the vast majority of deaths had occurred within this boundary and that the Broad Street pump was indeed at its centre. Ultimately, this map became the central piece of evidence that convinced theauthorities of cholera's waterborne transmission and of their need to improve London's sewer system. As a result, the city managed to fend off subsequent outbreaks and its new infrastructure became the model for cities all over the world.3

Fast-forward a century and mapmakers had begun to make use of revolutionary computer technology to digitise their maps.5 From these efforts emerged the new field of Geographic Information Systems (GIS) – systems that capture, manage, display and analyse geospatial information in digital form. These modern technologies allowed organisations as well as individuals to not only map physical objects and non-physical attributes of a place, but also visualise how these things changed over time, whether the objects were above, below, or on the surface.
In the 1970s, most national mapping agencies around the world were creating some form of digital maps, with Ordnance Survey Great Britain, for instance, beginning to digitise its 230,000 base maps from 1973.6 By the 1980s, the use of GIS became more common in commercial and public sector organisations, thanks largely to the costs of computer hardware and software packages falling below a critical threshold.7 By the time Ordnance Survey had completed its digitisation process in 1995, 80 per cent of UK local authorities were using digital maps in some way.8
In 2011, Ordnance Survey data generated almost £1 billion of related spending on services, software and hardware such as satnav devices.9

Today, such is the explosive growth in geo-referenced data – derived from everything from RFID (radio frequency identification) tags and satnavs to smartphones and billion-person social networks – that up to 95 per cent of data can be located on a map.10 However, although digitisation has enabled more efficient and effective mapping, extracting valuable and actionable insights from the enormous volume and complexity of data, often with location reference, requires a more sophisticated approach. While 'X' used to mark the spot, simply plotting objects on a map does not meet the multifaceted needs of organisations today.
Just as John Snow learned that geospatial insight was needed to rid the world of the scourge of cholera, so must the modern public sector adopt the same approach to create opportunities for growth and form new perspectives on the country's pressing fiscal and societal challenges.
Drivers for a new generation of geospatial insight
Despite an increase in the use of GIS in pockets of the public sector over the past two decades, the analysis of geospatial data still plays only a relatively minor role in policy setting and decision making. But the 'landscape' is changing rapidly: the availability and improved performance of new technology, in the form of computer hardware and software, and the myriad ways that now exist for people to create and consume geospatial data are factors that drive the business case for greater uptake of geospatial analytics.
- Hardware – Costs are falling while performance is increasing; changes in technology mean organisations have the processing power they need to analyse geospatial data or can turn to cost- effective cloud-based processing solutions.
- Software – Many applications, once regarded solely as consumer products, now offer enterprise solutions; traditional mapping companies and firms offering business analytics capabilities are also innovating, developing new features such as web- based geospatial analytics and self-serve dashboards.
- Data – Vast quantities of geospatial data, from social media in particular, are being generated by individuals when they 'check-in' at a venue, tag a photo with location data from their GPS-enabled smartphones, or send a 'tweet'; the public's appetite for geographic information also extends to volunteered geographic information (VGI) for the public good.
- People – Widespread use of mapping platforms, such as Google Maps or OpenStreetMap, and satnav services on mobile devices have rapidly increased everyday familiarity with geographic information; consumers are living in a new hybrid world – part physical, part digital – where manipulating digital maps is no longer the sole domain of highly trained cartographers with expensive tools; this increased map literacy means the public sector has 'hidden' talent among its workforce.
- Procedures – The combination of new technologies,
changing attitudes and culture, and new uses of location
information presents an opportunity for the public sector to
incorporate geospatial insight in every process and in every
decision.
Key questions for all public sector organisationsGeospatial insight can add considerably to existing knowledge at international, national, regional, local and hyper-local levels. It enables smarter decisions to be made by authorities, and visualising many different types of data against the context of location can uncover new insights that can be used to deliver more cost-effective and higher-quality public services. So, where should public sector organisations begin? This paper addresses two of the key questions:
|
THE JOURNEY STARTS HERE
First, focus on efficiency
Almost all public sector services can generate cost savings from the smarter use of geospatial data to derive insights that inform everything from asset management to zoning requirements. With every public sector body tasked with 'doing more with less', as part of the Government's four-year, £81 billion austerity plan, simply recording where assets lie, for example, not only informs decision makers of the availability of resources, but also allows more effective planning that translates to cost savings.11 More widely, as departments and Non-Departmental Public Bodies (NDPBs) explore where further efficiency savings can be made, geospatial analytics will become an increasingly important tool for tackling these ongoing budgetary challenges.
Geospatial visualisation – presenting complex data in a way that can be easily assimilated and analysed – is one of the simplest steps that organisations can take when they have to take into account a multitude of interacting and interdependent factors towards decisions that affect the everyday lives of citizens. Effective visualisations can reveal insights in the form of unexpected correlations among different data that help policymakers look at the target problem from a different perspective and inspire new solutions. Looking at data from a geospatial perspective can help cut through the noise, enabling organisations to focus on root causes before they become expensive issues.

For example, when Gloucestershire County Council took over the concessionary bus travel from district councils, it needed to reduce the costs of bus subsidies by £2 million. Rather than cutting back-office staff and cancelling routes outright, the council sought a different solution: they first plotted the various bus stops and routes on an Ordnance Survey map and then added additional data layers to describe the local community and essential services. This visual analysis enabled decision makers to minimise transport route withdrawals, remove duplication and redesign under- utilised routes so that they were more cost-effective. The changes ensured minimal disruption to the journeys of users of essential services while achieving the targeted savings.12
Similar transport management techniques can also apply to many other public services, especially at the local level, including the analysis of vehicle routes for school pick-ups and drop-offs, road and highway maintenance, and waste collection services. Each area has the potential to benefit from cost savings associated with route optimisation and planning while simultaneously maintaining the same or delivering an even better quality of service.
As well as using geospatial insight to reduce the cost of delivering services, public sector organisations can use analytics to match more successfully the supply of and demand for services. For example, a challenge faced by many local councils is the inefficiency of social housing, in particular where the size of accommodation exceeds the needs of the claimants based on their family size. To tackle this issue, Huntingdonshire District Council combined single-occupancy data derived from council tax receipts with the number of bedrooms available at the address listed in the social housing catalogue.
The council was able to identify over 500 properties that were under-occupied and subsequently helped families living at these addresses re-locate to more suitable living spaces.13 This freed up a stock of bigger properties suitable for traditionally hard-to-place large families. Optimising the use of existing housing stock in this way generates not only cost savings in terms of the housing subsidies distributed by the local council, but also financial benefits to the new tenants of now smaller homes, who pay lower charges for rent, council tax and utilities.
Geospatial analytics is equally adept at handling intangible items, such as payments or risks, to help spot relationships and patterns between people and other entities that are not apparent on spreadsheets or in databases. Analysing payments, based on location, can often reveal non-obvious relationships indicative of tax evasion or fraud, for instance. The city of Ontario in California, for example, combined location data from a number of sources, including water usage, vacancy in a commercial zone, and fire inspection records against business licences to identify premises where owners were not paying their business taxes. This allowed the state authorities to recover fees retrospectively and thus boost their income.14 Other states in the US have developed modelling tools that "incorporate spatial interaction based on proximity and other attributes in a probabilistic manner for monitoring fraud".15
The examples so far involve straightforward mapping of data for subsequent display and visual analysis to reveal insights, but geospatial analytics is not limited to a two-dimensional projection. New techniques, such as the use of aerial imaging and Light Detection and Ranging (LiDAR) – a sensing technology using lasers to record heights – can produce very detailed three- dimensional maps. These technologies enable detailed models of public and private assets – from trees to buildings – to be constructed, which can help town and country planning officials quickly understand the impact of impending construction works, speed up the issuing of building permits or produce accurate flood scenarios, all of which save time and cost for all parties involved.16
Second, improve quality and performance
Using analytics to generate efficiency savings is but one aspect of geospatial insight. A cluster of dots on a map can form patterns that, when analysed over time and in meaningful numbers, can be used to make predictions about future behaviours or events. This type of analysis can be used to strengthen the quality of public services, increase productivity, allocate resources more effectively and develop preventative policies.
Although cutting costs is an urgent priority for central government departments, local authorities and NDPBs, providing for the long-term needs of citizens is also a critically important objective. Shifts in the expectations, preferences, attitudes, behaviours and demographics of different segments of the population demand constant changes to public service. For example, local authorities are expected to increase the supply of social care for the ageing population, and the country is witnessing a rise in bariatric surgeries as people become less active in their day-to-day lives.17,18 Targeting interventions more effectively where they are needed, using geospatial insight, helps organisations improve outcomes while meeting the more general needs of a frugal budget.
One of the concerns over recent budget cuts is the effect they may have on the number of frontline staff and the pivotal services they provide in law enforcement. An estimated reduction by Her Majesty's Inspectorate of Constabulary of 32,400 staff in police forces across the UK by March 2015 means transforming the way day-to- day policing services are delivered.19 Increasingly, officers will be expected to carry out a wider range of duties while simultaneously delivering at least the same level of services to the public. In the East Midlands, for instance, the Leicestershire Constabulary have turned to innovative technology to visualise and track their vehicles and staff in real-time.
The system records duty-rotas, skills data, and incidents as they are reported, enabling the force to build a single picture of the policing environment and use this situational awareness to deploy the right resources to the right places at the right time. Using a network of sensors, the actual patrol routes of officers are also displayed on a web map for local residents to see.20 As a result, emergency response times have shortened, public confidence in the local police force has increased and reported cases of anti-social behaviour have dropped.21
In the near future, UK police forces could be using geospatial analytics to forecast crimes. While this may sound futuristic and reminiscent of the film 'Minority Report', the predictive analytics unit in Chicago's police department is already trialling the use of spatial algorithms on emergency services call data to identify where violent crimes or robberies are likely to occur next.22 By overlaying other data such as street lighting, population density and building-type on top of real- time crime data, police forces can better visualise which locations are more likely to attract crimes and thus take pre-emptive action.
Predictive power can also be used to understand and defend against other types of hazard, such as accidents and natural disasters. As our climate becomes more unpredictable, flooding, in particular, is of major concern to the Environment Agency, local authorities and residents of many parts of the UK. Recent advances in analytical tools and techniques now allow officials and responders to examine the geospatial relationships between a considerable number of factors – including highly localised data on rainfall, surface elevation, soils, geology, drainage and historical flood data – to identify at-risk areas and improve flood defences.23

Scenario modelling, in turn, can help different branches of local services design and co-ordinate responses appropriate for dealing with contingencies, taking into consideration the location of vulnerable people, where to site relief centres and accessible travel routes for emergency vehicles.24,25 In addition, long-term modelling of coastline erosion over the next 100 years can inform investment decisions relating to long-lasting onshore flood defences.26
Geospatial analytics allows 'place' to be used as a basis for comparison, especially when other factors are held constant, such as demographics, per-capita funding and regulatory structures. This allows policymakers to investigate why some programmes and projects thrive in one place but fail elsewhere. One such example arose in the city of Bristol, where geospatial analytics on Ordnance Survey mapping was used to identify gaps in the provision of drug and alcohol treatment. The data is helping the city locate sites for future treatment centres that will more effectively target the communities and individuals who need them.27
Key questions to inform your first stepsShifting from a spreadsheet or database view of public services to a geographical view can, with some simple analysis, reveal insights that have a dramatic impact on costs and also help organisations to develop and implement plans for delivering higher-quality and more effective services. Here are key lessons distilled from the thoughts and examples presented in this section: Visualise how you are delivering public services – Use location to visualise intangibles as well as physical objects and places to get a better sense of how public services are being delivered. Use all the dimensions in your analysis – Use elevation and time as additional mapping dimensions, particularly for planning and understanding trends. Look for hidden geographic correlations – Look for geographic relationships between the complex set of factors underlying policy issues and identify mismatches between service supply and demand, as well as unexpected correlations that may be indicative of fraud. Track assets to deliver services at the right place and time – Monitor where your assets and people are in real-time to improve productivity. Think about what might happen in the future – Use predictive modelling to develop 'what-if' scenarios and understand the likelihood of future events, so that you can plan and respond accordingly. |
PUTTING COLLABORATION ON THE MAP
Third, engage the public
While significant changes to the UK's population, demographics and lifestyles need to be met with shifts inwhat public services are delivered, the ongoing technology revolution demands changes in how services are delivered and the public is engaged. Mobile devices, always-on internet connections and the general pervasiveness of social media are altering the way people expect to consume information, particularly 'generation-Z', who are completely unaccustomed to a world without data.
A decade ago, official communications tended to be one-way: the public sector disseminated information via local newspapers, leaflets, phone calls, television and through limited use of the Internet. Public involvement in policymaking and service delivery was generally limited to those who were passionate enough to write, call or visit to air their opinions. Social media, however, has changed behaviours and expectations for engagement. It gives citizens – even those who would not usually engage with officialdom – forums to find information, participate in discussions and broadcast their thoughts.
Continuing the earlier example of using geospatial data to defend against flooding, the Environment Agency has recently published easy-to-use online maps that help members of the public understand the geography surrounding their home or workplace and the risk of flooding.28 More recently, the agency has produced a real-time flood map that helps people in England and Wales track areas in danger of imminent flooding and prepare for action.29 The next step could be broadcasting these warning messages to mobile phones located within danger areas, as Japan has done with earthquake alerts that warn citizens of impending seismic activity.30
Perhaps most significantly, though, all of these mobile devices and social media updates create significant amounts of geospatial data, which can be used by organisations to derive valuable insights that inform the planning, delivery and measurement of public services. Using social media, for example, individual citizens can provide updates on river levels or upload geo-tagged photos of flooded areas. Thousands of people, affected by wildfires in California, turned to social media to update a global audience, while others in the immediate vicinity relied on these 'ground truths' to keep informed, make emergency plans and assist victims.31
The use of volunteered geographic information can be just as effective in addressing non-emergency issues. FixMyStreet, for example, uses Ordnance Survey mapping to provide a platform for UK citizens to report, view and discuss problems in their local area.32 Reports of damage or vandalism, such as potholes or graffiti, are submitted to local authorities who can provide updates and undertake corrective actions. The platform provides an effective two-way communication channel and also decreases the amount of time it takes to report and resolve neighbourhood problems. These simple principles have also been used for transport problems on FixMyTransport.33
Interest in the use of open government data – data published by government departments, local authorities and other public bodies free-of-charge to improve transparency and contribute to economic growth – is also coming from the wider public who are creating useful maps and applications for social good and business benefit. For example, the Guardian Datablog routinely visualises open data on maps, such as crime statistics and poverty levels, to highlight the important stories behind the raw data. Another example is FearSquare, which cross-references UK police crime statistics from police.co.uk with a user's recent FourSquare check-ins to show how many crimes have been committed in the previous month in areas that the user is visiting.34
Sometimes, releasing open data, especially data containing detailed local information, has the unintended consequence of encouraging public interaction. For example, the Department of Transport maintains the National Public Transport Access Node (NaPTAN) dataset, which details over 400,000 bus stops, stations and airports and how they are used. As the nation's roads and infrastructure change over time, however, data discrepancies begin to surface. So when the NaPTAN dataset was released to OpenStreetMap by Traveline – a partnership of transport operators and local authorities – numerous volunteers among the public began to provide quality control, removing disused bus stops and also updating access points that had been relocated.35 This example of crowdsourcing improvements to official data shows how citizens can turn private time into public value.

The public sector can harness the public's enthusiasm through events and competitions, which are fun for the participants while furthering a larger public policy goal. For example, Ordnance Survey's 'GeoVation' site poses challenges that address specific community needs, which may be satisfied, in part, through the use of geography.37 Entrepreneurs, developers and community groups can enter challenges for a chance to win innovation funding to help develop their ideas.
In some cases, incorporating social media in geospatial analytics enables authorities to make early interventions to mitigate and contain risks before problems become more widespread, and can also help guide decisions. The 'Mappiness' project from the London School of Economics, for example, asks volunteers in the UK to rate their mood on GPS-enabled smartphones, which also record their location details.38 Direct feedback from the public, in this instance, helps researchers understand how people's happiness is affected by their local environment – knowledge that can shape future public policy to improve the wellbeing of citizens.
Some of the factors that make location data useful – the ability to visualise individual behaviours and patterns of life, for instance – also bring challenges with regard to personal privacy. Despite living in an inceasingly digital world where people are, in some cases, voluntarily contributing data to the digital universe, individual members of the public still maintain quite traditional views of privacy.39 The key to engaging with the public is recognising and responding to these concerns by being open and transparent about the data that is collected and used, by giving them an explicit choice to opt in, and by emphasising the personal benefits of such data use.
Fourth, collaborate with other organisations
This paper has shown that geospatial analytics can benefit the public sector in many ways: optimising routes and operations; improving the delivery of public services; planning for an ageing population; and enhancing the public perception of and engagement with government. However, at a time of increasing fiscal austerity, public sector organisations may be reluctant to invest in geospatial analytics – by adding expertise or buying new technology or data – despite reasonable assurances of the benefits.
Yet, for many public sector bodies, the cost to get started may be relatively small, particularly if different departments or offices can pool existing GIS technology, geospatial data and expertise. Sharing resources has the potential to generate cost savings in capital expenditure and in operational budgets for licensing, training and activities associated with geospatial analysis, too – even for small or ad hoc investigations.
In southeast England, for example, the New Forest District Council has partnered with 25 local councils in the area to share access to a central mapping system and geospatial data from Ordnance Survey, which distributes the cost of licensing across all parties.40 The partnership also enables shared services, such as maintenance of green space, and encourages the collaborating organisations to share their knowledge and best practices for wider use.

Collaboration between departments promotes innovation, and solutions to difficult problems in one sector may be found by people who approach a specific challenge from a different sectoral perspective. Moreover, as employees become more familiar with consumer mapping products and location- based services from their use of the Internet and smartphones, this will help to raise overall skill levels and confidence in geospatial analysis at work.
The Government's drive towards open data is one factor that is helping to break down 'information silos' as well as organisational and cultural barriers. Considerable quantities of geo-referenced data are now available from a cohort of central government departments, regional authorities, local councils, agencies and other NDPBs.
For example, roadworks.org (formerly elgin.gov.uk), which was re-launched in early 2012, incorporates data from over 100 local authorities, the Highways Agency and Transport for London to provide definitive road works information covering over 75 per cent of England and Wales (and is soon to include Scotland). The benefits to users are many and varied: residents and local councillors can find out about road works in their area, motorists can find out if their journeys are likely to be disrupted, and organisations such as transport operators and emergency services can plan their routing more effectively. Roadworks.org is also used extensively by utility companies and contractors to co-ordinate their projects, thus reducing congestion and the environmental impact associated with road works.
Collaborative projects are not limited to open data provided by the public sector, of course. Geo-tagged photos from popular social networking and photo- sharing sites can be analysed to reveal the underlying nature of regional tourism, answering questions such as which locations are visited most, how the number of visits varies by time of year and how sightseeing patterns differ based on the visitor's country of origin.41 Such insights can help local authorities support tourism by delivering targeted marketing campaigns and improving local transport routes between identified tourist hotspots.
The open data movement is playing a significant role in bringing together the public sector organisations across the private and not-for-profit sectors and academia that share the common goals of transparency, efficiency and growth. But public-private collaborations need not depend entirely on open data. The combination of public sector information and geospatial data collected outside the public sector can contribute insights to decision making and policy formation. For example, anonymised location data from mobile phones can show patterns of movement in local areas, which can be useful for a wide range of applications, such as traffic management, disaster response, crowd management, efficient allocation of public transport and urban planning. In Amsterdam, for instance, the Dutch Ministry of Transport examined the use of mobile phone data to address the problem of incident management, in particular looking at how telecoms data could help clear road traffic as quickly as possible after an incident had occurred.42

Key questions to support geospatial collaborationIt is hard to realise the full benefits of geospatial analysis and insight within the confines of an ivory tower. Geospatial and geo-tagged data demands interaction with users, consumers and other providers who live, work, play, pass through or otherwise contribute to the location being viewed. Collaboration is essential. Here are key lessons distilled from the thoughts and examples presented in this section: Target the people that matter – Use geospatial insights to deliver relevant and real-time information to the people who need them. Use social media to get a better 'on-the-ground' picture – Draw on the public's geo-tagged contributions on social media or other dedicated sites to augment your situational awareness and deliver a meaningful response. Encourage collaborative consumption – Crowdsource improvements to geo-referenced data to improve the accuracy and quality of insights. Remove internal information silos – Share technology, data and people across departments to fill holes in capability and insight. Deliver data-driven services in partnership – Encourage journalists, businesses and citizens to use your geospatial data, and partner with the private sector where you can demonstrate that their specialist data is likely to contribute to more efficient or effective services. |
WHAT DOES THE FUTURE HOLD?
'X' is just the beginning
Maps have been at the heart of public sector decision making for centuries. They represent a familiar and well-trodden path. However, the wider technology environment is changing rapidly and simply plotting locations on a map will no longer always reveal the complex relationships in the underlying data – relationships that need to be understood to drive out cost savings and improve service delivery. Moreover, although the use of digital maps is prevalent across the public sector, geospatial analytics is not.
Public sector organisations can survive without insights from geospatial data and analysis, of course, and the pursuit of greater analytics capability may be seen as a luxury that few can afford under the burden of strict fiscal austerity measures. But national bodies may begin to miss local issues, local authorities may fail to understand the impact of national changes, and officials at all levels of government and in all walks of public service may miss the opportunities that geospatial insights can create for smarter, more targeted public engagement and interaction. As citizens themselves become more familiar with location-based concepts, through using their smartphones, satnavs and social media, and the digital universe of geospatial data continues to explode, the gulf between public sector and citizen may become even wider. For organisations accustomed to operating in an insight economy, this may feel like a step back to the dark ages.
The journey to greater geospatial insight need not be so traumatic, though. The four simple steps presented in this paper can help policymakers re-imagine public service delivery and empower individuals, communities and businesses to take part. In the future, geospatial insights not only are likely to contribute to more efficient running of the public sector, but also have significant potential to contribute to growth in the wider economy through partnerships, entrepreneurship and innovation.
Geospatial insight is a new way of connecting the dots using geography as a reference. New, cheaper tools, an abundance of data and widespread skills can all be harnessed to improve productivity and efficiency in ways that were not possible even a few years ago. 'X' may no longer mark the spot, but the treasure can yet be uncovered.
Footnotes
1 "Have you mapped your data today?", Bart Perkins, Computerworld, 12 July 2010. See also: http://www.computerworld.com/s/article/350588/Have_You_Mapped_Your_Data_Today_
2 See http://www.ordnancesurvey.co.uk/oswebsite/public-sector/mapping-agreement/index.html
3 "The Ghost Map: The Story of London's Most Terrifying Epidemic — and How it Changed Science, Cities and the Modern World", Steven Johnson, Riverhead Books, 2006.
4 Map from "On the Mode of Communication of Cholera, 2nd Ed", John Snow, Churchill London, 1855. Voronoi line enhanced for legibility.
5 "Geographic Information Systems and Science: Today and Tomorrow", Michael F. Goodchild. See also http://www.geog.ucsb.edu/~good/papers/483.pdf.
6 "Geographic Information Management in Local Government", Ian Gilfoyle and Peter Thorpe, CRC Press London, 2004.
7 "Geographic Information Systems and Science – 2nd Edition", Paul A. Longley, Michael F. Goodchild, David J. Maguire and David W. Rhind, John Wiley & Sons, 2005.
8 Ibid.
9 See http://www.online-web-presentations.com/OrdnanceSurvey2012/
10 "Have you mapped your data today?", Bart Perkins, Computerworld, 12 July 2010. See also: http://www.computerworld.com/s/article/350588/Have_You_Mapped_Your_Data_Today_
11 "Spending Review 2010", HM Treasury, October 2010. See also: http://cdn.hm-treasury.gov.uk/sr2010_completereport.pdf
12 "A reduction of £2,000,000 from Gloucestershire County Council's annual transport spend", Ordnance Survey. See also: http://www.ordnancesurvey.co.uk/oswebsite/docs/case-studies/gloucestershire-county-council-transport-spending-saving.pdf
13 "Everything Happens Somewhere – Working Together Across the Public Sector", GeoPlace, March 2012. See also: http://www.iahub.net/docs/1331895527898.pdf
14 "Beyond Maps: GIS Decision Making in Local Government", John O'Looney, ESRI Inc., July 2000.
15 "Using Spatial Analysis for Monitoring Fraud in a Public Delivery Program", Yushim Kim, Social Science Computer Review, Volume 25 Number 3, Fall 2007.
16 Image & Information – UKMap Launch Edition, The GeoInformation Group, Summer 2009. See also: http://geoinformationgroup.co.uk/wp-content/uploads/2010/10/Image-Information-May-2009-web.pdf
17 "Funding outlook for councils from 2010/11 to 2019/20: preliminary modelling", Local Government Association, 26 June 2012. See also http://www.local.gov.uk/web/guest/publications/-/journal_content/56/10171/3626323/
18 "Statistics on obesity, physical activity and diet: England, 2012", The Health and Social Care Information Centre, 23 February 2012. See also: http://www.ic.nhs.uk/webfiles/publications/003_Health_Lifestyles/OPAD12/Statistics_on_Obesity_Physical_Activity_and_Diet_England_2012.pdf
19 "Policing in austerity: One year on", HMIC, July 2012. See also: http://www.hmic.gov.uk/media/policing-in-austerity-one-year-on.pdf
20 "Leicestershire Constabulary iR3 initiative goes nationwide", British APCO Journal, 13 January 2010. See also: http://www.bapcojournal.com/news/archivestory.php/aid/1577/Leicestershire_Constabulary_iR3_initiative_goes_nationwide.html
21 Ibid.
22 "The power of zoom: Transforming government though location intelligence", Deloitte Consulting LLP, 2012.
23 "Coastline modelling will provide early warning of sea flooding", Robin Turner, WalesOnline, 29 March 2012. See also: http://www.walesonline.co.uk/news/wales-news/2012/03/29/coastline-modelling-will-provide-early-warning-of-sea-flooding-91466-30647796/
24 "Map-based data: savings for local government?", publicservice.co.uk, 3 July 2012. See also: http://www.publicservice.co.uk/feature_story.asp?id=19910
25 "Preliminary Flood Risk Assessment (PFRA)", Dudley Metropolitan Borough Council, June 2011. See also: http://www.dudley.gov.uk/EasysiteWeb/getresource.axd?AssetID=152112&type=Full&servicetype=Attachment
26 "Coastline modelling will provide early warning of sea flooding", Robin Turner, WalesOnline, 29 March 2012. See also: http://www.walesonline.co.uk/news/wales-news/2012/03/29/coastline-modelling-will-provide-early-warning-of-sea-flooding-91466-30647796/
27 "Improving drug and alcohol treatment provision in Bristol", Ordnance Survey. See also: http://www.ordnancesurvey.co.uk/oswebsite/docs/case-studies/avon-imt-consortium-improving-drug-and-alcohol-treatment-provision-in-bristol.pdf
28 See http://www.environment-agency.gov.uk/homeandleisure/37837.aspx
29 See http://www.shoothill.com/FloodMap/
30 "Cellular Technology that Told Japan an Earthquake Was Coming", Christopher Mims, MIT Technology Review, March 13 2011. See also: http://www.technologyreview.com/view/423288/cellular-technology-that-told-japan-an-earthquake/
31 "Backchannels on the Front Lines: Emergent Uses of Social Media in the 2007 Southern California Wildfires" Jeannette Sutton, Leysia Palen and Irina Shklovski, Proceedings of the 5th International ISCRAM Conference, May 2008. See also: http://www.cs.colorado.edu/~palen/Papers/iscram08/BackchannelsISCRAM08.pdf
32 See http://www.fixmystreet.com/
33 See http://www.fixmytransport.com/
34 See http://fearsquare.com/
35 "OpenStreetMap, Crowdsourcing and the SensorWeb – An Expert Paper", Christopher Osbourne, Association for Geographic Information, 2010. See also: http://www.agi.org.uk/storage/foresight/data-technology/OpenStreetMap%20Crowdsourcing%20and%20the%20SensorWeb.pdf
36 Reuse of map as licensed under CC-BY-SA. See also http://www.openstreetmap.org/copyright/
37 See http://www.geovation.org.uk/
38 See http://www.mappiness.org.uk/
39 Data nation 2012: Our lives in data, Deloitte LLP, 2012
40 "Sharing public sector information to distribute the cost of land and asset management", Ordnance Survey. See also: http://www.ordnancesurvey.co.uk/oswebsite/docs/case-studies/hythe-and-dibden-parish-council-access-to-district-council-gis.pdf
41 "Crowdsensing in the Web: Analyzing the Citizen Experience in the Urban Space", Francisco C. Pereira, Andrea Vaccari, Fabien Giardin, Carnaven Chiu, and Carlo Ratti, in From Social Butterfly to Engaged Citizen, MIT Press, December 2011.
42 "Mobile phone data from GSM networks for traffic parameter and urban spatial pattern assessment: a review of applications and opportunities", John Steenbruggen, Maria Teresa Borzacchiello, Peter Nijkamp and Henk Scholten, GeoJournal, 2011. See also: http://www.springerlink.com/content/k0u38j25050u345h/?MUD=MP
The content of this article is intended to provide a general guide to the subject matter. Specialist advice should be sought about your specific circumstances.

