Executive summary
Since the Interim Management Statement was introduced in 2007, much of the debate and surrounding angst have focussed on the statement to be issued in the second half of the year. The first half's statement has been seen as relatively trouble-free. Companies have been accustomed to issuing a trading update around the time of their annual general meetings. So, changing that update into the first IMS has been relatively easy.
The concern around the second half's IMS has principally been one of timing. As the IMS must be issued at least six weeks before the year end, it is too early to replace the traditional pre-close statement. So the second IMS was a new announcement. Furthermore, as most UK listed companies have year ends in the December to March period, the potential effect of Christmas trading or winter weather on businesses has caused considerable thought on both the best timing for the IMS within the ten-week allowed period and the content particularly to the extent it may be seen to have predictive values.
Deloitte's previous surveys in this area have focussed principally on the IMS issued in the first six months of the year. This survey examines the second half's IMS, and compares it to the first half's IMS, producing some interesting results:
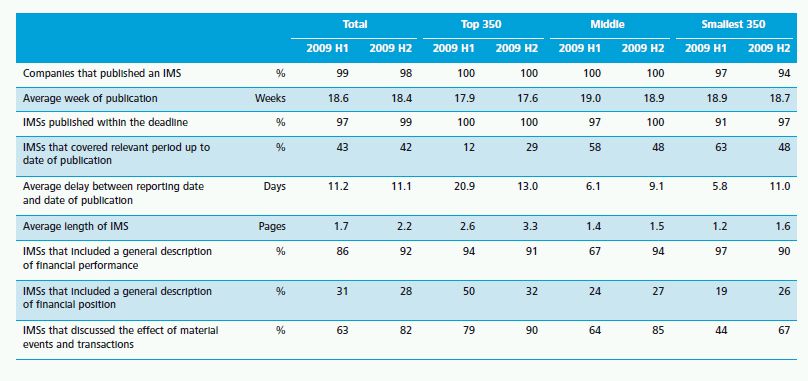
- the second IMS for corporates was typically 29% longer than the first half's, averaging 2.2 pages compared with 1.7 pages. This was caused simply by having more commentary on financial performance, position and material events and transactions. The reasons for this include that the first IMS is close in time to the production of the annual report and thus there is less news to report. A four month period is allowed for the annual report compared to two months for the half-yearly financial report. Thus there is a longer gap between that report and the second IMS and presumably more to report. In addition the sensitivities referred to above regarding proximity to the year end may cause companies to say more in the second IMS;
- only 26% of companies issued their second IMS at the same point in the six months' period as their first IMS. 35% reported earlier and 39% reported later;
- 2% of corporates (first half IMS: 1%) failed to issue a second IMS;
- overall 28% of corporates clearly met the IMS content requirements. This is a marked improvement on the first half IMS in which only 15% did so; and
- investment trusts which are considered separately in this survey continue to be the stars in compliance terms. 77% of trusts (first half IMS: 54%) clearly met the content requirements.
So what is the future of the IMS? It was introduced in 2007 to meet the requirements of the EU Transparency Obligations Directive. The European Commission launched on 28 May 2010 a Consultation Document on modernisation of the Directive, with many of the questions directed towards the impact on the smaller listed company. The comments period runs to 23 August 2010.
It is easy to be somewhat guarded about prospects for change. History is not littered with examples of requirements for corporate reporting being dropped. Furthermore, would the IMS be a candidate? Regular communication to the market is a good thing. The content requirements are not onerous although there is some scope for improving the drafting of certain rules. But if there are strong views on the utility of the statements, now is the time to be heard.
The survey
Following the introduction in 2007 of the DTR requirements for listed companies to publish bi-annual IMSs, Deloitte surveys have highlighted that companies seem to have some difficulties in implementing the new requirements. Since then, companies have clearly gained more experience in preparing IMSs and this publication details the latest survey results. But the question is whether practice has changed. In previous surveys, the focus has been on the IMS published in the first half of the year. This year's survey focuses on the second half's IMSs and compares these with those issued in the first half of the year by the same companies.
The main objectives of this survey were to consider:
- how companies met the DTR requirements in the second IMS published in the second year since its introduction;
- what information companies provided in their IMSs and how it was presented; and
- how the second year's second IMSs published compared to the second year's first IMSs.
There were, as at 26 February 2010, 1,012 fully listed UK companies which formed the population for this survey. 40% of these companies were classified by the London Stock Exchange as being in the sectors of nonequity or equity investment instruments. Due to the specialised nature of investment trusts, and the particular needs of their investors, they were treated as a separate population, consistent with other Deloitte surveys on financial reporting, and a sample of 30 of these companies was used. From the remaining population of 607 companies, a sample of 100 companies was randomly selected.
The two samples have been stratified into three categories based on market capitalisation: companies within the top 350 companies by market capitalisation, companies ranked from 351 to 662 and companies within the smallest 350 listed companies by market capitalisation.
To achieve meaningful comparisons with previous findings, the sample of companies from the Deloitte survey of preliminary announcements, Down the TRack, was used. The sample of 100 corporates contained 34, 33 and 33 companies from the top 350, middle group and smallest 350 companies respectively. The sample of 30 investment trusts included ten trusts from each category.
The next two sections, "The IMS basics" and "Content of IMSs", refer to the main sample of 100 companies excluding the investment trusts which are separately discussed in the section "Investment Trusts' IMSs" from page 14. In addition, some companies chose to provide full quarterly reports, containing, as a minimum, the primary statements and related notes as well as a management commentary. Some comments on those quarterly reports, from companies initially selected but then replaced in the above samples, are included under "Quarterly reports" (see page 19).
The IMS basics
- 98 out of 100 companies issued98 out of 100 companies issued information considered to be a second half IMS (first half IMS: 99 companies).
- 97 companies reported within the DTR time frame (first half IMS: 96 companies).
- The average length of an IMS was 2.2 pages (first half IMS: 1.7 pages).
This section considers the fundamental elements of IMS reporting such as the timing of publication, the overall structure and the length of IMSs. Comparative information from the previous Deloitte survey In Many Styles is included where relevant and relate to the IMSs published during the first half of the second year of reporting under the DTR.
DTR 4.3.2
An issuer must make public a statement by its management during the first six-month period of the financial year and another statement by its management during the second six-month period of the financial year
In the context of DTR 4.3.2. "making public" means the publication of the IMS in unedited full text via a RIS. In the sample of 100 companies surveyed:
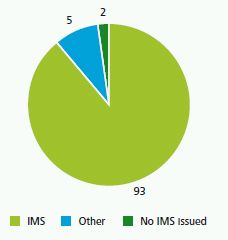
- 93 companies (first half IMS: 92 companies) published information clearly labelled as an IMS. However, six of these companies referred to this as a "Q3 IMS" or a "9 month IMS";
- five companies (first half IMS: seven companies) issued "trading updates" or similarly labelled statements which did not include "IMS" in the title; and
- two companies (first half IMS: one company) did not issue any information that could be considered to be an IMS.
Figure 1 summarises how companies labelled their IMSs.
Figure 1. How were the IMSs labelled?
The companies that did not publish any IMS information did not give any reason for their non-compliance and they have been issuing regular half-yearly financial statements and annual reports. There is no evidence that the companies' shares were suspended from trading and even if they had been suspended, this would not relieve the company from its ongoing obligations under the DTR to publish an IMS. This was confirmed by the UKLA in its May 2009 List! newsletter which states that "the obligations do not fall away during a suspension and issuers must continue to comply". As a result, the discussion of findings below relates to 98 (first half IMS: 99) IMSs being 34, 33 and 31 companies in the top 350 companies by market capitalisation, the middle group and smallest 350 companies by market capitalisation respectively.
Speed and period of reporting
DTR 4.3.3
The statement required by DTR 4.3.2R must be made in a period between ten weeks after the beginning, and six weeks before, the end of the relevant six-month period.
The DTR effectively provide companies with two periods of approximately ten weeks to publish their IMSs.
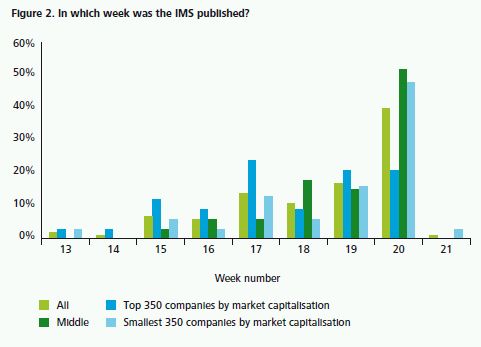
Figure 2 below illustrates in which week, since the start of the six month period, companies published their second IMSs. As expected, and in line with the findings of the previous surveys, the top 350 group of companies typically reported slightly earlier than the middle group and the smallest 350 companies.
Of the companies surveyed, 12 reported on the last day of the period specified by DTR 4.3.3. (first half IMS: 15 companies), and one company (first half IMS: three companies) reported outside the required timeframe. The company that reported late did so by one working day which may have been due to some confusion over the actual deadline.
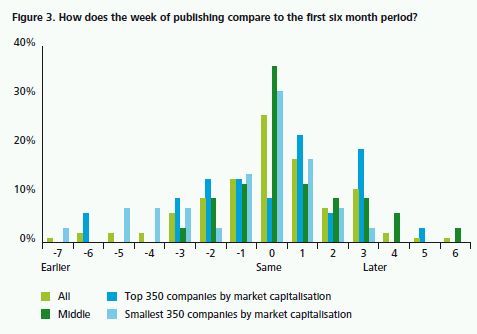
26% of companies issued their IMSs for the second six month period of the current year during the same week as they issued their first IMSs during the first six month period. 35% of companies issued their second IMS earlier than their first and 39% issued their second IMS later than their first. This is illustrated in Figure 3. This may be due to companies wishing to include information as close to the reporting deadline as possible ahead of announcing their full year results.
DTR 4.3.4
The interim management statement must contain information that covers the period between the beginning of the relevant six-month period and the date of publication of the statement
Four companies (first half IMS: one company) did not indicate the period covered by the IMS, whereas 76 companies (first half IMS: 71 companies) explicitly stated the period being reported on. The remaining 18 companies (first half IMS: 27 companies) used phrases such as "to date", "today" and "up to the date of publication".
42 companies (first half IMS: 47 companies) fully complied with DTR 4.3.4 by covering the period up until the date of publication. This includes 20 companies (first half IMS: six companies) that reported on the last working day before the date of publication of the IMS, which were considered to have met the requirement under DTR 4.3.4
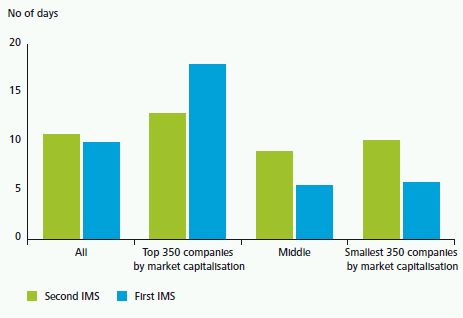
As shown in Figure 4, the average delay between the reported date in the IMS and the date of publication was 11 days (first half IMS: ten days) with the maximum delay being 49 days (first half IMS: 47 days). These figures show a slight deterioration from the first six month period's IMSs.
Consistent with the findings of previous surveys, the majority of companies with a delay between the period covered by the IMS and its publication were in the top 350 group of companies. This may be due to the size and complexity of these companies. The delay has reduced in the top 350 group but increased in the other two categories when compared with the first IMS of the period. Delays were noted for 71% of the top 350 companies (first half IMS: 87%), compared with 48% of the middle group and 39% of the smallest 350 companies (first half IMS: 33% and 34% respectively).
Many of the companies with delays discussed the results of a three month period or quarter rather than covering the period between the start of the relevant six month period and the date of publication of the statement as required by DTR 4.3.4.
Of the 42 companies covering the period up to the date of publication in their IMS, ten companies were from the top 350 group (first half IMS: five companies), 17 companies were from the middle group (first half IMS: 22 companies) and 15 companies were from the smallest 350 companies (first half IMS: 20 companies).
As discussed in the "Investment Trusts' IMSs" section (see page 14), industry guidance issued by the Association of Investment Companies (AIC) suggests that any 'gap' between the period covered by the IMS and its date of publication could be covered with a statement by the board of directors "to confirm that it is not aware of any significant events or transactions which have occurred between the 'as at' date of the financial information and the date of publication of the IMS which would have a material impact.
Figure 4. What was the average number of days delay where there was a delay between the period the IMS covered and the date it was published
This approach was taken by more than half of the investment trusts surveyed suggesting that the provision of additional guidance in this area may result in better compliance. In its review of IMSs, published in the May 2009 issue of List!, the UKLA did not include specific reference to this issue but it commented that "there would appear to be no obligation to the issuer to make any comment" if there have been no material events in the relevant period. However, to avoid confusion it is advisable for companies to state clearly if the IMS covers the period up until the date of publication.
Director involvement
There is no explicit requirement for IMSs to be signed. 52 of the companies surveyed (first half IMS: 52 companies) did not show any involvement by the board of directors in issuing the IMS. Of those that demonstrated some involvement:
- 26 companies (first half IMS: 21 companies) included a quote or statement from the Chief Executive;
- seven companies (first half IMS: 20 companies) included a quote or statement of the Chairman; and
- 13 companies (first half IMS: six companies) indicated some involvement by the Board
Length of IMSs
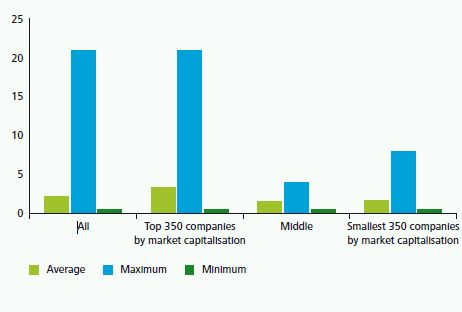
Based on the IMSs as published on the RIS, the IMSs surveyed were, on average, longer than they ever have been at 2.2 pages long (first half IMS: 1.7 pages). The IMSs ranged from half a page to 21 pages. Figure 5 shows the average, maximum and minimum number of pages of an IMS by size of company. As expected and consistent with previous surveys, the top 350 group of companies produced the longest statements.
The 29% increase in the length of the second IMS when compared to the first may be due to more time having elapsed between the publication of the half-yearly report and the publication of the second IMS than the time that passes between the publication of the annual report and financial statement and the publication of the first IMS. Additionally, companies may wish to include more detail in their second IMS as it is published before the announcement of the full year results.
Figure 5. What were the average, minimum and maximum length of IMSs?
Number of pages
Content of IMS
- 28% of companies complied with DTR 4.3.5 (first half IMS: 15% of companies).
- 92% of companies gave a general description of the financial performance of the group (first half IMS: 87% of companies).
- 29% of companies gave a general description of the financial position of the group (first half IMS: 28% of companies).
- 82% of companies disclosing material events or transactions explained their impact on the financial position of the group (first half IMS: 68% of companies).
DTR 4.3.5
The interim management statement must provide:
- an explanation of material events and transactions that have taken place during the relevant period and their impact on the financial position of the issuer and its controlled undertakings; and
- a general description of the financial position and performance of the issuer and its controlled undertakings during the relevant period
In its April 2007 List! newsletter, the UKLA explained that the broad requirements were provided on the basis that companies should be free "to choose a form of reporting appropriate to their stakeholders".
The UKLA further stated that "we continue to believe that the content of IMS will depend on the circumstances of each issuer and the markets in which it operates" and that it supports a "market-led solution where the detail of IMS are developed by market practitioners and discussed between preparers and users of the information". Following its May 2009 review of IMSs, the UKLA commented that its "view remains that individual issuers are best placed to consider the approach that they take in their IMS announcements". It concluded that "it would be counter-productive to take a more prescriptive 'one size fits all` approach".
A trend that is emerging is that the great variety of content and presentation seen from one company's IMS to another company's IMS is not seen from one period's IMS to another for the same company. In fact, 84 of the IMSs surveyed showed no significant difference in format from the IMSs published during the first half of the current year and that 85 of the IMSs showed no obvious differences in format when compared to the IMSs issued in the second half of the previous year.
The rules do not specifically require an IMS to contain any numerical data. The April 2007 issue of List! also clarified this point stating that: "We believe that IMS may not require financial data in certain circumstances. The nature, scale and complexity of the issuer may be such that it can provide a meaningful narrative description of the major events/transactions that have occurred during the relevant period and the financial position of the issuer. If this happens then numerical data may not be required." In its May 2009 List! newsletter, the UKLA stated further that it "envisaged that the use of financial data was likely to be the main approach" but that its own findings highlighted failings "to provide adequate coverage in either narrative or data".
This section considers how companies complied with these broad DTR requirements and the additional List! guidance, and whether there are any trends emerging. This assessment was performed across the following areas:
- financial performance;
- financial position;
- material events and transactions;
- going concern, liquidity and key performance indicators; and
- other information provided.
Financial performance
There were almost as many approaches in providing a general description of financial performance during the period covered by the IMS as there were companies surveyed. However, the following trends were identified.
92% of companies (first half IMS: 87% of companies) surveyed commented on financial performance to some extent. 8% of companies (first half IMS: 13% of companies) failed to comment on financial performance in any way.
57% of companies (first half IMS: 57% of companies) gave a brief description of revenue levels, often combined with other measures associated with financial performance such as gross profit and operating profit, taxes, dividends, EBITDA or transaction volumes. Generally, the information provided by these companies was understandable not only to those familiar with the company, but also to other market participants without any prior knowledge of the company.
8% of companies (first half IMS: 4% of companies) briefly commented on profit, for example:
"Based on current trading and forecasts, the Board expects profit (before amortisation of acquired intangibles) for the full year to be higher than the top of the range of market expectations. The Board believes the current range of market expectations is £78.9million to £82.1million (2008/09 profit before amortisation of acquired intangibles: £79.1million)." Halma PLC – Interim Management Statement,
When making this type of statement, care must be taken to make the information useful to all readers, not just informed readers with prior knowledge of the company. The UKLA raised this as an issue in its May 2009 List! newsletter, noting that information provided on financial statements should be meaningful. It commented that in comparing to expectations, companies "should be careful to refer to verifiable (that is, publically stated) expectations". It also concluded that "unless the company clarifies what these expectations relate to, such as management expectations from previous reports, analyst or market expectations etc, it risks that information not being meaningful to the reader".
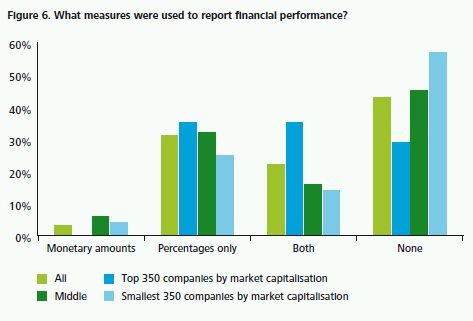
57% of companies (first half IMS: 58% of companies) provided numerical information expressed as a percentage, an absolute number or both. Three companies (first half IMS: three companies) gave only absolute figures. The remaining 43% of companies (first half IMS: 42% of companies) gave their general description of the financial performance of the company using only narrative. The use of numerical information by size of company is summarised in Figure 6 below
Financial position
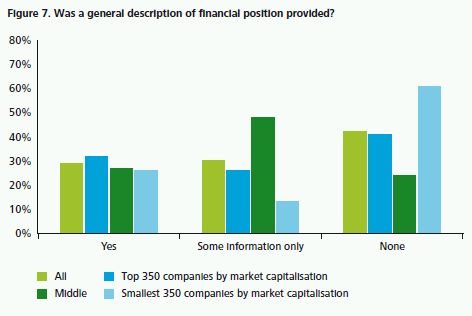
While most IMSs included some information on the financial performance of the company, only 29% of companies (first half IMS: 28% of companies) met the requirement to provide a general description of the financial position of the company. The low level of compliance in this area has been seen in all of the previous Deloitte IMS surveys.
Of the 29% of companies that provided a general description of the financial position:
- 43% (first half IMS: 75%) provided a description of the financial position in combination with financial data with statements such as:
"RM's financial position remains strong and the Group's cash balances are tracking management's plan for the year.
The Group has in place a five-year, £25m committed bank facility with HSBC, which has four years left to run, and additional working capital facilities totalling £33m. Total net bank borrowings at 30 June 2009 were £8.1m, including £8.1m drawn under the five-year bank facility relating to the acquisitions of Easytrace, Computrac and ISIS Concepts." RM plc – Interim Management Statement
- 57% of those companies (first half IMS: 25% of those companies) made a statement about the financial position of the company without providing any financial data, for example:
"There have been no material changes to our financial position since 23 November 2009." MITIE plc – Imterim Management Statement
30% of the companies that prepared an IMS (first half IMS: 47% of companies) provided limited information on individual balance sheet items, commonly cash or net debt, for example:
"At the end of September, Cobham's net debt had increased to £468 million (30 June 2009: £442 million). This was primarily due to ..." Cobham PLC – Interim Management Statement
The remaining 42% of companies (first half IMS: 24% of companies) did not give any information about the financial position of the company and therefore failed to comply with the relevant requirement.
Figure 7 summarises the type of information provided by companies on their financial position, if any, by size
The above findings are consistent with the findings of the UKLA, as published in the May 2009 List! newsletter, where it stated that "this is the weakest area of compliance within the IMS obligations" as "the majority of IMS did not adequately deal with the financial position requirement, with many containing no information on, or even mentioning, the issuer's financial position".
Material events and transactions
63% of companies (first half IMS: 92% of companies) discussed transactions or events that occurred during the period in their IMSs. Consistent with prior years, it was assumed that any event or transaction mentioned in the IMS was material. There has been a significant reduction in the number of material events or transactions reported during the second half of the year. This may be due to an unusually high number of material events or transactions during the first half of the year as a result of the economic conditions.
82% of the companies disclosing material events and transactions went on to give some explanation of the impact of the events or transactions (first half IMS: 68% of companies). This shows a significant improvement in companies meeting the DTR 4.3.5 requirement. The explanation of the impact of the material event or transaction typically included details of the financial impact in absolute terms or, to a lesser extent, as a percentage movement. Common types of material events and transactions discussed included:
- acquisition of new business;
- discontinued operations;
- new business or contract wins;
- restructuring;
- new products; and
- rights issues.
Examples include:
"In Global Procurement, National Australia Group Europe (NAGE) has agreed a four-year contract commencing in October 2009 to increase the potential level of addressable spend managed by Xchanging by up to £100 million per year. Xchanging will continue to offer a full suite of Sourcing and Procure to Pay services to NAGE, which it has done since July 2006 when NAGE first became a customer."
Xchanging PLC – Interim Management Statement
"Our successful Rights Issue raised £35.3 million (net of expenses)."
Brammer PLC – Interim Management Statement
"The closure of London Taxis North America ('LTNA') was completed as planned in August. At 30 June the net assets of LTNA were £0.8m of which £0.4m has been converted into cash and there will be a £0.4m exceptional asset impairment in the second half." Manganese Bronze Holdings PLC – Interim Management Statement.
Of the remaining 37% of companies that did not disclose material events or transactions (first half IMS: 8% of companies), only one company (first half IMS: no companies) stated that there were no material events or transactions during the period covered by the IMS. The remaining companies did not discuss material events or transactions in their IMSs. In its May 2009 newsletter List!, the UKLA states that "there would appear to be no obligation on the issuer to make any comment" if there have been no material events or transactions in the relevant period. However, it might be helpful to include such a statement to demonstrate compliance with the requirements of DTR 4.3.5(a).
Going concern, liquidity and key performance indicators
The FRC's guidance on Going Concern and Liquidity Risk: Guidance for Directors of UK Companies 2009 was issued in October 2009. In light of this guidance and the current economic climate, it might be expected that companies comment, at least briefly, on going concern in their IMSs. Two companies, (first half IMS: one company) commented explicitly on going concern.
The FRC Guidance does not discuss IMSs. That noted, companies may wish to consider whether an update on the going concern disclosures provided in the most recent set of half-yearly or final financial statements would be useful to readers of their IMSs. Similarly, if those going concern disclosures published remain valid as at the date of publication of the IMS, a statement to that effect may be considered to be useful information.
Although not a specific requirement, more information was provided in IMSs on liquidity and cash flow, with 7% of companies (first half IMS: 5% of companies) specifically commentating on liquidity. Such comments included:
"The Company expects to have sufficient cash resources to at least mid 2010."
Phytopharm PLC – Interim Management Statement
In the Deloitte survey of preliminary announcements, Down the TRack, it was noted that five companies stated that they expected their audit reports to contain an emphasis of matter in respect of going concern and another two companies stated that modified audit reports were anticipated in respect of going concern. None of these seven companies mentioned going concern in the IMSs which were published prior to the release of their preliminary announcements.
Information provided on key performance indicators, specifically labelled as such, was provided by 2% of companies (first half IMS: 2% of companies).
Other information provided
Some companies chose to provide additional information in their IMSs such as non-financial data, forward-looking statements and related disclaimers, as well as references to risks and uncertainties.
Non-financial data
66% of companies (first half IMS: 47% of companies) presented non-financial data in their IMSs to supplement the financial data presented. The nature of items included was on matters such as:
- store numbers;
- employee numbers;
- new customer contracts; and
- customer renewal rates.
Forward-looking statements
Although the publication of forward-looking information is not an IMS requirement, 84% of companies (first half IMS: 76% of companies) included comments about the future. The forward-looking information was incorporated into the text of the IMS by most companies, with 29% of companies (first half IMS: 19% of companies) including a separate Outlook section.
Figure 8 illustrates the nature of the information provided.
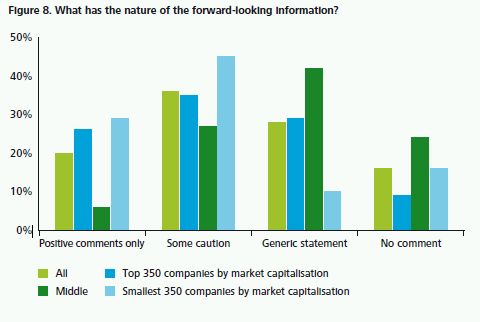
36% of companies (first half IMS: 44% of companies) included some cautionary statements regarding the future outlook of operations.
"While we are confident of the longer term prospects for the Group and our expectations for the full year remain unchanged, we remain very cautious over the near-term due to the lack of forward visibility on trading outlook."
Punch Taverns PLC – Interim Management Statement
28% of companies (first half IMS: 5% of companies) made some generic comments, neither positive nor cautionary, about the future.
"The Board expect profits to be in line with market expectations ..."
BSS Group PLC – Interim Management Statement
20% of companies (first half IMS: 27% of companies) included only positive statements about the future.
Performance in the third quarter had been good and we have confidence in the strength of our unique proposition."
WM Morrison Supermarkets PLC – Q3 Interim Management Statement
16% of companies (first half IMS: 24% of companies) did not include any forward-looking information
Disclaimers In line with the findings reported in previous surveys, 29 companies (first half IMS: 23 companies) included some form of a disclaimer statement in their IMSs, clarifying that the forward-looking statements were made in good faith and should be treated with caution due to the inherent uncertainties which underlie such forward-looking information.
"This report includes statements that are forward looking in nature. Forward looking statements involve known and unknown risks, assumptions, uncertainties and other factors which may cause the actual results, performance or achievements of the Group to be materially different from any future results, performance or achievements expressed or implied by such forward looking statements. Except as required by the Listing Rules, Disclosure and Transparency Rules and applicable law, the Company undertakes no obligation to update, revise or change any forward looking statements to reflect events or developments occurring after the date of this report."
Speedy Hire PLC – Interim Management Statement
Compliance
Overall, 28% of companies (first half IMS: 15% of companies) met all of the content requirements of an IMS as specified by DTR 4.3.5. All of these companies reported within the ten week window provided by the DTR. 63% of these companies (first half IMS: 13% of these companies) included information up to the date of publication. 37% of these companies were from the top 350 group of companies, 33% were from the middle group and the remaining 30% were from the smallest 350 group of companies. This is a significant improvement from the previous survey suggesting that an increased focus on the requirements around the date of publication and the period covered has led to greatly improved compliance. However, there is still room for improvement.
Comparison with IMSs published in the first half of the year
This section summarises how compliance with the IMS requirements in the second half of the current year compared to the first half.
Of the companies that were surveyed, 84 published an IMS with no obvious differences between the format of the second IMS published and the IMS published during the first half of the current year. For the other IMSs, common differences were the inclusion or omission of headings and/or sections to discuss events or transactions that occurred during the period.
There is a notable difference in the length of these second IMSs when compared to the first IMSs, but not in the format of the IMS, suggesting that more information is being given on the same points by companies in the second IMS rather than additional types of information being included.
Investment trusts' IMSs
- 77% of trusts complied with DTR 4.3.5 (first half IMS: 54% of trusts).
- 83% of trusts reported within the DTR time frame (first half IMS: 96%).
- The average length of an IMS was 2.9 pages (first half IMS: 2.2 pages
Over 400 of the companies listed on the main market are investment trusts. For the purpose of this survey, investment trusts are defined as those companies classified by the London Stock Exchange as being in the equity and non-equity investment instruments sectors, but excluding real estate investment trusts and investment type companies in other sectors. A random sample of 30 investment trusts was selected, being ten companies from each of the top 350 companies by market capitalisation, the middle group and the smallest 350 companies by market capitalisation. This section examines the survey findings on the IMSs published during the second half of the trusts' second year of reporting under the DTR. Comparative information from the previous Deloitte survey In Many Styles is included where relevant and relate to the IMSs published during the first half of the trusts' second year of reporting under the DTR.
All 30 of the investment trusts selected published IMS information (first half IMS: 28 investment trusts).
In April 2007, the AIC published technical guidance on issues and considerations specific to investment companies in preparing their IMSs. This guidance is available on the AIC website and relevant key points are included below, where appropriate.
Signature and indicators of director involvement
There is no explicit requirement for the IMS to be signed and 18 of the IMSs surveyed did not contain any signature or quotes from directors, (first half IMS: 16 IMSs). Of the remaining 12 trusts, eight IMSs contained signatures from the company secretary, three were issued by order of the Board and one contained a statement from the Chairman.
Speed and period of reporting
DTR 4.3.3
The statement required by DTR 4.3.2R must be made in a period between ten weeks after the beginning, and six weeks before, the end of the relevant six-month period.
83% of trusts published their IMSs within the ten week window specified by the DTR (first half IMS: 96%). The five IMSs that were published after the DTR deadline passed were published up to two weeks after the deadline.
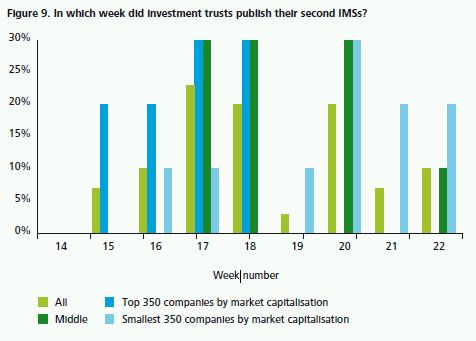
The second IMSs were published, on average, 18 weeks into the second half of the financial year (first half IMS: 18 weeks). In line with the findings from the corporates, trusts from the top 350 group tended to publish their IMSs earlier, on average during week 16. This compares to the middle group publishing their IMSs during week 18 on average and the smallest 350 trusts publishing their IMSs during week 19 on average. This is shown in figure 9
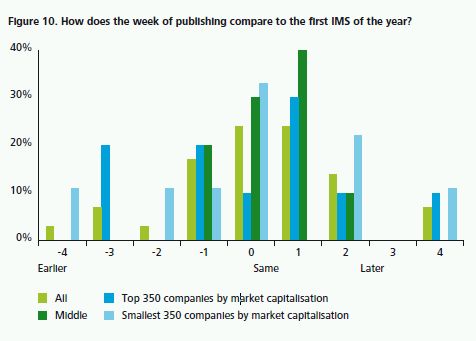
The time taken to report is in line with the first half of the year with 24% of trusts making their second IMSs public in the same week as their first IMS of the year, 31% of trusts published their second IMSs earlier than their first, and 45% published their second IMSs later than their first.
Figure 10 below illustrates how the week of publishing the second IMS compares to the week that the first IMS of the year was published
DTR 4.3.4
The interim management statement must contain information that covers the period between the beginning of the relevant six-month period and the date of publication of the statement.
17 of the IMSs (57%) explicitly covered the period up until the date of publication of the IMS.
Eleven of these IMSs reported on the three month period with additional statements to confirm that the IMS covered the period up until the date of publication, for example:
"This statement aims to give an indication of material events and transactions that have taken place during the period from 1 April 2009 to the date of publication of this statement and their impact on the financial position of Electra Private Equity Plc." Electra Private Equity Plc. – Interim Management Statement
Six IMSs covered the period up to the date of publication without reporting on a specific quarter, for example:
"This interim management statement relates to the period from 1 July 2009 to the date of publication of this statement and has been prepared solely to provide additional information in order to meet the relevant requirement of the UK Listing Authority's Disclosure and Transparency Rules ..." Dexion Equity Alternative Limited – Interim Management Statement
The remaining 13 trusts reported on a specific period, for example the three months to 30 September 2009, and did not include any reference to information covering the period to the date of publication of the IMS. This 'gap' was on average 28 days (first half IMS: 21 days), with a range of five days to 56 days (first half IMS: four days to 47 days)
The AIC guidance suggests that any 'gap' between the end of such a specified period and the date of publication of the IMS may be covered with a statement by the Board "to confirm that it is not aware of any significant events or transactions which have occurred between the 'as at' date of the financial information and the date of publication of the IMS which would have a material impact".
Length of IMSs
The IMSs of investment trusts were on average 2.9 pages long, up from 2.2 pages during the first half of the year, and ranged from 1.5 pages to 11 pages. The average length from both the top 350 trusts and the smallest 350 was 2.4 pages while the middle group had an average of 3.7 pages.
The 32% increase in the length of the second IMS when compared to the first was also seen with the corporate IMSs and may be due to companies wishing to include more detail in their second IMS as it is published before the announcement of the full year results or that they feel that more detail is appropriate given the length of time that has passed since they published their half-yearly financial statements or a combination of both.
Content of IMSs
The content of the IMSs issued by the investment trusts were reviewed to assess compliance with the DTR requirements.
DTR 4.3.5
The interim management statement must provide:
(1) an explanation of material events and transactions that have taken place during the relevant period and their impact on the financial position of the issuer and its controlled undertakings, and
(2) a general description of the financial position and performance of the issuer and its controlled undertakings during the relevant period
Financial performance
The AIC guidance states that "the most likely measures which will be used are share price total return and NAV total return". The guidance further suggests that "performance of the benchmark" is likely to be given and that "information on share price and discount movement is highly valued by investors".
How the IMSs provided information on the financial performance during the period covered is summarised in Figure 11.
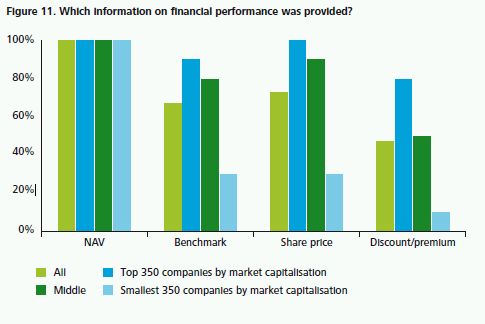
100% of IMSs (first half IMS: 100%) included information that clearly represented a general description of the financial performance.
All IMSs contained some information about NAV.
Benchmark information was given by 67% of the investment trusts. 90% of companies providing benchmark information did so as a percentage change to the benchmarked index. The remaining 10% included the monetary value of the benchmark in addition to the percentage change.
73% of trusts included information on the trusts' share price. 77% of trusts including share price information included both the share price as at a date and the percentage change over a certain period. 18% of trusts included only the information as at a date and the remaining 5% of trusts included only information on the percentage change over a certain period. DTR 4.3.5 The interim management statement must provide: (1) an explanation of material events and transactions that have taken place during the relevant period and their impact on the financial position of the issuer and its controlled undertakings, and (2) a general description of the financial position and performance of the issuer and its controlled undertakings during the relevant period.
To read this document in its entirety please click here.
The content of this article is intended to provide a general guide to the subject matter. Specialist advice should be sought about your specific circumstances.

