Key facts
-
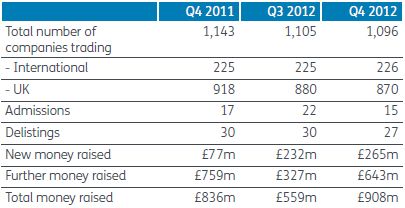
Number of companies trading on AIM as at 31 December 2012 1,096
-
Total funds raised on AIM in three months to 31 December 2012 £908m
-
Number of companies trading on Main Market as at 31 December 2012 1,327
-
Total funds raised on Main Market in three months to 31 December 2012 £4,122m

Market commentary
AIM
-
Number of listed companies has decreased in Q4 2012.
-
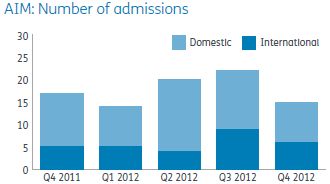
The number of admissions in Q4 2012 has decreased to 15 from 17 in Q4 2011.
-
Number of companies on AIM is at a similar level as March 2005.
-
Average market cap of an AIM company increased to £56.3m in December 2012 from £54.6m at the end of September 2012. This has increased from £54.4m at the end of December 2011.
Market movements
-
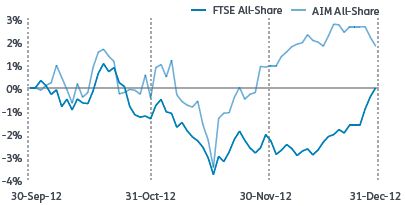
FTSE AIM All-Share Index increased 0.2% in Q4 2012 to 707.2 (4.5% increase in Q3 2012)
Summary statistics

Main market
-
There has been a decrease in new money raised from £3,240m in Q3 2012 to £2,727m in Q4 2012.
-
The number of companies has fallen from 1,338 at 30 September 2012 to 1,327 at 31 December 2012.
-
The amount of further money raised has increased from £232m in Q3 2012 to £1,395m in Q4 2012.
Market movements
- FTSE All-Share increased 3.1% in Q4 2012 (3.7% increase in Q3 2012).

Summary statistics

Relative changes in indices
Conclusions
The AIM market saw a decrease in admissions in Q4 2012 but a 14.2% increase in new money raised compared to Q3 2012. The amount of money raised from further issues in Q4 2012 doubled from the previous quarter although it is still below Q1 2012 levels. The AIM All-Share index increased 0.2% to 707 during the quarter, which is down 3.7% from the start of 2012. In 2012, the total number of admissions was 71 and total monies raised was £3.1bn, which compare with 90 admissions and £4.3bn raised in 2011.
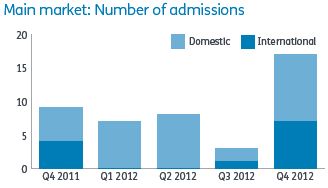
On the Main Market, the money raised has increased to £4.1bn, which is over 4 times greater than the money raised in Q4 2011 and there were 17 new admissions raising £2.7bn in the quarter. The FTSE All-Share index increased by 3.1% during the quarter and 6.3% in 2012.
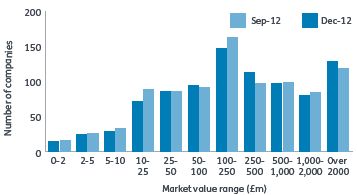
Figures in the tables and graphs above are derived from the monthly market statistics published by the London Stock Exchange.
The content of this article is intended to provide a general guide to the subject matter. Specialist advice should be sought about your specific circumstances.

