
This article first appeared in the newly released book from NERA Economic Consulting, 'The Line in the Sand: The Shifting Boundary Between Markets and Regulation in Network Industries'. With a foreword by Alfred E Kahn.
I. INTRODUCTION
This chapter shifts the emphasis away from the energy sector to consider application of economic techniques to another sector of the economy, albeit one that is a major user of energy, namely the transport sector. In particular, we consider how economists have advocated use of economic techniques to optimise use of transport capacity. Transport capacity is expensive to install and is generally fixed in the short run, so it is important that best use be made of capacity. Demand for use of capacity varies in time, peaking at certain times of the day, week, and/or year with low demand in periods in between. At peak, demand for travel or freight transport may exceed capacity, and so some rationing device is needed. In practice this rationing device is most commonly congestion: Users of the capacity impede each other’s progress, so that their own costs rise. In some cases such as the "bottleneck" case in highways, physical capacity in terms of the number of road vehicles that can pass a fixed point in a given period may actually fall.
Decision makers, both in public bodies such as highway authorities and in private transport companies such as railroads or bus companies, will continually need to consider whether they are operating the right level of capacity, or whether they should expand capacity through investment in new highway lanes or new railroad tracks or new buses. In making these decisions, they will use investment criteria that compare expected future benefits with expected future costs. Public bodies are likely to consider social costs and benefits, using some form of cost-benefit analysis or multi-criteria analysis, while private firms are likely to concentrate on the impact on expected future profitability. But whatever the investment criteria, the expected value of benefits will depend on the expected future use of the improved facility, and this in turn will depend on the prices that will be charged to use the capacity, that is, the road tolls, rail freight charges, bus fares, etc. In turn, the prices and other mechanisms to allocate capacity will determine how well the facility is used and how well it provides benefits both to operators of the infrastructure and to its users.
The theme of this chapter is the different ways to achieve optimal use of existing transport infrastructure. We consider use of three different types of transport infrastructure, highways, airports, and railroad tracks, and consider the alternative mechanisms recommended by economists. In doing so, we need to identify the physical coordination problems and take account of the nature of the decision makers involved in the market place.
In the highway sector, there are large numbers of individual decision makers—individual car, truck, van, and bus drivers—who make their own decisions within a framework of traffic rules, speed limits, and some limited physical coordination from automatic traffic signals. The rules of the road have grown up over many years, and this mechanism works well as long as traffic levels are not so high that individual vehicles impede each other’s progress. But once they do and congestion sets in, then this mechanism works less well since individual decision makers have no incentive to take into account the costs that their actions impose on other road users.
In the airports sector, decisions cannot be left to individual vehicle operators. There have to be mechanisms to ensure physical separation of aircraft, both on the ground and in the air. Airlines are obliged to operate within air traffic control systems and regulations, and individual airports operate systems to allocate the take-off and landing slots and the terminal and remote stands to the different airlines using their facilities. Where demand for airspace and facilities exceed capacity, mechanisms need to allocate capacity among competing potential users. In general, allocation and use of capacity must be agreed in advance, though with sufficient operational flexibility to deal with day-to-day variations in schedules as flights vary from scheduled times.
Finally, the problems of physical coordination appear to be greatest in the rail sector. From the very earliest days of the railway, it was realised that infrastructure and operations needed to be coordinated within vertically integrated organisations that combined operation of the track and signalling with operation of trains. This coordination could achieve safe operation of different trains on each company’s network while also enabling the company to plan the operation of different types of trains to ensure that more profitable operations received priority over less profitable ones. This model of rail operation is the one that persists to the present in North America, but it has increasingly been superseded in Europe and Australia by a model based on vertical separation, with different train operators on the same network, and with priorities and payment for the use of the network at least partly established through a price mechanism.
The purpose of the rest of this chapter is to explain how economic mechanisms can contribute to determining best use of transport capacity in the different circumstances faced in these three different parts of the transport sector.
II. CHARGING FOR HIGHWAY USE IN CONGESTED CONDITIONS
A. Principles of Highway Congestion Charging
Highway congestion is a serious problem around the world, both in major towns and cities and on the highway network. Congestion is a classic example of what economists call externalities. By their actions, economic agents impose costs on others, which they ignore because they are not required to pay compensation. As a result, their level of activity will be higher than that which is economically efficient.
This happens in road transport because the capacity of any highway is limited. When traffic levels are low, additional vehicles will be able to join the traffic flow without getting in the way of existing vehicles, so that the average speed of the traffic will not be affected as the traffic flow rises (measured, for example, in vehicles per lane per hour). But eventually, when traffic flow exceeds what is termed the maximum free-flow traffic level, the addition of an extra vehicle to the flow will impose delays on the other vehicles, so that average traffic speed will fall. The average travel time per trip increases (and time has a value) while operating costs such as fuel use may also rise under "stop-start" driving conditions.
All this means that the observed traffic flow will exceed the economic optimum where the additional value of an extra trip as measured by the demand curve equals the marginal social cost of each extra trip. The marginal social cost of an extra trip includes the marginal private cost borne by the road user, plus the external cost that the marginal road user imposes on all other road users. Ignoring environmental costs such as noise or air pollution, this external cost is equal to the increase in the cost per trip of each existing road user multiplied by the number of vehicles in the flow suffering this extra congestion cost.
For many years, economists have advocated the use of congestion charges to bring marginal social costs and marginal private costs into balance, not to eliminate congestion but to achieve economically efficient levels of congestion. For this to work, we need to measure the extra costs of congestion, in particular by providing a value for travel time, but also (with the help of highway engineers) the way in which increases in traffic flow on a particular type of road or through a particular type of junction reduce overall traffic speeds and increase vehicle operating costs.
The theory of highway congestion charging was set out in a 1961 paper by Alan Walters in the journal Econometrica.1 The British Government took up the idea soon after setting up the Smeed Committee chaired by Reuben Smeed, a distinguished highway engineer. In 1963 this Committee found that road pricing was "technically feasible and economically desirable," and advocated a system of congestion charging in London. After 40 years and much intervening debate, in February 2003 the Mayor of London introduced a daily congestion charge in central London. In the meantime, a more sophisticated form of electronic metering had been introduced in Singapore, and cities in Scandinavia had introduced less sophisticated cordon charging systems.
In order to understand both the technical arguments for road congestion charging and the slow rate of introduction, it is useful to set out the economic logic of the approach and a clear explanation of who gains and who loses from the introduction of a congestion charging mechanism.
Figure 1 illustrates the basic economic theory. The horizontal axis of the two diagrams shows traffic flow per hour per lane on a road. The top part shows an engineering relationship known as a speed-flow curve for the highway. This is initially flat for lower levels of traffic flow (F) as speed (v0) is not affected as additional vehicles join the flow. But then at higher flows speeds decline and the curve slopes downwards, eventually becoming very steep as the maximum capacity of the road is reached.
Figure 1
Road Congestion Charging Model
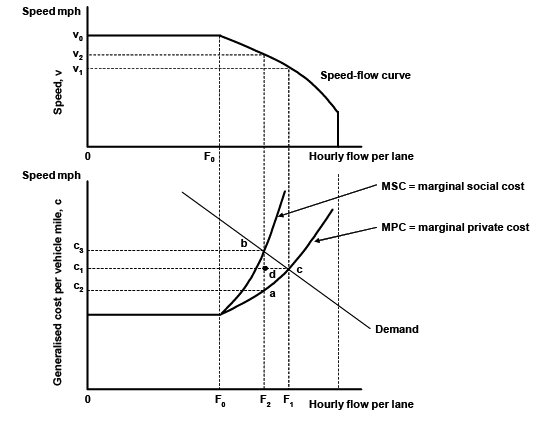
Once the maximum free-flow speed is reached, average speeds fall and travel time increases so that the "generalised cost" per trip, including both time and operating costs rises. Thus, beyond flow F0, the average cost per trip or the marginal private cost per trip (MPC) rises. Each road user will travel as long as their own (private) benefit from making the trip exceeds their own private cost, so that the traffic flow equilibrium will be at flow F1, where the demand curve crosses the MPC curve. However, this is not the economically efficient flow, because the marginal trip at flow F1 imposes a greater cost on all road users than the benefit to the marginal road user. The optimal flow is at flow level F2, where the marginal social cost curve, including both private and congestion costs, cuts the demand curve. This can be achieved by imposing a charge equal to ab on each vehicle using the road.
There are real benefits of such a solution. The resource cost (made up of time and other resources like fuel) of each trip falls from c1 to c2. This creates a real resource saving benefit equal to area c2c1da.
On the other hand, traffic flow falls from F1 to F2, and those users who are dissuaded from using the road because of the toll suffer a loss of "consumer surplus" equal to area dbc. In addition, road users as a group are worse off because the total cost they pay per trip, including the charge, rises from c1 to c3, so they suffer a loss of consumer surplus equal to area c1c3bc. The agency implementing the charge incurs the real costs of administering the charge (not shown on the diagram), but gains the toll revenue (which is equal to area c2c3ba), which might be spent on transport (for example, improving transit to give car users an alternative) or in other sectors of the economy or to reduce other parts of the tax burden on individuals.
B. Congestion Charging in London
Transport for London (TfL), the agency reporting to the Mayor and responsible for transport services in London, introduced a congestion charge in February 2003. The charge is levied in a 22 square km (8.5 square miles) central zone encompassing the City of London (the financial district) and the West End (which includes the Oxford Street shopping area and theatreland). Vehicles entering or travelling in the zone on weekdays between 7:00 a.m. and 6:30 p.m. are subject to the daily charge that was originally set at £5 a day ($9) and was then Road Congestion Charging Model increased to £8 a day ($15) in July 2005. The charge can be paid without penalty up to 10 p.m. on the day of travel at a garage or store, or by telephone, SMS text messaging, on-line, or interactive voice response (IVR). However, many types of vehicles and users are exempt, including taxis, buses, vehicles with a disabled sticker, motorcycles and scooters, and emergency vehicles. In addition residents of the central zone are able to purchase a weekly ticket at effectively a 90 percent discount.
Enforcement is by cameras and licence plate recognition. On purchasing a ticket a user provides the vehicle registration number. The registration numbers of vehicles travelling in the charging zone during the charging period are recorded, and penalty payment notices are sent to owners of vehicles not recorded as having paid the charge or being exempt. The standard penalty is £100, or £50 if the charge is paid within 14 days (and £150 if not paid within 28 days).
Before the charge was introduced, there was concern that car users would not have an acceptable alternative means of transport (which would in turn reduce the elasticity of demand for car travel and hence the effectiveness of the scheme in reducing traffic). So steps were taken to improve public transport. London has an extensive underground/subway system, but lines into central London were already heavily used in peak hours. Therefore, the main emphasis was on improving bus services,2 which would also benefit once congestion charging was in place because reductions in traffic flow levels would improve traffic speeds. In addition, improving bus services would encourage some shorter-distance subway passengers to transfer onto buses and so free up some underground capacity for use by longer-distance travellers transferring from cars as a result of the congestion charge. In addition to investment in alternative modes, there was extensive preparatory work in signing the congestion zone so that road users would be aware of where they could pay, and in remodelling junctions on the inner ring road on which charges would not be paid.3
Congestion charging is widely considered a success.4 It has reduced traffic flows in central London, resulting in increased average speeds. The evidence suggests that this reduction in traffic was real, and congestion was not simply moved around to other parts of London. TfL’s detailed monitoring programme has shown that:
- Traffic flows have fallen. In both 2003 and 2004, traffic entering the charging area was 18 percent below what it had been in 2002, the last year before the charge was introduced. But car traffic between 2002 and 2003 fell by a third, while numbers of taxis increased by 17 percent and buses by 23 percent. Traffic on the inner ring road was higher in 2003 than it had been in 2002, but fell slightly between 2003 and 2004.
- Congestion within the charging zone, measured by the difference between travel time at night when roads are uncongested and travel time in the charging period fell by 30 percent compared with 2002. The main impact seems to have been achieved through reduced queuing time at junctions. Congestion in the periods before and after the charging period have been reduced, and has also fallen (though more in 2003 than in 2004) on the inner ring road5 and on main radial routes into central London.
- Travel by bus has increased in London. People entering the central zone by bus increased 37 percent between 2002 and 2003. Up to a half of this increase was due to the introduction of the congestion charge, but reliability of bus services into the central zone has also increased partly as a result of freer traffic flow conditions.
- Road accidents and emissions of key traffic pollutants such as NOx and particulate matter have been reduced.
- Residents and others in the charging zone are generally positive about the changes in their local area as a result of the scheme, particularly the reduction in congestion but also improvements in air quality, noise, traffic levels, and public transport provision.
- Despite concerns expressed by some central London retailers about loss of business as a result of the charge, the net impact of the scheme on the London economy appears to have been broadly neutral.
After payment of operating costs, the scheme generated net revenues of £97 million in 2004/05 (total revenue was £190 million, costs £93 million), most of which was spent on improving bus services.6
Furthermore, the Mayor, who had staked his personal reputation on the charge, was reelected in June 2004. Finally, from 2007, the existing zone is being extended westwards to Kensington and Chelsea, doubling the size of the zone, and further testifying to the perceived success of the scheme.
C. NERA’s Work on Congestion Charging
NERA has contributed to the development of congestion charging in Great Britain at two levels. First, we designed a national system of congestion charging on the road network in England for the Government’s think-tank, the Commission for Integrated Transport (CfIT), to show how congestion charging might reduce traffic flows, increase speeds, and generate benefits on what has been acknowledged to be one of the most congested road networks in Europe. Second, we helped Transport for London assess how extension of congestion charging across London would generate additional benefits above those in the existing central area scheme.
In both these applications, NERA has developed models based directly on the framework set out in Figure II.1 to show both the optimal congestion charges and the effect of particular charge levels on particular types of roads and at particular times of the day or week. These charges are based on charges per vehicle-mile, rather the existing London Congestion Charge, which is based on the cost of travelling in a particular area. Consequently, the congestion charges in the NERA models are more closely related to actual congestion imposed by vehicle use.
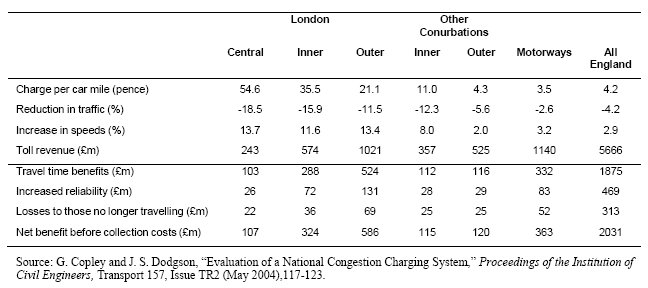
Table 1 shows some results of our work at the national level.
Table 1
Impact of a National System of Road Congestion Charges in England
The NERA technical study for CfIT in 2002 was important in changing the public and political debate in the UK surrounding paying for road use. While there has been a clear national consensus regarding the problem of congested roads in the UK for a number of years, the policy solutions to this issue have historically focussed on the supply-side and the building of new road capacity. NERA’s study helped CfIT refocus the national debate on the need for a more balanced approach that acknowledges that building more roads is not a sustainable solution and that measures need to be taken to ensure that car users think seriously about their levels of use. Following publication of the study, momentum in the debate has grown and has been bolstered by the widely held view that the Central London congestion charge has been a success. In the summer of 2004, the UK Department for Transport took an important step forward in the national debate by publishing its Road Pricing Feasibility Study, which examined how a scheme may work and the challenges it would face. Importantly, the study suggested that a national scheme could be feasible in 10 years’ time.
Since the publication of the feasibility study, the Department has made it clear that it considers road charging to be an important component of its proposed approaches to tackle congestion on roads in the UK. To support this position and to further the political argument, the Government has actively engaged with local government by encouraging them to adopt sub-national schemes in their jurisdictions. Through the Transport Innovation Fund, central government has provided local authorities with funding to pursue the kind of successful policies that appear to have worked in central London.
In addition to our work for CfIT on a national charging system, NERA developed a model for Transport for London of the indicative impacts of congestion charging on traffic levels across London. This model, known as SOCCAR, provides TfL a user-friendly means for understanding the impact of particular charging levels on different road types and in different time periods in the central area charging zone, inner London, and outer London. The model has helped TfL study potential future charging scenarios alongside their assessments of possible new technologies for congestion charging. For example, TfL has produced the following illustration: The introduction of charges of about £1 per mile in central London, about 50 pence per mile in inner London, and about 25 pence per mile in outer London could reduce congestion across Greater London by up to 40 percent.
III. USING MARKET MECHANISMS TO ALLOCATE AIRPORT SLOTS
A. The Problem of Congestion at Airports
Large urban areas generate substantial demand for air travel. But the noise and pollution that it creates means that nearby residents typically oppose plans to increase airport capacity so that airports close to urban areas are often congested. Some congestion is inevitable. Even airports that have excess capacity for much of the time can experience severe congestion. Like other forms of transport, demand for air travel is highly peaked so airports may operate close to capacity for just a few hours a day and have low demand at other times. In such circumstances, a major expansion of infrastructure or facilities may not be financially or economically justified.
Where capacity is scarce, unrestricted access to airports would result in aircraft queuing and the potential for long delays. In practice, serious delays are usually avoided because access to airports is rationed by allocating airport capacity (slots) to specified flights, typically according to administrative criteria. In particular, airlines are ordinarily entitled to retain the slots that they have used in the previous season.
Thus, airlines impose costs on other airlines through their use of the facilities – either in the form of delays or by preventing other airlines from accessing the airport. As airport charges do not reflect such externalities, allocation of capacity can be suboptimal. In this section we consider how airport capacity can be allocated efficiently in theory, and how this can best be achieved in practice.
B. Efficient Allocation of Airport Capacity
Figure 2 illustrates how airport capacity may be allocated. The figure shows three curves:
- The demand for use of the airport.
- The marginal private cost borne by each airline using the airport, consisting of airport charges (reflecting the cost of airport infrastructure and services), the airline’s own internal costs (staff time, etc.), and the costs an airline bears as a result of delays occurring at the airport.
- The marginal social cost of an additional aircraft using the airport. This differs from the private cost because it also includes the external costs that each aircraft imposes on other aircraft in the form of delays, as well as the costs it imposes on wider society, for example, in the form of noise pollution.
In the absence of capacity charging or rationing, the problem is analogous to highway congestion. Unconstrained demand Qu would occur where the demand curve crosses the marginal private cost curve. The optimal use of the airport occurs where the demand curve crosses the marginal social cost curve, at QO. This demand would be achieved by charging airlines price P for use of the airport capacity, a price partially offset for the airlines that continue to use the airport by cost savings due to reduced delays (Cu – CR).
Figure 2.
Demand for Airport Capacity for a Peak Hour
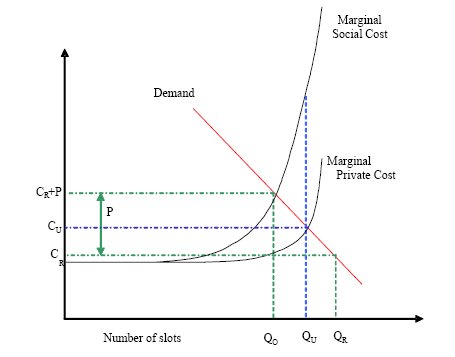
In practice, however, scarce capacity is administratively rationed at most airports. If the airport were to ration peak capacity to QO slots (the optimal number) without imposing a slot charge, it would reduce delays and hence private costs would fall to CR. But at CR, demand would increase to QR. Hence {QR – QO} flights would be denied the opportunity to use the airport during the peak. If the slots were allocated to those airlines that valued them most, the allocation would be efficient and equivalent to levying a charge P, but nothing in current allocation practice guarantees such an efficient result. Administratively allocating a slot to an airline not willing to pay P inevitably denies the slot to an airline that is. Such an allocation is inefficient because the slot could be traded, leaving both airlines better off as a result of the sale, a classic case of an improvement in efficiency and social welfare. The principal insight here is that:
Slots would be allocated efficiently if and only if they were used by airlines willing to pay price P for them.
Although airport capacity allocation has many parallels with highway traffic congestion, the interdependencies are more complex. Most airport traffic is scheduled, planned, and marketed months in advance, so that airlines require certainty that they will be able to run their services. A hub airline will wish to time a wave of arrival flights a short time before a wave of departure flights to permit convenient passenger transfers. A non-hub airline may wish to use a single aircraft to undertake two or more return flights in a day, and so would require four slots spaced at convenient intervals. An airline’s demand for a particular slot is often contingent on its ability to obtain one or more other slots. For example, for an airline to use an arrival slot, it also needs a departure slot some time later for its onward or return journey. If the airport at the other end of its route is also coordinated, the timing of slots at each airport is interdependent.
Although a highly informed airport coordinator might conceivably be able to allocate slots efficiently without payments, the complexities of slot demand and practical information constraints mean that efficient allocation is best achieved through a form of market mechanism. NERA carried out a major study for the European Commission examining how market mechanisms might improve the allocation of airport slots. This study provided the main research resource for the Commission’s 2004 consultation on slot allocation.7
C. Current Practice for Allocating Airport Capacity
At over 200 airports worldwide, airport slots are allocated by airport coordinators following a code of practice set by the International Air Transport Association (IATA). The system is not followed in the US, where antitrust laws prohibit airports from practising slot allocation except for four specified high-density airports. Under both the IATA and the US systems, airlines have "grandfather rights" to slots: If an airline had been allocated a particular slot in the previous season, it would also be allocated the slot in the subsequent season, if it so requested.
Slots that are not allocated according to grandfather rights are known as "pool" slots and are allocated by the coordinator. Coordinators are often required to favour airlines with a limited presence at the airport (a new entrant): The EU offers 50 percent of pool slots to new entrants and, prior to 2000, the US allocated 25 percent. In addition, national governments often reserve certain slots for subsidised flights to more remote regions. Given the complexities, slot scheduling for each season takes many iterations of requests and offers between airlines and coordinators over a number of months, as each coordinator tries to balance the needs of different airlines.
In general, airports worldwide do not charge for airport slots. In the European Union, the purchase of slots is explicitly prohibited, though there is some legal uncertainty as to whether payments can accompany the (legal) practice of exchanging slots. For example, payments accompanying exchanges of slots at London Heathrow have been made quite openly. In the United States, it is legal to buy and sell slots that have already been allocated, though the Federal Government may suspend slots at any time, so the normal rights of property ownership do not apply. Authorities have been at pains to emphasise that airlines cannot be considered to own their slots.
Many airports and commentators consider these existing administrative systems for slot allocation (in the absence of monetary trading) highly inefficient. Since an airline that does not use an allocated slot is not liable for airport charges, it has little incentive to release slots for which it has limited use. As a result, large numbers of sought-after slots are not used, and the difficulty of obtaining slots frustrates efforts to develop new services. This view was supported by NERA’s analysis of airport data for the European Commission:
- At the most congested airports, schedules changed little from one season to the next (62 percent of slots were used in the same way as the previous season, whereas only 7 percent were used for entirely new services), whereas at other airports there was greater variation (48 percent of slots were used in the same way as the previous season, whereas 22 percent were used by entirely new services).8
- Although small aircraft tend to generate less revenue than larger ones and hence represent an inefficient use of scarce runway capacity, they were quite widely used during peak times at congested airports (8 percent of peak slots were used by aircraft with fewer than 50 seats, 16 percent had fewer than 100 seats).9
- Tellingly, 6 to 9 percent of the slots allocated to airlines (in the sample of airports for which there were data) were then not used.10
- Some US airports have been subject to a different form of inefficiency, caused by unconstrained airport access. The Aviation Act AIR-21 of April 2000 gradually phased out slot restrictions at high-density airports (Chicago O’Hare, John F. Kennedy, and LaGuardia). By November 2000, with 300 new flights operating at LaGuardia, delays had increased by over 230 percent. Such queuing for capacity is inherently inefficient because airlines are not paying for the delays they are imposing on other airlines. New slot restrictions, however, quickly abated the problem.
Footnotes
1 See A. A. Walters, "The Theory and Measurement of Private and Social Cost of Highway Congestion," Econometrica, XXIX (1961), 679-699.
2 Improving bus services across the whole of London was a specific objective of the Mayor’s transport strategy. NERA had advised TfL London Buses in development of its bus strategy for London.
3 One concern was that the central area congestion charge would simply divert the traffic and hence the congestion to other parts of London.
4 Results are taken from TfL’s Third Annual Report, published in April 2005: TfL Central London Congestion Charging: Impacts Monitoring: Third Annual Report, April 2005.
5 The benefits of traffic management measures appear to have outweighed the impact of some increase in traffic flow.
6 By law, the net revenues must be spent on furthering the Mayor’s Transport Strategy.
7 NERA, Study to Assess the Effects of Different Slot Allocation Schemes, (January 2004),
http://europa.eu.int/comm/transport/air/rules/doc/2004_01_24_nera_slot_study.pdf, published as European Commission Commission Staff Working Document – Commercial slot allocation mechanisms in the context of a further revision of Council Regulation (EEC) 95/93 on common rules for the allocation of slots at Community airports. 17/9/2004. http://europa.eu.int/comm/transport/air/consultation/doc/2004_12_01/2004_consultation_paper_en.pdf8 From NERA (2004). Table 4.1.
9 Ibid., Section 4.4.2.
10 Technically, these slots were returned to the coordinator after the slot return deadline. Ibid., Section 4.3.
The content of this article is intended to provide a general guide to the subject matter. Specialist advice should be sought about your specific circumstances.
