
Overview
Corporate governance practices vary significantly among public companies. This is a reflection of many factors, including:
- Differences in the stage of development of companies, including the relative importance placed on various values (for example, focus on growth and scaling operations may be given more importance);
- Differences in the investor base for different types of companies;
- Differences in expectations of board members and advisors to companies and their boards, which can vary by size, age of company, stage of development, geography, industry and other factors; and
- The reality that corporate governance practices that are appropriate for large, long-established public companies can be meaningfully different from those for newer, smaller companies.
Since the passage of the Sarbanes‑Oxley Act of 2002, which signaled the initial wave of corporate governance reforms among public companies, Fenwick & West has surveyed the corporate governance practices of the companies included in the Standard & Poor's 100 Index (S&P 100) and the high technology and life science companies included in the Silicon Valley 150 Index (SV 150) each year.
In this report, we present statistical information for a subset of the data we have collected over the years. These include size and number of meetings for boards and their primary committees, the number of insider directors, board leadership makeup, majority voting, board classification and use of a dual‑class voting structure, as well as the frequency and number of stockholder proposals. In each case, we present comparative data for the S&P 100 companies and for the high technology and life science companies included in the SV 150, as well as trend information.
Governance practices and trends (or perceived trends) among the largest companies are generally presented as normative for all public companies. Fenwick & West collects information regarding public company governance practices to enable boards and companies in Silicon Valley to understand the actual corporate governance practices among their peers and neighbors, and understand how those practices contrast with practices among large companies nationally.
The 2011 constituent companies of the SV 150 range from Hewlett‑Packard (HP) with revenue of approximately $127B to Meru Networks (Meru) with revenue of approximately $85M, in each case for the four quarters ended on or about December 31, 2010. HP went public in 1957, Meru in 2010. HP's peers clearly include companies in the S&P 100, of which it is also a constituent member (seven companies were constituents of both indices for the survey in the 2011 proxy season), where revenue averages approximately $40B. Meru's peers are smaller technology companies that went public over the last half decade or so. Compared to the S&P 100, SV 150 companies are generally much smaller, younger, with lower revenue and substantially more concentration in the high technology and life science industries. As the graphs on pages 4 and 5 illustrate, SV 150 companies also tend to have significantly greater ownership (whether equity ownership or voting power) by the board and management than S&P 100 companies.
While not specifically studied in this report, it is worth noting that the broad range of companies in the SV 150 (whether measured in terms of size, age or revenue) is associated with a corresponding range of governance practices. Comparison of governance practice statistics and trends for the top 50,1 middle 502 and bottom 503 companies of the SV 150 (in terms of revenue) bears this out.4 This information (as well as other data not presented in this report) can be obtained by consulting your Fenwick & West Securities Partner.
Equity and Voting Power Ownership by Executives and Directors


Board Size and Meeting Frequency
The number of directors tends to be substantially lower among the high technology and life science companies in the SV 150 (median = 8 directors) than among S&P 100 companies (median = 12 directors). Although they hold board meetings about as often, the SV 150 companies tend to skew slightly more toward more frequent meetings.


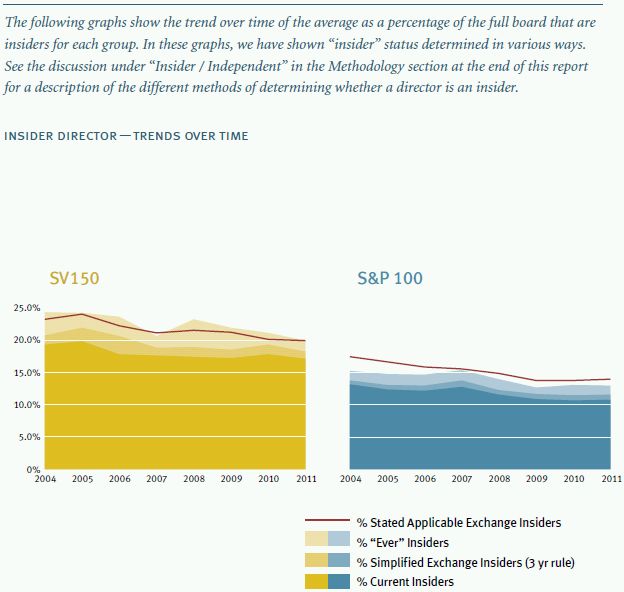
Insider Directors
Insider directors are more common among members of the boards of the high technology and life science companies included in the SV 150 than among board members at S&P 100 companies. While generally their prevalence has declined over time in both groups, the SV 150 has not reached the level of the S&P 100 at the start of the period covered by the survey. This is largely a function of the relative size of the boards in the two groups rather than the absolute number of insider directors per board.

Board Leadership
During the period covered by this survey, insider dominance of board leadership started lower and declined more rapidly among the high technology and life science companies in the SV 150 than among S&P 100 companies. By the 2011 proxy season, almost half of SV 150 companies had a chair who was not an insider and combined chair/CEOs existed at less than a third of companies, while combined chair/CEOs still exist at about 70% S&P 100 companies (albeit with lead directors also present at about 75% S&P 100 companies).


Audit Committee Size and Meeting Frequency
Audit committees tend to be smaller among the high technology and life science companies in the SV 150 (median = 3 directors) than among S&P 100 companies (median = 5 directors). In both groups, after peaking in 2007, largely driven by a surge of internal investigations (such as for stock option backdating issues), the number of audit committee meetings appears to be returning to levels similar to those found in the first year following the adoption of the Sarbanes‑Oxley Act of 2002 (SV 150 median = 8 meetings; S&P 100 median = 9 meetings).


Compensation Committee Size and Meeting Frequency
Compensation committees tend to be larger among S&P 100 companies (median = 4 directors) than among the high technology and life science companies in the SV 150 (median = 3 directors). In both groups, compensation committees hold more frequent meetings than at the outset of the survey period, though the trend is particularly pronounced among the SV 150 companies (S&P 100 median = 6; SV 150 median = 7).


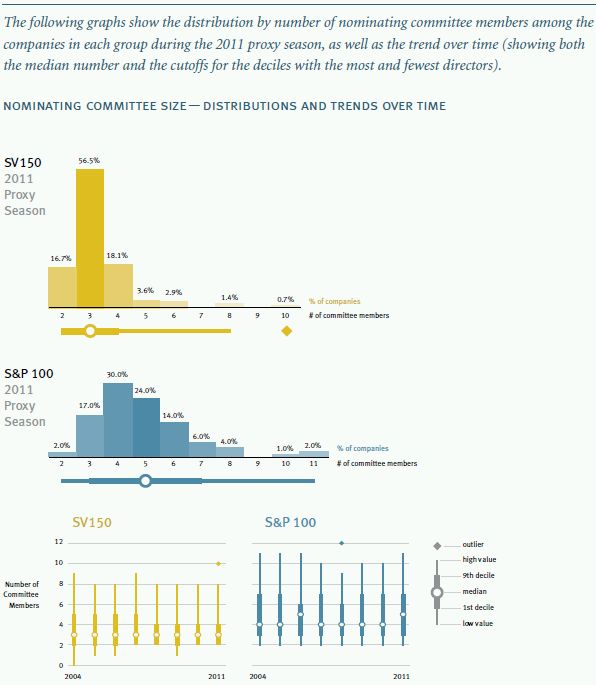
Nominating Committee Size and Meeting Frequency
Nominating committees tend to be smaller among the high technology and life science companies in the SV 150 (median = 3 directors) than among S&P 100 companies (median = 5 directors). In both groups, nominating committees generally hold meetings more frequently over time, though trend is somewhat more pronounced among the SV 150 companies ( SV 150 median = 4 meetings; S&P 100 median = 5 meetings).

Other Standing Committees
Standing committees other than the three primary board committees are quite common (87%) among S&P 100 companies and relatively uncommon among the high technology and life science companies in the SV 150 (26%). These committees can serve a wide variety of purposes. Executive, finance and risk management committees are most common among the S&P 100, with finance, some amalgam of strategy/ M&A and technology committees most common among the SV 150 companies.

Majority Voting
The rate of implementation of some form of majority voting has risen substantially over the period of this survey. The increase has been particularly dramatic among the S&P 100 companies, rising from 1 in 10 to 9 in 10 between the 2004 and 2011 proxy seasons. Among the SV 150 the rate has risen from none as recently as the 2005 proxy season to slightly more than 1 in 3 in the 2011 proxy season. Our data shows that within the SV 150, the rate of adoption fairly closely tracks with the size of company (measured by revenue), with an approximately 86% rate among the top 15 (similar to the S&P 100) and an approximately 11% rate among the bottom 50 (even lower among the bottom 15, at an approximately 8% rate) in the 2011 proxy season.

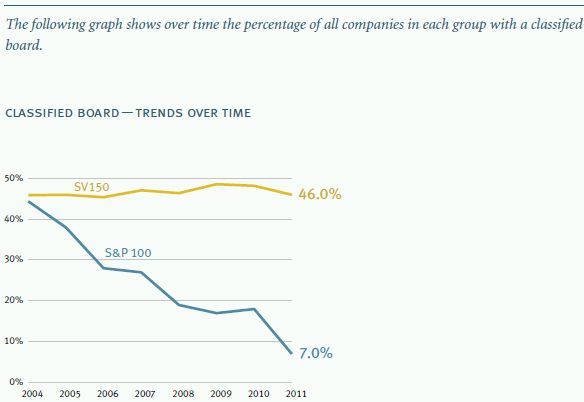
Classified Board
Classified boards are now significantly more common among the high technology and life science companies in the SV 150 than among the S&P 100 companies, though that has not always been the case. This graph illustrates that declassifying boards has been a trend among the largest public companies, but not among Silicon Valley companies. At the beginning of the survey period, both groups had similar rates of classified boards. But, while the frequency among the S&P 100 declined dramatically, the rate has held fairly steady among the high technology and life science companies in the SV 150. Our data shows that within the SV 150, the rate among the top 15 companies has fallen in half (to a rate similar to the S&P 100), while the rate among the bottom 50 companies has actually increased (from approximately 61% to approximately 70%). To a major extent, this reflects the reality that sheer size and dispersion of stockholdings underlies one of the major reasons for classification, as a takeover defense.
Dual-Class Voting Stock Structure
A small number of companies have adopted dual‑class voting stock structures. Anecdotally, this has been suggested as a recent trend among Silicon Valley high technology companies. That trend has yet to appear in our data. Dual‑class voting stock structures have been significantly more common among S&P 100 companies than SV 150 companies, though in both groups dual‑class voting is a small minority. The variation in the percentage of each group over time is primarily a function of changes in the constituents of each group. Within the SV 150, our data suggests that there has been an increasing trend of dual‑class voting structures among the largest companies, and a decline among the smallest companies. That has been a function of Google, VMware and SunPower joining the SV 150 with dual‑class structures (though during the period of the survey another large company, Electronic Arts, moved away from a dual‑class structure), while smaller companies with dual‑class voting have departed.

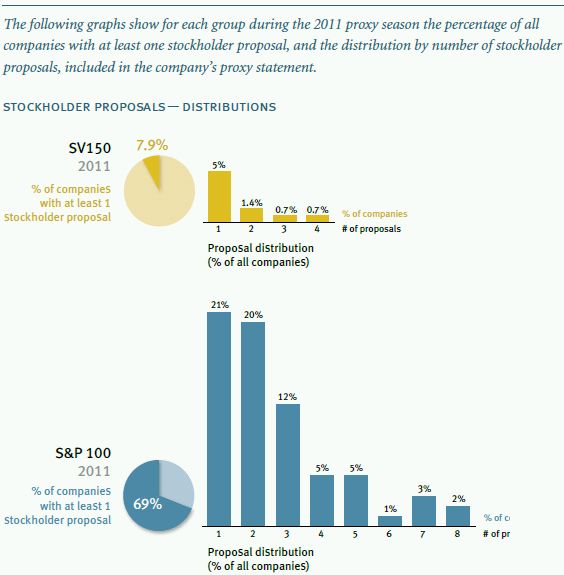
Stockholder Proposals
Stockholder activism, measured in the form of proposals included in the proxy statements of companies, is substantially lower among the high technology and life science companies in the SV 150 than among S&P 100 companies. Our data shows that to be the case even among the high technology and life science companies in the top 15 of the SV 150, where only 43% had at least one stockholder proposal and none had more than four proposals (with an average of approximately two proposals among those with any) during the 2011 proxy season. However, our data reflects a current general downward trend of stockholder activism, measured in terms of stockholder proposal frequency. Another form of stockholder activism, contested elections, were exceedingly rare among both the SV 150 and the S&P 100, where there were no contested elections in five of the years surveyed among the SV 150 (and one year each having one, two and three contested elections) and four years with none among the S&P 100 (three years having two contested elections and one year having one).

Methodology
Group Makeup
We reviewed the corporate governance practices of the companies included in the Standard & Poor's 100 Index (S&P 100)1 and the public high technology and life science companies included in the Silicon Valley 150 Index (SV 150)2. The makeup of the indices has changed over time as determined by their publishers,3 with the SV 150 makeup being updated generally once annually and the S&P 100 changing more frequently. For analytical purposes, companies are included in the survey if they appeared in the relevant index as determined as of the most recent calendar year end.4 Further, to focus the survey on the industries most relevant to Silicon Valley, companies were excluded from the SV 150 data set for purposes of the survey if they were not primarily in the high technology or life science industries (broadly interpreted).5 To some degree, the volatility in the statistical trends within each of the indices is a reflection of changes in the constituents of the index over time.6 Finally, some companies are constituents of both indices.7 Those companies are included in the data sets of both groups for purposes of this survey.
Proxy Season / Proxy Statements
To be included in the data set for a particular proxy season, the definitive proxy statement for a company's annual meeting generally must have been filed by the company with the Securities and Exchange Commission (SEC) during the year ended June 30th, irrespective of when the annual meeting was actually held.8 In some instances, a company may not have consistently filed its annual meeting proxy statement on the same side of the cutoff date each year. In such cases, we have normalized the data by including only one proxy statement per year for a company (and including a proxy statement in a year even though it was filed beyond the normal cutoff).9 In some instances, a company may not have filed a proxy statement during a year at all (or held any annual meeting).10 In such instances, data was gleaned for that company from other SEC filings to the extent available.11
Generally, where a trend graphic identifies a year, it is the year for which the data was presented in the relevant proxy statements rather than the year of the proxy statement themselves. For example, a proxy statement filed in April 2011 included data about the number of board and committee meetings for 2010. That data would be included in the graphic in the year "2010" statistic (and no "2011" statistic would be included since the 2012 proxy season, as defined for purposes of the survey, is ongoing).
Insider / Independent
There are a variety of meanings that are ascribed to the terms "insider" and "independent," which are colloquially used somewhat interchangeably. We have attempted to cover a variety of these meanings within the same survey. At the narrowest end of the spectrum, a director is considered an insider if he or she is currently an officer or otherwise an employee of the company (and not an insider if he or she is not currently an officer/employee). At the broadest end of the spectrum, some commentators consider a director to be an insider if he or she has ever been an officer of the company. In between these ends of the spectrum, the stock exchanges have promulgated rules that defined independence as not having been an officer or otherwise an employee of a company for the last three years, in addition to other specified criteria which vary somewhat by stock exchange.12 However, companies have not always been required to state with respect to each director whether he or she meets the applicable stock exchange's independence criteria (as implemented by that company).13 Consequently, when our survey was initiated, we also utilized a simplified version of the stock exchange rules, only applying the three-year employment test to the director since that information can be gleaned from the requisite biographical summary that has long been included in proxy statements.14
This allowed us to include all companies surveyed in this particular version of "insider" status throughout the period covered (while not all have been historically included for the applicable stock exchange independence criteria statistics across the period),15 and we have carried this methodology forward for trend analysis purposes. Finally, for purposes of the statistics regarding insider board chairs in this report, we have deemed a director as an insider if he or she is an insider under any of these criteria.16
Nominating and Governance Committees / Other Standing Committees
Generally, the companies surveyed have a unified committee with responsibility for both nominating and governance functions. However, a small number of companies have separate committees for nominating functions and for governance functions. For statistical purposes, where separate committees existed, the data for the nominating committee was included (and data for the governance committee ignored) for the information presented in this report. Such separate governance committees were also ignored for purposes of the statistics for "Other Standing Committees" included in this report. Similarly, an exceedingly small number of companies have had a committee that combined the nominating function with the function of one of the other primary committees in a single committee.17 In such rare instances, the data for that committee was included in the data set for each of the primary committees it comprised.18
Equity / Voting Ownership
The percentage of equity and voting ownership statistics were based on beneficial ownership data presented in the Security Ownership of Certain Beneficial Owners and Management table19 as well as other information regarding voting and conversion rights included elsewhere in proxy statements and other filings with the SEC. A fair number of companies report aggregate ownership by all executive officers and directors as a group of "less than 1%" (whether measured as simply equity or voting ownership).20 For purposes of calculating the average ownership statistics, companies that reported "less than 1%" ownership were treated as having ownership of 0.5% in the data set.21
Majority Voting
There are a variety of ways to implement majority voting. These range from strict majority voting provisions in the charter or bylaws that require a majority of "for" votes for a director to be elected (and if less than a majority, the director simply does not take, or loses, office) to various resignation policies implemented in corporate governance principles that simply require a director to tender a resignation if less than a majority of "for" votes are received which may or may not be accepted by the board (which retains full discretion in making the decision) – with a range of variations (often implemented in bylaws) in between (generally with contested elections retaining plurality voting). The effectiveness of any of these (including the charter implementations) are further impacted by state laws that often provide for holding over of an incumbent even if a majority of "for" votes are not received (to prevent an unnecessary vacancy). Consequently, rather than attempt to illustrate the trends among the many variations, we have simply presented data regarding whether the companies surveyed have implemented any form of majority voting policy for uncontested elections (rather than simply retaining plurality voting for all director elections).
Dual Class Structure
Generally, where a company has more than one class of stock and those classes have disparate voting rights, they were included in the data set as having a dual‑class structure. However, in some instances companies may have a class of stock with disparate voting rights, but that class is incredibly small compared to the overall voting power represented by all voting stock or there are other indicia that the voting rights are not really effectively disparate.22 In such cases, such companies were not included in the data set as having a dual‑class voting stock structure.
Footnotes
1 Standard & Poor's has stated that "[t]he S&P 100 consists of 100 companies selected from the S&P 500. To be included, the companies should be among the larger and more stable companies in the S&P 500, and must have listed options. Sector balance is considered in the selection of companies for the S&P 100." (Standard & Poor's states that "[t]he S&P 500 focuses on the large-cap sector of the market; however, since it includes a significant portion of the total value of the market, it also represents the market; [c]ompanies in the S&P 500 are considered leading companies in leading industries" and "[c]onstituents of the S&P 100 are selected for sector balance and represent over 60% of the market capitalization of the S&P 500 and almost 45% of the market capitalization of the U.S. equity markets.")
2 The San Jose Mercury News has stated that "[t]he Silicon Valley 150 ranks [public] companies headquartered in Santa Clara, Santa Cruz, southern San Mateo and southern Alameda counties [in California] on the basis of worldwide revenue for the most recent available four quarters ended on or near [the most recent December 31]."
3 The constituents of the Standard & Poor's 100 (S&P 100) Index are determined by Standard & Poor's (Standard & Poor's Financial Services LLC, a subsidiary of The McGraw-Hill Companies, Inc.) and the constituents of the Silicon Valley 150 Index (SV 150) are determined by the San Jose Mercury News (part of the Bay Area News Group).
4 I.e., the Fenwick & West survey for the 2011 proxy season included companies constituent in the S&P 100 as of December 31, 2010 and constituent in the SV 150 as published April 17, 2011, based on "the most recent available four quarters ended on or near December 31, 2010."
5 E.g., for the 2011 proxy season, the following companies were excluded from the SV 150 data set for purpose of the survey (in order of rank within the index): Franklin Resources (14), Con‑Way (17), Robert Half (25), Granite Construction (38), West Marine (66), California Water (74), Essex Property (79), SJW (105), Financial Engines (138), Coast Distribution (141) and Mission West (142).
6 Other factors include changes in board membership and turnover in the chief executive officer of constituent companies.
7 For example, for the 2011 proxy season, the following companies were included in each of the S&P 100 and the SV 150 (in order of rank within the SV 150 index): Hewlett‑Packard (1), Apple (2), Intel (3), Cisco Systems (4), Oracle (5), Google (6) and Gilead Sciences (10).
8 I.e., the proxy statements included in the 2011 proxy season survey were filed with the SEC from July 1, 2010 through June 30, 2011.
9 E.g., several companies generally filed proxy statements in June each year, but in a particular year filed in July (or later). The data for such a proxy statement was "moved" into the data set for the "proxy season" year before the cutoff.
10 This can occur for a variety of reasons, including among others instances where: (a) a company could not timely file its periodic reports due to a pending or potential accounting restatement (such as during the so‑called "stock option backdating scandals" that afflicted several Silicon Valley companies), or (b) a company was acquired or had agreed to be acquired (and determined to defer an annual meeting during the pendency of the acquisition).
11 Generally Forms 10‑K or S‑4 and Schedules 14D‑9 or TO. These sources generally provide only a subset of the data available in an annual meeting proxy statement (Schedule 14A). Sometimes these filings were made beyond the standard cutoff for the relevant proxy season for purposes of the survey, but were nonetheless included in the survey data set for that proxy season if they generally presented data for the period that would have been covered by the proxy statement for that company if it had been filed.
12 See e.g., Section 303A.02 of the New York Stock Exchange (NYSE) Listed Company Manual and Nasdaq is in Rule 5605(a)(2) of the Nasdaq Stock Market (Nasdaq) Marketplace Rules. They generally provide coverage for compensation from the company to a director above a specified level (other than for board service) [currently each exchange specifies $120,000 during any 12 months within the last three years], certain levels of business relationship between the company on whose board a directors serves and a company that employs the him or her, and similar employment by, compensation to or business relationships with a director's immediate family members, among other factors. Further, in implementing these rules, a number of companies have adopted their own independence standards (e.g., to define "material relationships" that will preclude independence under a portion of the NYSE rule).
13 Current Item 407(a) of Regulation S‑K requires such disclosure.
14 Accordingly, family member relationships or other indicia of non-independence are not factored in for this purpose.
15 Where a company did not provide enough information to determine the independence of each director (e.g., by affirmative statement or by elimination through biographical and committee membership information), the company was excluded from the data set for calculating the statistics based on the applicable stock exchange criteria.
16 For purposes of the Lead Director statistics, we have not applied this methodology. Rather, we have included any company as having a Lead Director if the proxy statement identified a specific director as having the title of "Lead Director," "Lead Independent Director" or "Presiding Director" (or a similar title). Generally all such directors were independent under all of the methods we applied (including the applicable stock exchange independence requirement), though some were not under the "Ever" [a company employee] Rule.
17 Such as a unified "Compensation and Corporate Governance Committee" that the proxy statement described as having nominating functions.
18 E.g., data for a unified "Compensation and Corporate Governance Committee" that the proxy statement described as having nominating functions was included in the data for the Compensation Committee and the Nominating Committee with respect to that company.
19 Item 403 of Regulation S‑K (required by Item 6(d) if Schedule 14A).
20 In the 2011 proxy season, this included approximately 60% of S&P 100 companies and 10% of SV 150 companies.
21 Companies that reported an actual numerical ownership percentage that happened to be less than 1% were included in the data set with the numerical ownership percentage reported.
22 E.g., where the company might have a class of preferred stock outstanding in addition to its common stock and each share of preferred stock is entitled to more votes than each share of common stock, but the preferred stock is also convertible at the same ratio as the ratio of votes per share of preferred to votes per share of common. Some editorial judgment was necessarily applied in drawing such distinctions.
The content of this article is intended to provide a general guide to the subject matter. Specialist advice should be sought about your specific circumstances.
