
Year 2011 Highlights in Filings
- Pace of standard filings in line with past three years
- Suits against Chinese companies increased sharply
- M&A objection suits continue to comprise a large proportion of filings
- Credit crisis-related filings continue to dwindle
Year 2011 Highlights in Settlements
- Median settlement down from last year, yet still third highest on record
- Number of settled cases is lower than in previous years
- Lower aggregate plaintiffs' attorney fees, consistent with lower aggregate settlement payout
Introduction1
The pace of filings of class actions under federal securities and commodity laws held relatively steady in 2011 as compared to the past three years. Behind this apparently steady number, however, was a substantial shift in the composition of cases filed. Two types of suits have primarily accounted for this compositional shift: M&A objection suits and suits involving Chinese companies listed in the US.
The brisk rate of filings of shareholder class actions against Chinese companies this year has drawn much attention. It represents the most notable development in the composition of filings this year.
Cases alleging breach of fiduciary duty in connection with a merger or an acquisition continue to be filed in large numbers. The number so far this year, 61, has declined only slightly from last year's total of 68 such suits. M&A objection lawsuits continue to be the single largest category of non-standard cases tracked by NERA.
In 2010, M&A cases took that top spot from credit crisis-related suits. Presently, the wave of credit crisis-related filings largely seems to have subsided. With 11 federal class actions filed in 2011 relating to the credit crisis, such litigation is approximately one-third of its level last year, when it had already declined by about two-thirds from its 2008 peak. The percentage of suits alleging damages in connection with complex financial instruments such as mortgage-backed securities and collateralized debt obligations has also declined from the elevated levels observed over the past several years to levels consistent with those observed in 2005 and 2006.
The median settlement in 2011 fell to $8.7 million, below last year's record high of $11.0 million, and lower than both 2009 and 2010, but still the third highest since the passage of the Private Securities Litigation Reform Act (PSLRA) in late 1995.
The number of settlements in 2011 declined as compared to previous years. This development, combined with a lower average settlement size, means that the aggregate amount paid out in settlements this year is on track to be the lowest since 2005, as are aggregate plaintiffs' attorney fees.
Trends in Filings2
Securities class actions have been filed at a slower pace in the second half of 2011 than in the first half, and 2011 filings are on track to be slightly below the total in 2010. As Figure 1 shows, the 232 filings that we project for 2011, based on the 213 filings observed through the end of November, are broadly in line with the levels observed over the previous three years.

While the annual number of filings has not varied a great deal over the past several years, the mix of cases filed has changed substantially. Suits objecting to a merger or an acquisition have accounted for nearly 29% of all filings so far in 2011, and filings against Chinese companies have accounted for approximately 18%.3 Credit crisis-related suits have dwindled to just 5% of all 2011 filings and only three Ponzi scheme-related securities class actions were filed this year. In 2008, by contrast, approximately two out of every five suits were credit crisis-related, while M&A-related suits and lawsuits against Chinese companies together accounted for just 9% of filings. Figure 2 illustrates the change in composition with a comparison of the mix of suits filed in 2008 and in 2011 to date.

While the number of filings that we label as "standard" has risen from 128 last year to 138 in 2011 through the end of November, this increase is fully accounted for by filings against Chinese companies—those domiciled and/or with their principal executive offices in China.4 Excluding these cases reveals a sequential decline, as compared to last year, in the number of standard filings that do not involve Chinese companies. See Figure 3.5

With the passage of time since the extreme market turbulence of late 2008 and early 2009, the continuing decline in filings relating to the global credit crisis is not unexpected. Moreover, this dynamic may be driven in part by the statute of limitations: an action alleging violation of the Securities Exchange Act of 1934 must be filed within two years after the discovery of the facts constituting the violation or within five years after the violation.6
The recent wave of Ponzi scheme cases, which began with the uncovering of Bernard Madoff's scheme in December 2008 and crested in 2009, was also in part a consequence of the credit crisis. In a Ponzi scheme, investors are paid returns from funds contributed by new investors; thus, the scheme requires a steady flow of investors contributing funds. The credit crisis and economic recession saw an unprecedented number of Ponzi schemes collapse, in part because the financial and economic downturn reduced the inflow of new funds into such schemes and increased their investors' demand for redemptions.7
The M&A objection cases filed at a high rate in 2010 and 2011 are fundamentally different from typical shareholder class actions. Instead of proposing a class of investors who transacted in a security during a particular period of time, plaintiffs' attorneys bring this type of lawsuit on behalf of all shareholders of a target company in a merger or acquisition, and allege that the directors of the target company breached their fiduciary duty to shareholders by accepting a price for the company's shares that was too low.
Filings by Type of Security
We have also looked at the types of securities named in a lawsuit, and in particular whether the damages alleged in each case related to securities issued by a publicly traded company—such as its common stock or debt—or to other types of securities such as mortgage-backed securities, other asset-backed securities, collateralized debt obligations, tax revenue bonds, mutual funds, real estate investments, and feeder-fund shares. In 2009, at the height of the credit crisis, over 30% of suits (67 of 218 total) involved securities other than ones issued by publicly traded companies, and as recently as 2010, nearly 20% did. So far in 2011, however, just nine securities class actions, less than 5% of the total, have involved such securities. This year's level is consistent with levels observed prior to the credit crisis. See Figure 4.

Filings by Circuit
Traditionally, filings have been concentrated in two US circuits: the Second Circuit (encompassing New York, Connecticut, and Vermont), and the Ninth Circuit (including California, Washington, Arizona, and certain other Western states and territories). This year, the pattern has continued; with 52 filings so far in the Second Circuit and 57 in the Ninth, these two circuits have accounted for more than half of all filings so far in 2011. See Figure 5.

In contrast to the overall concentration of lawsuits in these two circuits, M&A objection suits have been more evenly distributed. Of the 61 such cases filed this year, there were between eight and 10 merger objection cases filed in each of the Third, Fourth, Fifth, and Ninth Circuits, and between two and five such cases in each of the First, Second, Sixth, Seventh, and Tenth Circuits.
Filings by Sector
Filings against companies in the financial sector have declined along with filings related to the credit crisis. Securities class actions against financial sector companies have accounted for about 16% of cases so far in 2011, as contrasted with nearly half in 2008 and 2009. The 2011 proportion is in line with the pre-credit crisis average. Moreover, of all class actions filed against financial sector firms as primary defendants, less than a third involved allegations relating to the credit crisis.
Filings have not been concentrated against companies in any one sector in 2011 in the way the financial sector was disproportionately represented in suits filed in 2008 and 2009. More filings were against companies in the electronic technology and technology services sector than in any other sector, with such cases accounting for approximately 21% of filings. Health technology and services companies accounted for 15% of filings. See Figure 6.

Many M&A objection cases filed in 2011 have targeted firms in the electronic technology sector: 10 cases, or about 16% of all merger objection filings in 2011, have been filed against companies in this sector, whereas less than 5% of all mergers announced in 2011 have involved the acquisition of firms in the electronic technology sector. Defendants in M&A objection litigation have also included companies in the energy and non-energy minerals sector (eight cases, or about 13%), the health technology sector (nine cases, or 15%) and the utilities sector (six cases, or 10%).
As in 2010, relatively few filings this year have targeted an accounting co-defendant along with the issuer. See Figure 7. This is in spite of an increase in filings with accounting-related allegations (discussed further below). Many of the filings in 2011 with accounting allegations were against companies domiciled in China, and these tended not to have accounting co-defendants.

As Figure 8 shows, 14.1% of filings in 2011 involved a financial institution as co-defendant but not primary defendant, and 30% of cases involved financial institutions as either co-defendant or primary defendant, or both. The proportion of suits naming a financial institution as a defendant is down from a peak of nearly 72.4% in 2008 at the height of credit crisis filings and more in line with the levels in 2005 and 2006, before the financial crisis.

Filings by Defendant Issuer Country
Sixty-four filings in 2011, more than a third of total filings, have been against foreign-domiciled issuers. As Figure 9 shows, this number is more than double the count observed in recent years.

The increase in suits against foreign companies is largely accounted for by the surge in filings against Chinese-domiciled companies.8 From January to November 2011, there have been a total of 29 filings against Chinese-domiciled companies. However, even this number appears to understate the number of filings against Chinese issuers, as not all companies based in China are legally domiciled there. If we define a Chinese company as one that is either domiciled in China or that has its principal executive offices in China, there have been 39 suits against Chinese companies in 2011.
The pace of these suits may have slowed somewhat in the second half of 2011. Using the more inclusive concept of what constitutes a Chinese company, suits against Chinese issuers fell from 27, or more than one-fifth of filings in the first half of the year, to 12 in the period from July through November, a number still above last year's total of 10 cases. See Figure 10. The decline in filings against Chinese companies accounts for a substantial fraction of the decline in the pace of overall filings in the second half of 2011, as compared to the first half.

To a greater extent than for filings overall, suits against Chinese companies have been concentrated in the Second Circuit and Ninth Circuits, with only five of 29 such cases not filed in one of those two circuits. Twenty-seven filings against Chinese companies—more than 90%—made accounting allegations. Suits against Chinese companies comprised more than half of all filings with accounting-related allegations. As Figure 11 indicates, the proportion of suits against foreign-domiciled issuers is more than twice the proportion of foreign companies among overall US listings.

Time to File
On average, cases were filed considerably faster in 2011: the average time to file in 2011 was 109 days, as compared to 175 days last year. See Figure 12. It appears that plaintiffs' attorneys have largely worked through the backlog of potential cases that arose during the credit crisis.
 L
L
Trends in Allegations
We track the allegations in each class action filing and classify allegations according to any common themes that emerge, as well as already established broad categories. With nearly half of filings in 2011 either against a Chinese issuer or involving objections to a merger or an acquisition, it is not surprising that the two most frequently observed allegations this year have been accounting allegations (common in the Chinese issuer suits) and breach of fiduciary duty (characteristic of M&A objection litigation). See Figure 13. Suits against Chinese companies comprised 26 of 87 total securities class actions with accounting allegations in 2011 and were only one of the 61 M&A objection cases. Figure 13 uses counts of the number of allegations to calculate the proportion of various allegations in federal filings and there often are multiple allegations in each lawsuit.

Other prominent categories of allegations include misleading earnings guidance and other product/operational defects. Only 5% of the total number of cases filed this year contain allegations concerning defects of financial products, as compared to 15% in 2007-2009, at the height of the wave of litigation related to the financial crisis.
Insider Sales
The proportion of filings alleging insider sales in 2011 has fallen to a new low since 2005, the earliest year for which we have collected these data. See Figure 14. It appears that, consistent with the previous two years, plaintiffs seldom used insider sales to support a showing of scienter in 2011 filings.

Resolutions
The typical securities class action takes several years to reach a final resolution, and a few cases take a decade or more. To get a sense of how cases are ultimately resolved, we analyzed the most recent cohort of cases in which all cases have been resolved: those filed in 2000. As Figure 15 shows, of the 236 cases filed in that year, 149, slightly less than two-thirds, reached a settlement, and 87 cases, or 37%, were dismissed.9

Figure 16 shows the proportion of cases settled, dismissed, and pending, by filing year, annually from 2000 to present. If we focus on the cohort of cases filed in 2001 or 2002, we see that the proportion of settlements and dismissals for resolved cases are similar to those for the cohort of cases filed in 2000. Of cases filed in 2010, about one-third have reached some resolution, with dismissals outnumbering settlements two to one.

Settlements at Various Stages of Litigation
NERA's current predicted settlement model is estimated using over 1,000 historical settlements in securities class actions and predicts expected settlement and related statistics using a set of case-specific variables that NERA's research has indicated are statistically significant in explaining the variation in settlement amounts. For a particular case that has not yet settled, in addition to the standard predicted settlement model, an alternative model can be run based on a sub-sample of cases with similar factors, such as same industry or circuit, or factors that are not currently included in the main predicted settlement model, such as the procedural history of the case.
For example, we can apply the above approach to gauge the extent to which settlements depend on the stage at which they occur. We have performed this analysis with respect to motion for summary judgment using a limited number of cases for NERA's proprietary database on securities class action settlements and using NERA's predicted settlement model. For cases with denied or partially denied motions for summary judgment, the median settlement is, on average, 62% above the one predicted using NERA's current predicted settlement model, which does not currently take into account such motions.
Securities Class Action Trials
The data presented in Figures 15 and 16 on settlements and dismissals show that these outcomes account for nearly all of resolved securities class actions. Few securities class actions proceed to trial, and fewer still reach a trial verdict.
Indeed, since the passage of the PSLRA in late 1995, there have been only 29 securities class action trials, as compared to a total number of over 3,800 filings. Table 1 provides details of cases that have gone to trial over this period. Plaintiffs have prevailed in seven cases, defendants have won 10, and the other 12 trial cases resulted in mixed verdicts, settlements during trial, or a default judgment. The status of these 29 shareholder class actions trials is depicted graphically in Figure 17.

In December of this year, a settlement of $145 million was reached in the Apollo Group Securities litigation. The case had been filed in 2004 in the District of Arizona in the Ninth Circuit. In January 2008, a verdict for the plaintiffs resulted in an award estimated at $277.5 million in the aggregate; later that year, however, the verdict was reversed and the award vacated. In June 2010, however, the verdict was reinstated by the Ninth Circuit Court of Appeals, and in March 2011 the Supreme Court declined to hear the case. The case had been returned to district court, where further procedural issues remained to be heard, when the settlement was announced.
There were also several notable developments in the first half of the year. In February 2011, a jury found for plaintiffs in the Homestore litigation, against the company's former CEO Stuart Wolff, the sole remaining defendant, and in April 2011, a jury verdict against BankAtlantic Bankcorp, Inc. was set aside in the only credit crisis-related case to go to trial.


Proportion of Settlements with a "Blow-Up" Provision
A "blow-up" provision typically states that the settlement will be invalidated if more than a certain proportion of the class opts out. In 2011, the proportion of settlements with such provisions increased to a record 40% of all settlements. That proportion had never previously exceeded 30%. See Figure 18.

Information on the proportion of investors who opt out of class actions is not publicly available, but the increasing use of blow-up provisions may reflect an increasing tendency of investors to opt out. The use of blow-up provisions reflects defendants' efforts to ensure that a settlement disposes of a significant part of the litigation risk and that any outstanding claims will be on behalf of a relatively minor portion of the class.
Proportion of Settled Cases with a Parallel Derivative Action
In 2011, 56% of settled cases had a parallel derivative action. This proportion is somewhat lower than last year, but remains above 50%, as has been the case since 2007. See Figure 19.

Settlements
Because most securities class actions ultimately settle, we analyze settlement trends in depth. One statistic of interest is the annual average settlements: by this measure, settlements have fallen this year, with settlements in 2011 averaging $31 million, well below the 2010 average of $108 million. See Figure 20.

However, the annual average settlement can be affected substantially by outliers: very small or very large settlements. For example, the 2010 figure includes the $7.2 billion Enron settlement.10 If we exclude the very largest settlements—those exceeding $1 billion—as well as the 309 small settlements that were approved in 2009 for IPO laddering cases (most of which were filed in 2001), there is still a substantial decline from 2010 to 2011, albeit not as steep: from $40 million in 2010 to $31 million this year. See Figure 21.

An alternative metric is the annual median settlement amount: the level that half of all settlements that year exceeded and half fell below. In a sense, this provides a measure of the size of a typical settlement. In 2010, the median settlement reached an all-time high of $11 million, but in 2011, it fell to $8.7 million, below the previous two years but still the third highest on record. See Figure 22.

Distribution of Settlements
Figure 23 shows that 54% of cases that settled in 2011 or have a scheduled court approval date from January to December 2011 did so for less than $10 million, well up from the 41% observed in 2010, but roughly in line with the proportion observed in 2006 through 2009.11

Turning to the upper end of the distribution, only 6% of 2011 settlements (five settlements in total) were for more than $100 million, down from 8% in the prior year. The largest settlement approved in 2011, by far, was for $627 million in the Wachovia Preferred Securities and Bond/Notes matter featuring credit crisis-related allegations.12
Table 2 presents the top 10 securities class action settlements of all time. These settlements all exceed $1 billion, and therefore no settlements from 2011 are included on the list.

The aggregate amount paid in settlements is at its lowest level since 2004. See Figure 24. This is due both to a low average settlement and relatively few cases settling this year. The number of cases for which settlement was approved in 2011 is the lowest since the passage of the PSLRA.

Institutional and Pension Plan Lead Plaintiff Participation
The proportion of settled cases with an institutional lead plaintiff has risen sharply, as has the fraction of such settlements in which the institutional lead plaintiff was a public pension plan. NERA's research on the factors that explain the amounts for which cases have settled historically finds that institutional lead plaintiff participation is associated with larger settlements. In the last several years we have noticed a trend towards increased participation by institutions as lead plaintiffs. That proportion is somewhat lower this year than in 2009 or 2010, but at 62.8% it is above the levels observed prior to 2009. Public pension plans accounted for more than half of institutional lead plaintiffs in 2011. See Figure 25.

Plaintiffs' Attorneys' Fees and Expenses
The settlement values that we report include plaintiffs' attorney fees and expenses, in addition to the amounts ultimately paid to the class. Figure 26 shows fees and expenses as a proportion of settlement value for settlements finalized from 1996 to 2011.

In general, the proportion of a settlement taken by fees and expenses declines as the settlement size rises. For settlements below $5 million, for example, the median plaintiffs' attorney fees are a third of the settlement amount, while for settlements of over $500 million, fees fall to below 10%. Median plaintiff expense ratios fall over this settlement range as well, from 5.4% for settlements below $5 million to 0.5% for settlements above $500 million.
Aggregate plaintiffs' attorneys' fees fell in 2011 to their lowest level since 2004. We attribute this decline to a combination of the lower average and median settlement size, and fewer settlements (87 in 2011 as compared to 110 in 2010 and 108 in 2009 not related to IPO laddering cases). See Figure 27.

Investor Losses versus Settlements
Historically, "investor losses" have been a powerful predictor of settlement size. NERA's investor losses variable is a proxy for the aggregate amount that class period buyers of the stock of the issuer defendant lost from holding that stock rather than investing in the broader market. The variable explains more than half of the variance in the settlements in our database.13
In general, as investor losses grow, so does settlement size, but the relationship is not linear. In particular, settlement size tends to rise less than proportionately, so small cases typically settle for a higher fraction of investor losses (i.e., more cents on the dollar) than larger cases. For example, cases with investor losses below $20 million on average settle for 38.0% of investor losses, while cases with investor losses over $1 billion settle for an average of 2.3% of investor losses. See Figure 28.

Note that the investor losses variable is not a measure of damages; rather it is a rough proxy for the size of investors' claims. Thus, our findings on the ratio of settlement to investor losses should not be interpreted as the share of damages recovered in settlement but rather as the recovery compared to a rough measure of the "size" of the case.
Median investor losses for settled cases have soared post-PSLRA, from $64 million for 1996 settlements to a record $911 million for cases settling in the first half of 2011.14 In July, we noted that a combination of low settlement values and record high median investor losses ($911 million) had driven the median ratio of settlement size to investor losses to a record low of 1.0% in the first half of 2011. We suggested that settlements may have been depressed by the effect of the economic downturn on defendants' ability to pay.
Looking at the data for 2011 as a whole, the picture has changed somewhat since we last reported in our mid-year release. As Figure 29 indicates, median investor losses were $493 million for 2011, well below the level that prevailed in the first half of this year. Nonetheless, median investor losses in 2011 are the second highest on record.

At 1.3%, the median ratio of settlement to investor losses is a post-PSLRA low. See Figure 30.

Investor losses in credit crisis cases have generally exceeded losses in other types of cases. For cases filed in 2011, this pattern was particularly striking, with median investor losses for credit crisis cases reaching nearly $18 billion as compared to $240 million for other cases. See Figure 31. Note that there are only five credit crisis-related cases that were filed in 2011, and caution should be used when drawing any conclusions based on such a small sample.

Because of the strong statistical relationship between investor losses and settlement size described above, investor losses for recent filings give some indication of what settlement values can be expected when these cases settle in the future. By comparing investor losses for cases that have settled in a particular year with investor losses for cases filed in that year, we can get a sense of how settlements over the subsequent few years are likely to compare with settlements in that year.
Prior to the credit crisis, the median value of investor losses for cases settled in a particular year was consistently higher than for cases filed in that year. This pattern reversed itself during 2007-2009, however, as the credit crisis produced filings of cases with very high investor losses. However, the pre-credit crisis pattern returned last year and has continued to hold in 2011, with median investor losses once again lower for newly filed cases than for newly settled cases. See Figure 32.

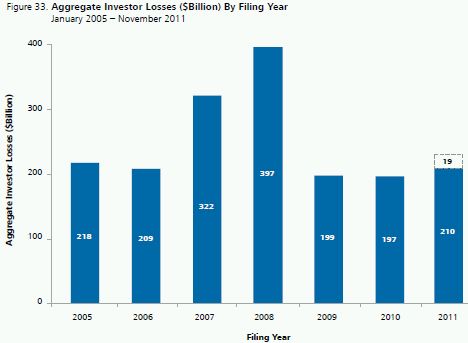
Cases filed over the first 11 months of this year had aggregate investor losses of $210 billion; if this pace persists in December, total investor losses for cases filed in 2011 will be $229 billion, exceeding 2009 and 2010 and slightly exceeding the average aggregate investor losses prior to 2007. See Figure 33.
Conclusion
The year 2011 may be remembered as the year that saw the explosion of Chinese company-related lawsuits, the continued dominance of M&A cases alleging breach of fiduciary duty, and the sunset of credit crisis-related litigation. However, other notable developments that merit mention include the third highest median settlement value on record, a relatively low recovery rate by plaintiffs, and, for a second year, relatively low median investor losses for filed cases, which may point to a decline in the size of settlements going forward.
Looking ahead, it would be interesting to see how the level of filings will change or whether new categories of litigation will emerge.
Footnotes
1 This edition of NERA's research on recent trends in shareholder class action litigation expands on previous work by our colleagues Lucy Allen, Elaine Buckberg, Frederick C. Dunbar, Todd Foster, Vinita M. Juneja, Denise Neumann Martin, Ronald I. Miller, Stephanie Plancich, and David I. Tabak. We gratefully acknowledge their contribution to previous editions as well as this current version. The authors also thank Jake George and David I. Tabak for helpful comments to this version. In addition, we thank Carlos Soto, Nicole Roman, and other researchers in NERA's Securities and Finance Practice for their valuable assistance with this paper. These individuals receive credit for improving this paper; all errors and omissions are ours.
2 NERA tracks class actions filed in federal court and involving alleged violations of the federal securities laws. If multiple such actions are filed against the same defendant, are related to the same allegations, and are in the same circuit, we treat them as a single filing. However, multiple actions filed in different circuits are treated as separate filings. If cases filed in different circuits are consolidated, we revise our count to reflect that consolidation. Therefore, our count for a particular year may change over time. Different assumptions for consolidating filings would likely lead to counts that are directionally similar but may, in certain circumstances, lead observers to draw a different conclusion about short-term trends in filings.
3 Any discussion regarding filings in 2011 refers to filings from January 1, 2011 to November 30, 2011.
4 Our normal approach to geographical classification is to use the country of domicile for the defendant company. Many of the defendant Chinese companies, however, obtained their US listing through a reverse merger, and consequently report a US domicile. For this reason, we have also tracked companies listed as having their principal executive offices in China.
5 In our presentation of annual filings in Figure 1, we break out certain types of cases of special interest including, in recent years, cases relating to the credit crisis, options backdating, Ponzi schemes, and mergers and acquisitions, with the balance of filings labeled as "standard." We do not treat as non-standard filings against issuers from a particular country, such as China, as they are similar to other cases in terms of allegations. However, because these cases are of special interest due to the unprecedented number of suits against issuers from that one country, in Figure 3 we present them as separate from standard filings, a possible alternative view.
6 That limitation applies as to "a claim of fraud, deceit, manipulation, or contrivance in contravention of a regulatory requirement concerning the securities laws, as defined in section 3(a)(47) of the Securities Exchange Act of 1934 (15 U.S.C. 78c (a)(47))." See 28 U.S.C. 1658(b). On the other hand, the explicit language of Section 13 of the Securities Act of 1933, applicable to claims alleging violations of Sections 11 and 12 of that Act, requires that actions must be brought within one year "after the discovery of the untrue statement or the omission, or after such discovery should have been made by the exercise of reasonable diligence." See 15 U. S. C. §77m.
7 Jory, Surendranath and Mark J. Perry, "Ponzi Schemes: A Critical Analysis," Journal of Financial Planning, July 2011. Available at: http://www.fpanet.org/journal/BetweentheIssues/LastMonth/Articles/PonziSchemes/.
8 Subtracting the 29 suits against Chinese-domiciled companies in 2011 from both the total number of filings against foreign issuers and from total filings, the proportion of 2011 suits against foreign issuers in January through November 2011 would be 27 of 184, or 14.7%. As can be seen from Figure 11, this would fall slightly below the proportion in the last three years.
9 Four cases filed in 2000 went to trial; all settled and are included in settled cases.
10 Even though parties had reached a last partial tentative settlement prior to 2010, this tentative settlement received final court approval in February 2010.
11 Settlements are assigned to the year of final court approval; thus our count of 2011 settlements includes announced settlements with a court hearing scheduled for December.
12 In re Wachovia Preferred Securities and Bond/Notes Litigation, Master File No. 09 Civ. 6351 (RJS) (S.D.N.Y.).
13 Technically, the investor losses variable explains more than half of the variance in the logarithm of settlement size. Investor losses over the class period are measured relative to the S&P 500, using a proportional decay trading model to estimate the number of affected shares of common stock. We measure investor losses only if the proposed class period is at least two days; this restriction effectively excludes merger objection cases from our investor losses statistics. Our sample includes more than 1,000 post- PSLRA settlements.
14 See Figure 33, "Recent Trends in Securities Class Action Litigation: 2011 Mid-Year Review," by Dr. Jordan Milev, Robert Patton, and Svetlana Starykh.
The content of this article is intended to provide a general guide to the subject matter. Specialist advice should be sought about your specific circumstances.

