
US IPO MARKET REVIEW AND OUTLOOK
Market Review
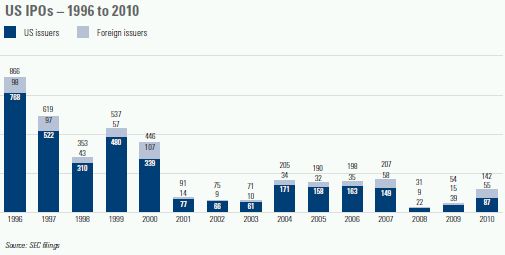
The IPO market continued to rebound throughout 2010, producing 142 IPOs. The year's total was almost triple the tally of 54 IPOs in 2009, which itself represented a significant step up from the paltry output of 31 IPOs in 2008— the lowest annual count since 1975.
The momentum that brought a spike in deal volume at the end of 2009 continued throughout 2010, as both economic and capital market conditions improved. Quarterly volume ranged from 24 to 34 IPOs in the first three quarters of 2010. Deal flow jumped to 54 IPOs in the fourth quarter of 2010—equal to the full-year 2009 total—enabling the market to enter 2011 on a high note.
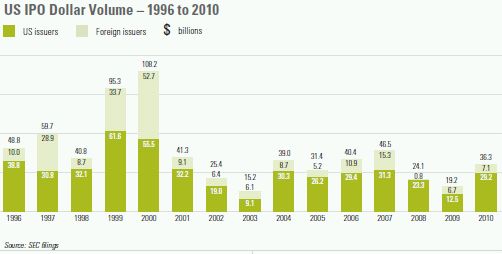
The 142 IPOs in 2010 generated gross proceeds of $36.3 billion, with both figures representing the largest totals since 2007. Boosted by General Motors' gargantuan $20.1 billion offering— the largest IPO in US history—gross proceeds in 2010 were nearly double the prior year's total of $19.2 billion.
Although it pales next to the annual average of 500-plus IPOs of the late 1990s, the total of 142 IPOs in 2010 approached the annual run rate of about 200 IPOs that prevailed from 2004 to 2007.
Individual components of the IPO market fared as follows in 2010:
- The number of venture capital–backed IPOs soared to 46 in 2010. This deal volume was a welcome relief to venture capitalists, who had suffered through the dark days of 2008 and 2009 with a two-year total of only 15 offerings. At 32%, the 2010 market share for VC-backed IPOs was consistent with historical patterns. Most of these venture capital–backed IPOs were by companies in technology or life sciences.
- Private equity–backed IPOs grabbed 27% of the market in 2010, with 39 offerings. Financial sponsors, hobbled by tight credit from late 2007 through 2009, were anxious to take their portfolio companies public. PE-backed companies tend to be large and mature and to produce very large IPOs, such as those of Hyatt Hotels in 2009 and Sensata Technologies in 2010.
- The technology sector remained strong in 2010. Tech-related companies produced 53% of the year's IPOs, down slightly from 56% in 2009.
- Foreign issuers accounted for 39% of the market in 2010, the highest such percentage in at least 15 years. China continued to be the predominant source of foreign-issuer IPOs in the United States, producing a staggering total of 40 IPOs—which represented 28% of the entire US market in 2010.
With a total offering size of $20.1 billion, General Motors produced the largest IPO of the year, by a wide margin. The year's next-largest IPOs were from Swift Transportation ($806.3 million), SMART Technologies ($660.1 million) and Oasis Petroleum ($588.0 million).
Aftermarket performance was stronger in 2010 than in 2009. The average 2010 IPO appreciated 28% by the end of the year, and 68% of the year's IPOs were trading at or above their offering price at year-end. In 2009, the average IPO appreciated 18% during the year, and 65% of the year's IPOs were trading at or above their offering price at year-end. In sharp contrast, the average 2008 IPO was 36% below its offering price at the end of 2008, and only 16% of that year's IPOs were trading at or above their offering price at year-end 2008.
In 2010, there was only one "moonshot" (an IPO that doubles in price on its opening day)—Chinese Internet TV company Youku.com jumped 161% in first-day trading. The year's other top performers out of the blocks were ChinaCache International Holdings (up 95% on its opening day), MakeMyTrip (up 89%) and E-Commerce China Dangdang (up 87%). Overall, all but one of the year's top-ten first-day gains came from IPOs by foreign issuers, and Chinese issuers accounted for seven of the top ten.
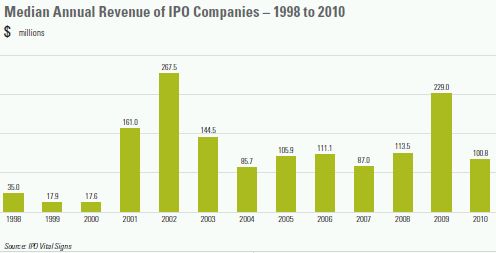
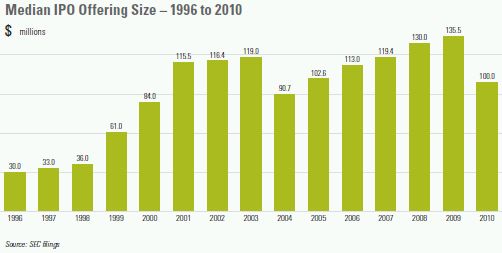
IPO companies were smaller and less profitable in 2010 than in recent years. The percentage of profitable companies going public dropped from a record 82% in 2009 to 59% in 2010—the lowest percentage since the tail of the dotcom boom in 2001. The median annual revenue of IPO companies plunged from $229.0 million in 2009 to $100.8 million in 2010. Both metrics reversed, at least temporarily, a long-term trend toward larger and more profitable IPO companies.
In 2010, 49 IPOs were completed by companies based in the eastern United States (east of the Mississippi River), western US–based issuers accounted for 38 IPOs, and foreign issuers accounted for the remaining 55 IPOs.

Outlook
In broad terms, the US IPO market has gone through six phases over the past two decades or so:
- 1991 to 1998—Reasonably stable market, producing an average of 565 IPOs per year
- 1999 and 2000—Go-go market characterized by marginally qualified IPO companies and rampant price euphoria (although annual deal volume was 13% lower than in the preceding eight years)
- 2001 to mid-2003—Very selective market, in which deal volumes fell substantially and IPO candidates were held to much higher standards
- Mid-2003 through 2007—Solid market recovery, although not approaching the deal volumes that prevailed for most of the 1990s
- 2008—Market bottoms out under the combined burden of an economic recession and plunging capital markets
- 2009 and 2010—Market rebounds from historic lows, but not yet to the deal levels of 2004 to 2007

We remain fundamentally optimistic about the long-term prospects for the IPO market. The continuation and expansion of the IPO market recovery will depend on a number of factors. The major factors are neither mysterious nor easy to predict:
- Economic Conditions: Economic growth is a key determinant of strength in the capital markets. By late 2007, five years of economic expansion—largely driven by strong consumer spending, boosted by low interest rates, tax cuts and increased borrowing against home equity—had sputtered to an end. The recession that followed was longer and more severe than almost anyone anticipated. Although it had begun to recover by mid-2009, the economy has continued to send mixed signals and the timing and extent of economic growth is uncertain.
- Capital Market Conditions: Stable and robust capital markets are a leading indicator of IPO activity. After sharply declining in 2008, the Nasdaq stabilized in the first quarter of 2009 and then surged to post a full-year gain of 44% by yearend. Similarly, the Dow recovered from its March low point and increased 19% for all of 2009. In 2010, the Nasdaq grew another 17% and the Dow tacked on 11%.
- Institutional Appetite: IPOs are relatively risky investments, so the appetite of institutional investors for risk capital affects the IPO market. When other parts of a portfolio feel risky, investors may stay away. These players are critical to the health of the IPO market.
- Impact of Regulatory Environment: The corporate governance reforms resulting from the adoption of the Sarbanes-Oxley Act in 2002 and the Dodd-Frank Act in 2010 have created new responsibilities for public companies and their directors and officers. These changes have helped improve accountability to stockholders, board oversight of management, board member qualifications and investor confidence—but have also increased the cost of being public, both in terms of potential liability and the expense of compliance. The more rigorous corporate governance environment may deter some IPO candidates. For most companies, however, the new and enhanced governance requirements can be assimilated into IPO planning and should not pose a major impediment to going public. Moreover, many of the consequences of these requirements—such as a robust finance and accounting organization— are needed in a growing enterprise, whether or not it ever pursues an IPO.
- Venture Capital Pipeline: Venture capitalists depend on IPOs—along with company sales—to provide liquidity to their investors. With the large increase in IPOs by venture capital–backed companies in 2010, the number of VC-backed companies entering IPO registration, or resuscitating dormant filings, has been increasing. Longer term, the pool of IPO candidates will be affected by current trends in venture capital investing, including the timeline from initial funding to IPO. According to Dow Jones VentureOne, the median time from initial equity financing to IPO rose to 8.1 years in 2010 from 7.9 years in 2009. As recently as 2004 and 2005, this figure hovered around 5.5 years.
- Private Equity Impact: Private equity investors also seek to divest portfolio companies or achieve liquidity through IPOs. PE-backed companies are usually larger and more seasoned than VC-backed companies or other start-ups pursuing IPOs, and thus can be strong candidates in a demanding IPO market. Private equity–backed IPOs flourished in 2010 and can be expected to continue to enter the IPO market as conditions permit.
Market momentum has continued into 2011, with year-to-date IPO volume outpacing that of 2010. High-profile offerings through mid-2011 included Dunkin' Brands ($423 million), HCA Holdings ($3.8 billion), LinkedIn ($353 million), Pandora Media ($235 million) and Yandex ($1.3 billion). Widely anticipated IPOs by several prominent social media companies, when they occur, should help further energize the market.
Profile of Successful IPO Candidates
What does it really take to go public? There is no single profile of a successful IPO company, but in general the most attractive candidates have the following attributes:
- Outstanding Management: An investment truism is that investors invest in people, and this is even more true for companies going public. Every company going public needs experienced and talented management with high integrity, a vision for the future, lots of energy to withstand the rigors of the IPO process, and a proven ability to execute.
- Market Differentiation: IPO candidates need a superior technology, product or service in a large and growing market. Ideally, they are viewed as market leaders. Appropriate intellectual property protection is expected of technology companies, and in some sectors patents are de rigueur.
- Substantial Revenues: With some exceptions, substantial revenues are expected—at least $50 million to $75 million annually—in order to provide a platform for attractive levels of profitability and market capitalization.
- Revenue Growth: Consistent and strong revenue growth—25% or more annually— is usually needed, unless the company has other compelling features. The company should be able to anticipate continued and predictable expansion to avoid the market punishment that accompanies revenue and earnings surprises.
- Profitability: Strong IPO candidates often have track records of earnings and a demonstrated ability to enhance margins over time.
- Market Capitalization: The company's potential market capitalization should be at least $200 million to $250 million, in order to facilitate development of a liquid trading market. If a large portion of the company will be owned by insiders following the IPO, a larger market cap may be needed to provide ample float.
All IPO companies need top executive talent, a strong competitive position, adequate market capitalization and deal-savvy advisors, but other factors can vary based on a company's industry and size. For example, many biotech companies will have much smaller revenues and not be profitable. More mature companies are likely to have greater revenues and market caps, but slower growth rates. High-growth companies are likely to be smaller, and usually have a shorter history of profitability.
Beyond these objective measures, IPO candidates need to be ready for public ownership in a range of other areas, including employee recruitment and retention; accounting preparation; corporate governance; financial and disclosure controls and procedures; external communications; and a variety of corporate housekeeping tasks.
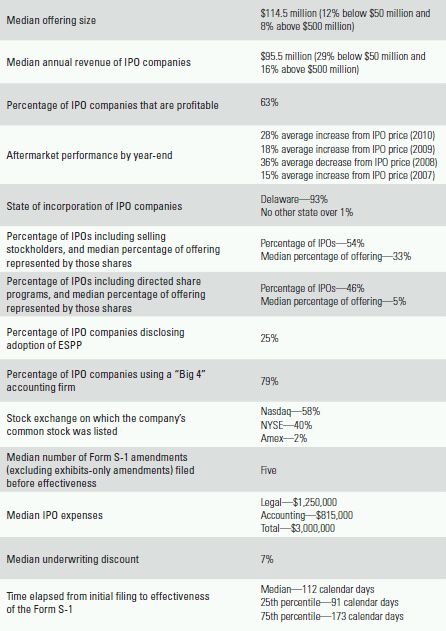
How Do You Compare? Some Facts About the IPO Market
Set forth below are selected metrics about the IPO market, based on combined data for all US IPOs from 2007 through 2010.
LAW FIRM AND UNDERWRITER RANKINGS


COUNSEL OF CHOICE FOR PUBLIC OFFERINGS
Serving Industry Leaders in Technology, Life Sciences, Cleantech, Financial Services, Communications and Beyond
REGIONAL IPO MARKET REVIEW AND OUTLOOK
California
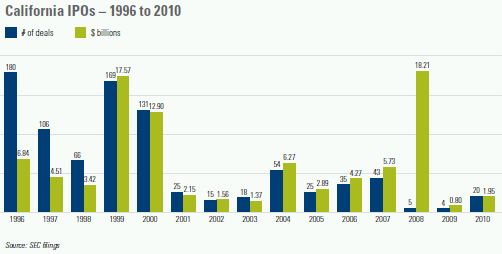
The number of California IPOs surged from four in 2009—the lowest number in decades—to 20 in 2010. Gross proceeds grew more modestly, from $0.80 billion to $1.95 billion, as the average deal size dropped to $97.5 million. With these results, IPO activity in California topped the levels of 2002 and 2003, but remained below the levels of 2004 to 2007.
California's largest and most prominent IPO of 2010 was by electric car maker Tesla Motors, which in June raised $226.1 million to become the first American automaker to go public in more than half a century (later in the year, General Motors followed suit). Other large California IPOs in 2010 came from Pacific Biosciences of California ($200.0 million), RealD ($200.0 million), Green Dot ($164.1 million) and QuinStreet ($150.0 million).
The average California IPO in 2010 ended the year 19% above its offering price—boosted by the strong aftermarket performance of Amyris (up 67%), Inphi (also up 67%) and Financial Engines (up 65%).
The California IPO market historically has been dominated by technology-related companies, with tech IPOs routinely accounting for 80% to 90% of the total number of the state's offerings. This trend was borne out in 2010 and is likely to continue.
With capital market and economic conditions improving, California IPO activity should continue to rebound. Several prominent California-based social media companies are widely expected to launch IPOs within the next year. Other emerging companies that demonstrate strong growth in revenue and profitability can also be expected to come to market.
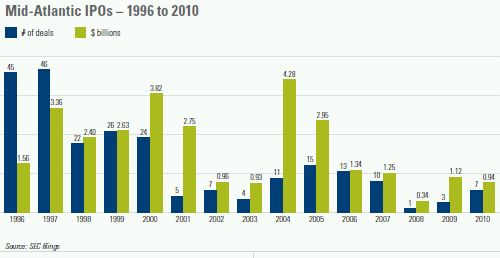
Mid-Atlantic
The mid-Atlantic region of Virginia, Maryland, North Carolina, Delaware and the District of Columbia produced seven IPOs in 2010, up from three in 2009. Gross proceeds dipped from $1.12 billion to $0.94 billion, primarily because 2009's proceeds were skewed by one large IPO. Average deal size in the region in 2010 was $134.8 million.
The region's largest IPOs of 2010 were by The Fresh Market ($289.9 million), Booz Allen Hamilton Holding ($238.0 million), Primo Water ($100.0 million) and Walker & Dunlop (also $100.0 million).
With three IPOs each, Maryland and North Carolina were the leading sources of IPOs from the mid-Atlantic region in 2010. Virginia contributed the region's other IPO of 2010.
The region's IPOs performed exceptionally well in the aftermarket. The average mid-Atlantic IPO of 2010 ended the year 53% above its offering price. The region's best performers were BroadSoft (up 165%), The Fresh Market (up 87%) and KEYW Holding (up 47%).
Technology- and defense-related companies historically have contributed a significant portion of the mid- Atlantic region's IPO deal flow. We expect this pattern to continue as IPO activity increases in the region.
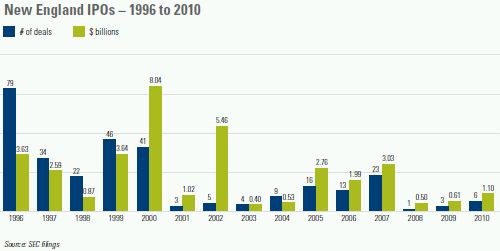
New England
New England doubled its IPO output in 2010, with six IPOs, compared to three in the prior year. Proceeds also nearly doubled, growing from $0.61 billion to $1.10 billion, as average deal size hit $182.4 million in 2010.
Massachusetts led the region in 2010, with four IPOs, followed by Connecticut with two. New England's 2010 offerings spanned the region's traditional strengths in software, biopharmaceuticals and financial services. In 2010, the region's largest IPOs were by LPL Investment Holdings ($469.7 million), Ironwood Pharmaceuticals ($187.5 million) and SS&C Technologies Holdings ($160.9 million).
Five of the region's six IPOs in 2010 increased in price by year-end, and the region's average IPO gained 37% during the year. The best-performing New England IPOs of 2010 were Higher One Holdings (up 69%), AVEO Pharmaceuticals (up 62%) and Ameresco (up 44%).
We expect that strong levels of venture capital investment in New England, along with the region's world-renowned universities and research institutions, will continue to provide a fertile environment for new companies. Although New England is unlikely to return to the giddy days of 1996 through 2000, when it produced an annual average of 44 IPOs, the region remains a natural wellspring of IPO candidates.
Tri-State
The number of IPOs in the tri-state region of New York, New Jersey and Pennsylvania grew from nine in 2009 to 14 in 2010. Gross proceeds, however, plunged from $3.76 billion to $1.52 billion, primarily because in 2009 one very large IPO accounted for more than half of the year's proceeds. Average deal size in 2010 was $108.8 million.
In 2010, New York resumed the region's lead role with seven IPOs, followed by Pennsylvania with four and New Jersey with three.
The region's largest IPOs in 2010 were by Aeroflex Holding ($232.9 million), Baltic Trading ($228.2 million) and FXCM ($210.8 million).
IPOs by tri-state companies in 2010 appreciated an average of 15% by year-end. The region's best performers were Qlik Technologies (up 159%), Aegerion Pharmaceuticals (up 49%) and IntraLinks Holdings (up 44%).
Venture capital activity in the tri-state region now trails only that of California and New England. We expect that VC-backed companies— including those from the technology and life sciences sectors—as well as spin-offs from the region's established companies, will be IPO candidates as the IPO market continues to improve. The Web 2.0 sector should produce additional IPOs from the region.

SPECIAL ISSUES FOR SPECIAL ISSUERS
For some companies, the IPO journey takes a road less traveled. Although these IPOs have many features in common with more conventional IPOs, they also involve different considerations. Discussed below are several IPO structures that present special issues.
Spin-Off IPOs
The term "spin-off " is used loosely to refer to a variety of transactions. For example, a spin-off occurs when a public company dividends the shares of a subsidiary to its stockholders, thereby creating two separate public companies without an IPO. The phrase "spin-off IPO" refers to the sale of an ownership position in a subsidiary to the public, with the parent selling some or all of its shares in the subsidiary and/or the subsidiary issuing new shares. A spin-off IPO is sometimes combined with the parent's distribution of its remaining shares in the subsidiary to the parent's stockholders.
A spin-off IPO usually requires more extensive preparations than a conventional IPO. In addition to planning for the subsidiary's IPO and public company life, a spin-off IPO involves a number of other elements:
- Transaction Planning: A transaction structure must be developed to achieve the desired operating, tax and financial objectives.
- Establishment of Subsidiary: The business to be spun off must be segregated into a separate subsidiary, holding the correct assets, liabilities and employees, and the infrastructure of a separate company must be created.
- Parent-Subsidiary Relationship: The parent and subsidiary need to determine their post-IPO relationship, including the terms of inter-company agreements and transition services agreements. The parent also may wish to implement mechanisms to retain control of the subsidiary.
- Controlled Company Rules: If the parent holds a majority of the voting power for the election of the subsidiary's directors, the subsidiary will be a "controlled company" and entitled to exemptions from some corporate governance requirements under Nasdaq and NYSE rules.
- Additional Disclosure: The Form S-1 requires various disclosures that are ordinarily not necessary for other types of IPOs, such as a description of the transaction structure and its tax and accounting consequences, and a summary of the agreements between the parent and the subsidiary.
Spin-off IPOs are a staple of the market. Recent prominent examples include Mead Johnson Nutrition (from Bristol-Myers Squibb) in 2009 and Primerica (from Citigroup) in 2010.
Tracking Stock IPOs
To issue tracking stock, a parent company creates a new class of stock to "track" the economic performance of a specific subsidiary, division or other business unit, but the investor does not actually receive an ownership position in the specific business being tracked, and that business unit is not actually separated from the parent. A tracking stock is intended to function in a manner similar to a spinoff, by allowing the tracked business to be separately highlighted and valued in the public market, while preserving ownership and control for the parent.
From an investor's perspective, there are several downsides to a tracking stock structure:
- the tracked business usually lacks the kind of corporate governance arrangements that would be present in a freestanding company;
- the investor has no direct voting rights with respect to the tracked business;
- potential conflicts exist between the interests of the parent and the tracked business;
- an investment in a tracked stock is subject to risks associated with all of the parent's businesses, assets and liabilities; and
- a tracking stock is immune from unsolicited acquisition bids and any accompanying takeover premium.
A tracking stock IPO is not as complex as a spin-off IPO, primarily because most of the separation arrangements involved with a spin-off are not required. The parent usually creates new equity incentive plans for the management and employees of the tracked business, but few other indicia of independent operations. Perhaps the biggest challenge in a tracking stock IPO is to accurately describe and delimit the tracked business in a manner that permits separate financial statements for it to be prepared and audited. The Form S-1 needs to describe the investors' rights in the tracked business and the potential conflicts of interest.
Tracking stock IPOs tend to appear when a high-growth market sector emerges and large, diversified companies want to showcase their operations in that sector. Never representing a large segment of the market, tracking stock IPOs have all but disappeared in favor of structures that afford more transparency and investor protections.
Rule 144A IPOs
A "Rule 144A IPO" is a Rule 144A placement by a private company, coupled with an agreement to register the securities for public resale or a commitment to register as a reporting company under the Exchange Act following completion of the placement. A Rule 144A IPO is not an IPO in the usual sense, but can function as an alternative to a conventional IPO.
The principal advantage of a Rule 144A IPO is that it can provide the company with as much capital as a conventional IPO—but much more rapidly because SEC review is bypassed. Other advantages include greater flexibility in the disclosure and offering process and the company's corporate governance arrangements, and the potential ability to delay compliance with public company obligations.
Compared to a conventional IPO, a Rule 144A IPO has several disadvantages:
- the Rule 144A IPO market is concentrated in a few sectors and limited to more mature companies than the market for conventional IPOs, effectively excluding many prototypical IPO candidates;
- the stock is priced with an illiquidity discount;
- it may be difficult to satisfy the public float and round-lot stockholder requirements for stock exchange listing;
- unless the stock is exchange-listed, the offering does not create a market for employee equity incentives or liquid stock currency for acquisitions; and
- research coverage may be more difficult, if not impossible, to obtain.
Moreover, the benefit of avoiding public company obligations may be temporary, since the company usually agrees to register the Rule 144A securities for public resale or register as a reporting company, typically within one year after the placement.
Rule 144A IPOs have been reported as far back as the early 1990s. After gaining in popularity between 2005 and 2007, when approximately 40 transactions were completed (primarily by REITs and energy and financial services companies), there were no Rule 144A IPOs in 2008 and only one in each of the last two years.
Post-Bankruptcy IPOs
Occasionally a company that has emerged from bankruptcy proceedings will subsequently pursue an IPO. A company in these circumstances is likely to have been a public company that deregistered in conjunction with its bankruptcy proceedings. The subsequent IPO could be prompted by registration rights given to creditors or stockholders in the bankruptcy, or could be desired by the company for its own reasons.
A post-bankruptcy IPO presents several noteworthy issues:
- Fresh-Start Accounting: Upon emerging from bankruptcy, the company will adopt "fresh-start" accounting. Although both pre- and post-bankruptcy results and financial statements must be presented in the Form S-1, these results will not be directly comparable, and the company may find it difficult to go public until it has several post-bankruptcy periods that can be compared.
- Bankruptcy Disclosures: The company will need to discuss its past financial difficulties and will be unable to focus exclusively on its "new" strategies, management, capital structure and prospects. Disclosure will also be required if any member of management was a director or officer of the company at the time of its bankruptcy (if it occurred within the preceding 10 years).
- Offering Limitations: A company that has been subject to a bankruptcy petition within the prior three years is not permitted to use an electronic road show, and its use of free writing prospectuses is limited to a description of the terms of the securities and the offering.
- Exchange Listing: Although Nasdaq and the NYSE do not preclude the listing of companies that previously filed for bankruptcy, a past bankruptcy could affect an exchange's subjective judgment of the merits of the application.
When economic conditions weaken, some public companies inevitably fail, due to excessive debt or other factors. As the financial cycle plays out, some of these companies eventually return to the public market with IPOs. The most prominent post-bankruptcy IPO of recent years was that of General Motors, whose 2010 IPO consisted of a $15.77 billion common stock offering by selling stockholders (former creditors) and a concurrent $4.35 billion preferred stock offering by GM.
Reverse-Merger IPOs
A "reverse-merger IPO" is not really an IPO, but rather is a mechanism for a private company to become a public company. In a typical reverse merger, a private company with an operating business merges into a public shell company without an operating business, and the private company's stockholders receive a majority of the stock of the surviving company.
The reverse-merger route to public ownership presents several special challenges:
- Merger Agreement: The transaction begins with a merger agreement defining the terms and conditions of the transaction. Every issue present in any business combination—ownership, management and integration, to list just a few—must be resolved.
- Due Diligence: The surviving company is responsible for the liabilities incurred and actions taken by the shell company before the merger. The private company merging into the shell company must carefully examine the corporate history and pre-merger activities of the shell company to make sure it is not inheriting unexpected liabilities.
- SEC Filing and Review: A reverse-merger transaction usually requires a merger proxy statement or a Form S-4 registration statement. These filings typically are more complicated and time-intensive to prepare than a Form S-1 for a conventional IPO, and SEC review usually takes longer than review of a Form S-1 for an IPO or a public-public merger proxy statement.
- Blue Sky Laws: If the shell company is not listed on a national securities exchange, its issuance of shares in the merger transaction will not be exempt from state securities "blue sky" laws. As a result, the shell company will be forced to comply with additional filing and disclosure requirements in all applicable states.
In many cases, it is puzzling why a private company that aspires to become a substantial public company would pursue a reverse merger with a shell company. The transaction is often more difficult and expensive than a traditional IPO, and the results usually less satisfactory. Still, reverse mergers enjoy enduring appeal. By some estimates, close to half of all companies traded on the Over-the-Counter Bulletin Board went public in reverse-merger transactions. Perhaps the best explanation of this phenomenon is that it represents the continuing triumph of hope over experience.
POST-IPO FINANCING TECHNIQUES
An IPO is a major milestone for any company, but the offering proceeds usually do not satisfy the company's capital requirements indefinitely. Several post-IPO financing alternatives are discussed below.
Follow-On Public Offerings
A public offering of securities after an IPO—termed a follow-on public offering—can be used to raise additional equity or debt capital. Follow-on public offerings can involve a wide variety of securities and structures, and are usually underwritten. Depending on how long the company has been filing periodic reports with the SEC, the size of its public float and other considerations, follow-on public offerings are conducted on different types of registration statements with varying disclosure requirements and timelines from filing to closing.
Form S-1. Unless the company is eligible to use a Form S-3, a follow-on public offering must be registered on a Form S-1. The Form S-1's disclosure requirements for a follow-on public offering of common stock are substantially the same as for an IPO (a debt offering has additional disclosure requirements). In some circumstances, a public company may incorporate by reference information from its prior Exchange Act filings into a Form S-1.
Form S-3. Use of Form S-3 can provide significant time and transaction cost savings, by permitting the company to incorporate by reference information from the company's prior Exchange Act filings, rather than repeat that information in the Form S-3, and to incorporate by reference information from its future Exchange Act filings, rather than amend the Form S-3 to add that information. If the offering is underwritten, the company often voluntarily includes more extensive information than required by the Form S-3 rules in order to enhance the marketing of the offering.
Shelf Offerings. If the company is eligible to use Form S-3, it can conduct primary "shelf" offerings pursuant to Rule 415 under the Securities Act. In a shelf offering, the Form S-3 is filed, undergoes SEC review (if any) and is declared effective in advance of an offering. During the ensuing three years, the company can offer equity or debt securities registered on the Form S-3 pursuant to a prospectus supplement that describes the specific offering terms and is filed with the SEC within two business days after pricing— without further SEC action. The company may file another shelf Form S-3 when all securities covered by the Form S-3 have been sold or the three-year time limit is reached. Subject to market conditions, Rule 415 provides eligible companies with the ability to access the public capital markets on short notice as needed.
WKSI Shelf Offerings. A special category of public company called a well-known seasoned issuer (WKSI) enjoys even more flexibility. A WKSI may file a shelf registration statement on Form S-3 that becomes automatically effective, bypassing SEC review completely, and use prospectus supplements to offer and sell securities under the Form S-3 for a period of up to three years. As a result, a WKSI can make registered public offerings of equity or debt securities at will and reap the maximum time-to-market advantage.
At-the-Market Offerings. In an at-the-market (ATM) offering, the company sells securities (typically common stock) from an effective shelf registration statement at the prevailing market price, rather than negotiating a fixed price directly with investors. Upon establishing the arrangements for an ATM offering, the company files a prospectus supplement describing the offering; completed sales are either disclosed in subsequent Form 10-Qs and Form 10-Ks or announced sooner, if material. For larger companies with substantial public floats that can absorb additional shares, ATM offerings can provide undiscounted access to the capital markets, alone or in conjunction with other financing sources.
Hybrid Public-Private Offerings. In a registered direct offering (RDO) or a confidentially marketed public offering (CMPO), company securities (typically common stock) that are subject to an effective shelf registration statement are confidentially marketed for several days to a targeted group of institutional investors. An RDO is announced after the company reaches agreement on the offering terms with investors, and a prospectus supplement describing the offering terms is then filed with the SEC. A CMPO is opened to the public after confidential marketing; the company issues a press release to announce the offering, immediately distributes a preliminary prospectus supplement to prospective investors, and then files the preliminary prospectus supplement with the SEC. Before the market opens on the next trading day, the CMPO is priced, the final prospectus supplement is distributed to investors, and both documents are filed with the SEC. Shares issued in an RDO or CMPO are sold at a discount from the market price.
Rule 144A Placements
In a Rule 144A placement, the company issues securities (typically debt or convertible debt) to an initial purchaser in a private placement that is exempt from registration pursuant to Section 4(2) of the Securities Act. The initial purchaser, which is usually an investment banking firm, then resells the securities to qualified institutional buyers (QIBs) under Rule 144A or in offshore transactions under Regulation S. The initial purchaser's resales are made pursuant to an offering memorandum or circular; the level of disclosure will depend on the nature of the company, offering and targeted investors. Rule 144A marketing practices vary, but often include a short road show or other investor meetings. The principal advantage of a Rule 144A placement over a registered follow-on public offering is that it enables a company to get to market quickly, without the risk of delays from SEC review of a pre-closing registration statement.
PIPE Financings
PIPE (private investment in public equity) financings are private placements conducted by public companies pursuant to exemptions from registration, typically Section 4(2) or Regulation D. A PIPE offering is typically marketed through an investment banking firm, acting as a placement agent. The placement agent conducts due diligence, structures the offering and solicits interest from potential investors with whom the placement agent or company has a pre-existing relationship (often employing a private placement memorandum). Investors sign financing agreements with the company, the company issues the PIPE securities (typically common stock or preferred stock) to the investors at a discount from the market price, and the placement agent collects a percentage fee from the company at closing. PIPE transactions are particularly favored by small-cap and mid-cap companies with substantial capital needs but limited access to the Rule 144A market.
Additional Considerations
Stockholder Approval. In general, companies listed on Nasdaq or the NYSE can issue shares for cash in public offerings without any requirement for stockholder approval under stock exchange rules. Companies listed on Nasdaq or the NYSE must, however, obtain stockholder approval for any private issuance of securities representing or convertible into 20% or more of their pre-financing outstanding shares or voting power if the purchase price is below the market price. Under exchange rules:
- Rule 144A placements and PIPE financings are not public offerings, and a typical RDO also will not qualify as a public offering for purposes of the stockholder approval rules.
- A CMPO that is broadly marketed to the public may qualify as a public offering. Nasdaq specifies the criteria that must be satisfied in order for a CMPO to qualify as a public offering, but the NYSE has not provided formal guidance on the question.
As a result, the issuance of securities representing or convertible into 20% or more of a listed company's pre-financing outstanding shares or voting power in a Rule 144A placement, PIPE financing or RDO—or in a CMPO that is not marketed sufficiently broadly to qualify as a public offering—at a discount to the current market price will trigger the need for a stockholder vote on the issuance.
Regulation FD. Regulation FD prohibits a public company from intentionally disclosing material nonpublic information to securities market professionals and securityholders unless the company simultaneously publicly discloses the information. In general, Regulation FD applies as follows to a public company's financing transactions:
- Regulation FD does not apply to written and oral statements in connection with registered follow-on public offerings, including primary shelf offerings, RDOs, CMPOs and ATM offerings (it does apply to resale shelf offerings).
- Regulation FD does apply to written and oral statements made in connection with a Rule 144A placement or PIPE financing.
When Regulation FD applies, the company should announce the proposed financing before it is disclosed to potential investors, unless the financing is immaterial to the company or offerees sign a confidentiality agreement. In addition, the company must avoid disclosing material non-public information during investor meetings or in written offering materials, unless the recipients agree to keep the information confidential or the company publicly discloses such information prior to or simultaneously with disclosure to prospective investors. In transactions in which Regulation FD does not apply, the company should consider whether it is sound investor relations practice to disclose to investors material information that it does not disclose to investors generally.
FINRA Clearance. FINRA rules prohibit underwriters and broker-dealers from participating in a public offering unless FINRA determines that the underwriting compensation and other terms are "fair and reasonable." In an IPO, this determination often requires several months to reach. FINRA rules exempt from filing certain types of offerings, most notably shelf offerings registered on Form S-3 based on the eligibility standards for Form S-3 that were in effect prior to October 21, 1992—these Form S-3 standards are significantly more stringent than the current Form S-3 standards. FINRA also offers expedited clearance of WKSI offerings and a same-day clearance process for shelf offerings with an accelerated effective, pricing or launch date.
The content of this article is intended to provide a general guide to the subject matter. Specialist advice should be sought about your specific circumstances.
