
INTRODUCTION
In a pending appeal to the Federal Circuit, Appellant New Vision Gaming & Development, Inc. ("New Vision") argues that the Patent Trial and Appeal Board's (PTAB's) structure and process for deciding whether to institute America Invents Act (AIA) trials violate the Due Process Clause of the US Constitution. Among other arguments, New Vision alleges that because the PTAB is entitled to additional fees when petitions are instituted, the PTAB is incentivized to institute AIA trial proceedings to collect those fees. New Vision further argues that the incentive compensation structure of the PTAB leadership and the Administrative Patent Judges ("APJs") favors the institution of trials to increase the PTAB's caseload, hence creating a bias towards institution.
In support of New Vision, US Inventor, Inc. ("USI") filed an amicus brief (the "USI study") in which it claims to have found statistically significant evidence of the bias alleged by New Vision. Specifically, USI claims to have identified an "October Effect" whereby APJs are supposedly more likely to institute less meritorious petitions in October than in September—the first and last months of the USPTO's fiscal year, respectively, which purportedly align with the performance evaluation cycle of the APJs. USI suggests that APJs are "stuff[ing] the pipeline" in the beginning of each fiscal year to "guarantee ... future work". Specifically, it claims to find with "statistical clarity" a significantly higher percentage of "questionable institution" decisions made in October versus September as support for its thesis.
OVERVIEW
The USI study suffers from a definitional error, plus questionable methodological decisions and application of statistical techniques to an extraordinarily small data set. In addition, the study's focus on only two out of twelve months ignores normal random variation in the single statistic that USI purports to measure, causing the study to mistake random noise for signal. Finally, the USI study fails to consider other measures that strongly contradict its thesis of an "October Effect".
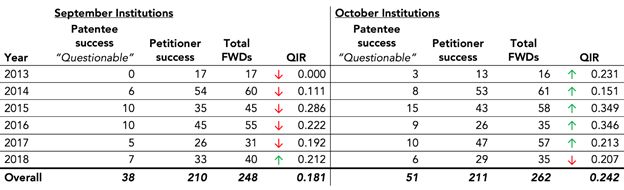
Figure 1 reproduces the data from the USI study.1
Figure 1. USI's "Questionable Institution Rate" Data
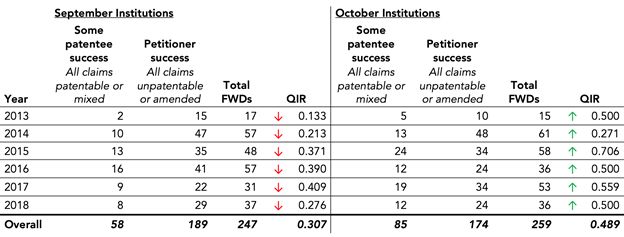
USI calculates QIR as the number of PTAB trials resulting in at least one challenged claim deemed patentable in a final written decision (FWD) divided by the number of trials resulting in all claims deemed unpatentable or amended. A down arrow indicates that a month has the lower QIR within its September-October pair, while an up arrow shows that a month has the higher QIR of the two. RPX calculated the total FWD and overall numbers based on USI's data.
The USI study focuses on the so-called "Questionable Institution Ratio" (QIR), which USI calculates as the number of PTAB trials resulting in at least one challenged claim deemed patentable in a final written decision (FWD) divided by the number of trials resulting in all claims deemed unpatentable or amended.
Using this definition and data from Lex Machina, USI concludes that the QIR is higher in each October as compared to the immediately preceding September as shown in Figure 1. USI further claims the difference in the QIR for the September-October pairs is statistically significant at a 97% confidence level. While USI's data and methodology indeed produces six consecutive years where the measured QIR is higher in October than September, this conclusion is exceedingly fragile. Indeed, USI draws its conclusion from only six pairs of data—the September-October pairs for the years 2013 through 2018—which should lead a reader to approach the results with caution.
In Section 1, we approximate the results from the USI study using data collected and published by RPX.2 The RPX data diverge somewhat from the data used by the USI study, but the differences are small—all the monthly data vary by only a single-digit percentage and the total number of data points differs by only four cases (506 vs. 510). Nonetheless, the fragility of USI's conclusion is evident, as this small shift results in September 2017 having a higher QIR than October 2017.
In Section 2, we explain why USI's definition of a QIR is problematic and adjust it to align—as much as possible—with the statutory threshold for institution set by the AIA. Specifically, institution decisions that result in a mixed FWD are reclassified from "questionable" to not "questionable". With this adjustment, September 2018 has a higher QIR than October 2018, further demonstrating the fragility of the USI study. In addition, we discuss USI's non-intuitive choice of denominator for its QIR.
In Section 3, we further explore the strength of USI's claim of statistical significance.
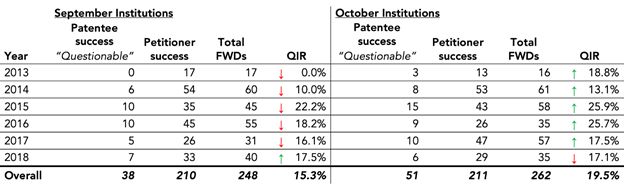
Figure 2, below, shows the results from Sections 1 through 3. The recalculated QIR remains higher in October than September in five out of the six years, but the differences are small and USI's claim of significance crumbles.
Figure 2. "Questionable Institution Rate" Using RPX Data and Adjusted Definition and Methodology
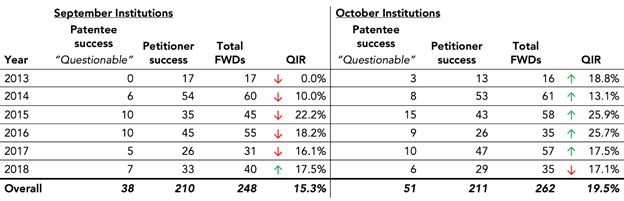
The adjusted methodology calculates QIR as the number of PTAB trials resulting in all challenged claims surviving in an FWD divided by the number of all institution decisions that reached an FWD. A down arrow indicates that a month has the lower QIR within its September-October pair, while an up arrow shows that a month has the higher QIR of the two.
Over the six-year study period, the purported bias effect is—based on RPX's data and adjusted methodology—the result of a mere 13 additional cases in the October cohort (51 versus 38) in which all patent claims survived out of 510 FWDs.3 Even using USI's odd definition of partial cancellations as "questionable" institutions, there are only 27 additional "questionable" cases in the October cohort. During these six years, the PTAB made trial institution decisions on 6,873 unique petitions. If this blip in the number of additional cases is evidence of a concerted effort to stuff the PTAB's docket, that effort would seem exceedingly unambitious.
This article takes no position as to whether structural bias does or does not exist within the PTAB's collective decisions on trial institution. Rather, our analysis here focuses on the substantive foundation of USI's arguments. As explained below, for a conclusion to be supported with "statistical clarity", the underlying study must be based on sensibly defined test parameters and designed within the broader context of what is being tested. Otherwise, one can mistake random variation for signal—as has occurred here.
Section 1 — Data
The US Inventor study is based on data that it obtained from Lex Machina for each September and October from 2013 through 2018. The study does not include any data for the other ten months of the calendar year.
To study the "October Effect" that USI claims to have identified, it is critical to characterize the random monthly variation across all months. A conclusion that October differs significantly from September can only be supported if that difference is meaningfully different from the variation observed among any pair of sequential months. Since USI did not publish data for the other months of the year, we use data collected and published by RPX to replicate its results and expand the analysis to include the additional context for the full calendar year.
There are some differences in the data provided by USI and the data published by RPX. Without access to the full, detailed dataset used by USI, we cannot identify the source of the differences, but we note that there is ambiguity about exactly when the PTAB makes an institution decision. An institution decision may have three associated dates: (1) a date given by the PTAB data feed, i.e., what is shown on the PTAB's website; (2) a date on the face of the institution decision document; and (3) the publication date. These dates often but do not always agree. When they disagree, RPX uses the earliest date for our analysis.4
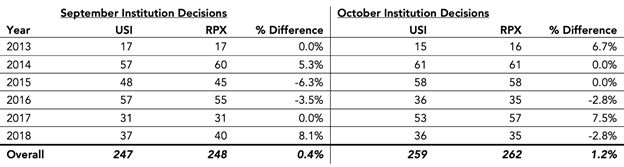
Figure 3 compares the number of institution decisions in each September and October as presented by USI and RPX.5 There are four months for which the count of institution decisions match. For the remaining eight months, the largest absolute difference in any one month was four and the largest relative difference was ±8.1%. The overall count differs by only four institution decision (506 vs. 510).6
Figure 3. PTAB Institution Decisions from USI and RPX Data
In Figure 4, we recalculate USI's QIR using USI's methodology but using RPX data.
Figure 4. USI's QIR Calculation Using RPX Data
QIR is calculated as the number of PTAB trials resulting in at least one challenged claim deemed patentable in an FWD divided by the number of trials resulting in all claims deemed unpatentable or amended. A down arrow indicates that a month has the lower QIR within its September-October pair, while an up arrow shows that a month has the higher QIR of the two.
As shown in Figure 5, the overall results are generally consistent with those from USI's data.7
Figure 5. Overall QIR, 2013-18 Using USI Methodology

USI QIRs from Table 1. RPX QIRs from Table 4.
Notably, the purported "October Effect" disappears in 2017 when we replicate the USI study using RPX data.8
Having established that the RPX data are broadly consistent with USI's data, the following sections provide adjustments to the USI analysis and additional context for evaluating the evidence for the institutional bias USI purports to detect. From this point onward, we will be using RPX data for those analyses.
Section 2 — Definitional and Methodological Issues
Perhaps the most puzzling aspect of the USI analysis is its treatment of PTAB trials that result in some—but not all—challenged claims being deemed unpatentable in an FWD.
In its study, USI measures the QIR as:
![]()
In its study, USI takes the unexplained position that if less than all challenged claims are deemed unpatentable in a FWD, then the trial institution decision was "questionable".
This measure is misleading for two reasons. First, the post-grant review process—like many administrative processes—is by design a two-step process with different burdens of proof.9 That a petitioner may prevail at institution (the first step) but not at FWD (the second step) does not per se make the institution decision questionable.10 If all AIA trials resulted in the cancellation of all instituted claims, the second step of the process would be redundant.
Second, and more critically, "Questionable Institution" erringly counts mixed outcomes—i.e., FWDs resulting in some but not all instituted claims being cancelled—as increasing the QIR. It is entirely unclear why a FWD cancelling at least one claim but not all should add to the "questionable institution ratio". The standard for institution is that there is "a reasonable likelihood that the petitioner would prevail with respect to at least 1 of the claims challenged in the petition" (emphasis added).11 As such, it is simply counter-factual to characterize an institution as "questionable" where at least one claim was found unpatentable.
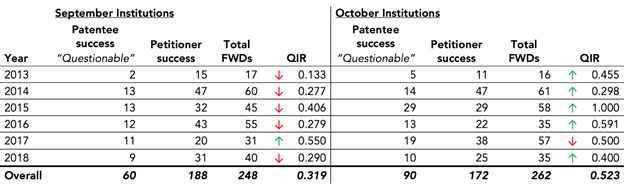
Adjusting the QIR definition to address this second error—i.e., redefining a QIR as the number of PTAB trials resulting in all challenged claims deemed patentable in a FWD divided by the number of trials resulting in at least one challenged claim deemed unpatentable or all claims amended12—once again changes the direction of one of the September-October pairs. This time, as shown in Figure 6, the shift occurs in 2018.
Note that this adjustment to the QIR definition addresses the second issue but not the first, i.e., that the term "questionable" in and of itself is inappropriate in this context. However, for the sake of consistency we continue to refer to this adjusted measure as QIR.
Figure 6. USI's QIR After Adjusting Definition using RPX Data
QIR is calculated as the number of PTAB trials resulting in all challenged claims deemed patentable in a FWD divided by the number of trials resulting in at least one challenged claim deemed unpatentable or all claims amended. A down arrow indicates that a month has the lower QIR within its September-October pair, while an up arrow shows that a month has the higher QIR of the two.
Finally, and more subtly, USI's choice of denominator for its QIR is odd. One would naturally assume the denominator for this calculation would be the total number of institution decisions. Instead, USI divides the "questionable" institution decisions by the number of decisions that yielded all claims deemed unpatentable or amended. As a matter of math, that choice results in a smaller denominator, a larger QIR, and as a further side effect, a magnification of the differences in the QIR for each of the pair of months.13
As a last step, in Figure 7 (which is identical to Figure 2 in the Introduction) we recalculate the QIR—using RPX data—as:
![]()
Figure 7. "Questionable Institution Rate" Using RPX Data and Adjusted Definition and Methodology
QIR is calculated as the number of PTAB trials resulting in all challenged claim surviving in a FWD divided by the number of all institution decisions that reached a FWD. A down arrow indicates that a month has the lower QIR within its September-October pair, while an up arrow shows that a month has the higher QIR of the two.
Under these assumptions, the difference between institution decisions made in October vs. September is reduced to an incremental 13 decisions in which all claims survived over the six-year study period, or approximately two per year. Even without a statistical test of significance, it is extraordinarily hard to find evidence of the institutional bias posited by USI.
It is also worth noting that approximately 33% of all instituted PTAB trials settle or are otherwise terminated before an FWD is reached. Hence, the number of cases terminated post-institution is meaningfully higher than those that were "questionably" instituted as described in Figure 7. Unless one assumes that settled cases would have the same distribution of outcomes as cases that actually reach an FWD, the selection bias introduced by settled cases could massively overwhelm any apparent variation in monthly QIRs.14
Section 3 – Statistical Significance and Other Contextual Data
Setting aside the questionable methodological and definitional decisions discussed above, the USI study provides no data from the other ten months of the year, hence it denies the reader critically important context to assess the significance of any observed difference in September and October decision-making.
If, for argument's sake, one assumes there is seasonal bias in the PTAB's institution decisions, one would reasonably expect that bias to stand out compared to normal variation. Additionally, if the PTAB "stuff[s] the pipeline" in October, one should reasonably expect to see that in related statistics.
For example,
- Is the variation in QIR from September vs. October significantly greater than the variation in other pairs of consecutive months?
- Is the number of trials instituted in October abnormally high compared to other months of the year?
- Is the trial institution rate higher in October compared to other months of the year?
- Is the average time from filing to institution decision faster for trials instituted in October?
Figure 8 shows the QIR calculation for each calendar month using:
- USI's definition of "questionable" and its methodology for calculating QIR—"USI's QIR (as ratio)";
- USI's definition of "questionable" institution, but using RPX's QIR calculation—"USI's QIR (as %)"; and
- RPX's adjusted definition of "questionable" institution and RPX's QIR calculation—"Adjusted QIR".15
It is worth noting that the first two data series express the same outcomes, but with a different denominator. It is clear that USI's approach magnifies both the value of the test statistic itself and the variances from month to month.
As is evident, the difference in average QIR from September to October—for all three data series—is within the normal variation across all months. Indeed, the "October Effect" that is the subject of the USI study is not even the largest sequential monthly change. Moreover, under both the USI and adjusted definition and methodology, October lands near the overall average for all months. A more robust study by USI would have tested whether the sequential change from September to October was significantly greater than the changes observed in other months. It clearly is not.
Figure 8. QIR Using USI's Definition and Methodology as Well as the Adjusted Definition and Methodology—Both Using RPX Data
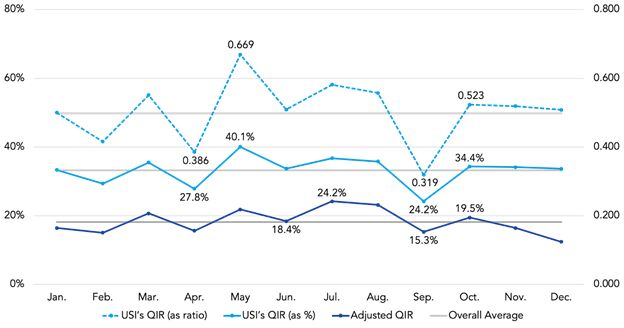
Figure 9 plots the number of institutions granted in each calendar month from 2013 through 2018.16 If there is a bias toward instituting more "questionable" trials in October, one might reasonably expect to see a higher-than-average number of trials instituted in that month.17 As is evident from the chart, there is nothing remarkable about the number of trials instituted during the month of October. And, in fact slightly fewer trials were instituted in October than in September over this six-year period.
Figure 9. Total Institutions Granted by Month (2013-2018)
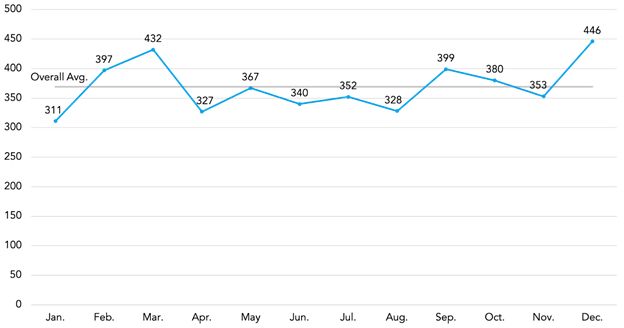
Figure 10 plots by month and year the percentage of institution decisions that granted trial. If indeed there is an "October Effect", one might reasonably assume that the institution rate would be systematically higher in October than in other months of the year. Actually, the overall institution rate is modestly lower in October than in September, and there is little evidence of any seasonality in the institution rate.
Figure 10. Trial Institution Rate by Month (2013-2018)
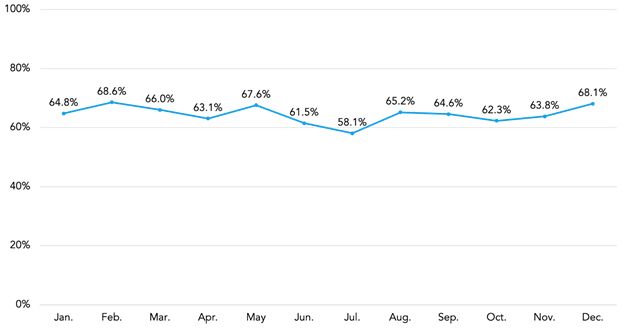
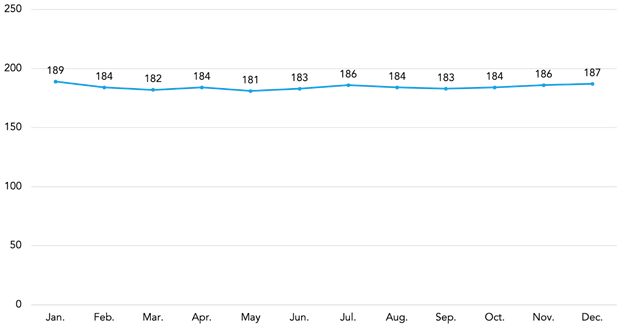
Figure 11 shows statistics about institution pendency—the time from the filing of a petition to the institution decision—based on the month in which the institution decision was made. If there is indeed an "October Effect" one might expect the pendency for those decisions made in October to be shorter as petitions are "pulled forward" to stuff the pipeline of instituted trials. Instead, the data suggest that decision pendency is consistent throughout the calendar year.
Figure 11. Average Institution Decision Pendency in Days (2013-2018)
CONCLUSION
This article takes no position as to whether structural bias does or does not exist within the PTAB's collective decisions on trial institution. However, studies purporting to support any conclusion with "statistical clarity" must define their test measures rigorously and consider the broader context to avoid mistaking random variation for signal.
Between 2013 and 2018, the PTAB received 9,533 petitions, instituted 4,432 trials, and issued 2,424 FWDs. In contrast to USI's surprising conclusion about the existence of an "October Effect", RPX's analysis of the institution decisions made by the PTAB from 2013 through 2018 demonstrates a remarkable consistency in the PTAB's institution decisions as measured by outcomes when FWDs are reached, trial institution rates, and institution decision pendency.
USI raises an interesting question about seasonality in PTAB behavior, but we find no evidence to support its conclusion. If PTAB decision-making showed evidence of seasonality, practitioners in front of the Board should be keenly aware of that phenomenon. Even petitioners who are defendants in co-pending litigation enjoy some discretion about when to file a petition and can form a reasonable expectation about when that petition will be considered for institution. However, nothing in the USI study should be taken to suggest that practitioners need to consider seasonality when deciding when to file petitions.
Perhaps the most important implication of these analyses is that, at a macro view, the PTAB decision-making process can be modeled with a reasonable degree of certainty about timing and possibly outcomes. By definition, every patent dispute is constructively unique, but rational disputants should consider whether to settle or litigate based—at least in part—on the available historical data. However one may feel about the specific outcome in any particular proceeding, the consistency of the PTAB's decision-making process assists patent owners, defendant-petitioners, litigation funders, and other interested parties to make informed decisions about the likely timing, cost, and possibly the probability of success in general.
APPENDIX
QIR Formulas
USI's QIR (expressed as a decimal ratio):
![]()
Adjusted QIR (expressed as a decimal ratio):
![]()
Adjusted QIR (expressed as a percentage of overall FWDs):
![]()
Statistical Approach
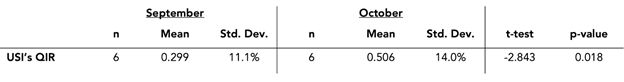
USI performed a statistical test on September and October's questionable institution rate to arrive at a p-value below 0.03. We were able to approximate this result (p-value=0.018) by comparing the averages of USI's September and October QIRs using a two-sample t-test, as shown below.
Welch Two-Sample T-Test: USI's "Questionable Institution Rate" Data
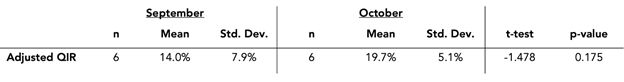
Applying the same test after making our definitional and methodological changes, the p-value increases to 0.175, suggesting that USI's conclusion is no longer significant at the generally accepted 95% confidence level.
Welch Two-Sample T-Test: Adjusted QIR Using RPX Data
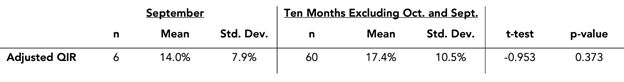
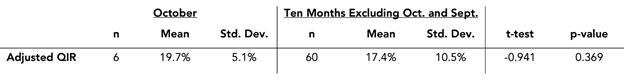
We repeated these tests for each of September and October, comparing them to the averages of the other ten months of the calendar year. This resulted in p-values of 0.373 and 0.369 for September and October respectively, strongly suggesting that neither month's QIR is significantly different from any other month of the year.
Welch Two-Sample T-Test: Adjusted QIR Using RPX Data for September and the Ten Months Excluding September and October
Welch Two Sample T-Test: Adjusted QIR Using RPX Data for October and the Ten Months Excluding September and October
Footnotes
1. The USI study provides different overall percentages that differ because USI made the choice of averaging the averages rather than averaging the total numbers. Averaging averages can overweight individual datapoints and generally should be avoided.
2. The RPX data are available (registration required) on RPX Insight at https://insight.rpxcorp.com/analytics/ptab?tab=claims&analytics_type=analytics.
3. The denominator between September and October does change, so technically, the difference in QIR between September and October is the result of only 12 additional cases in October across the last six years.
4. This date ambiguity likely accounts for most of the discrepancies between the USI and RPX data. It also highlights the fragility of an analysis based on differences in sequential monthly outcomes when the critical date for bucketing the data itself may be ambiguous. Moreover, the USI study fails to consider the likelihood that the institution decision itself may be made weeks ahead of any published institution decision. One presumes that the decision to institute precedes the final drafting and publication of the institution document itself.
5. USI does not explicitly state which PTAB trial types it included. The RPX data used include inter partes reviews (IPRs), covered business method (CBM) reviews, and post-grant reviews (PGRs), as this selection most closely matched USI's numbers.
6. The similarity of the institution totals does not necessarily imply that the USI dataset and the RPX dataset include the same trials for each month of the study. Trials that are instituted near the beginning or end of September or October may fall into one month or the other (or out of the study altogether) based on differential coding of the institution date.
7. Because Figure 4 is calculated using USI's methodology, the most likely source of this discrepancy is differences in the coding of the trial institution decision date, although it is possible that USI is using different outcome data from RPX as well.
8. Astute readers will note that in Figure 2, where we present the results using RPX data and RPX's methodology, the "October Effect" reappears in 2017. This is because flipping the outcome of a single trial in either September or October of 2017 is sufficient to create or cancel the "October Effect." This is yet another example of the fragility of USI's conclusions. If the addition (or subtraction) of a single trial from one month's data reverses the study's conclusion, it is hard to reconcile that with a hypothesis that the study is modeling institutional bias at the PTAB rather than random variation.
9. At institution, 35 U.S.C. § 314(a) requires the Director to find a "reasonable likelihood that the petitioner would prevail with respect to at least 1 of the [challenged] claims", while during trial, § 316 requires the petitioner to prove "unpatentability by a preponderance of the evidence".
10. See Trivascular v. Samuels ("[T]he Board is not bound by any findings made in its Institution Decision. At that point, the Board is considering the matter preliminarily without the benefit of a full record. The Board is free to change its view of the merits after further development of the record, and should do so if convinced its initial inclinations were wrong").
11. 35 U.S.C. § 314(a).
12. Where one or more claims were the subject of adverse judgment, only the claims that reached FWD were considered. It would have been reasonable to count institutions with an adverse judgment as not "questionable", which would have led to even lower QIRs. However, we choose to keep USI's approach for consistency.
13. Consider a simple example in which September had four "questionable" institutions out of ten trials and October had five "questionable" institutions, also out of ten trials. Intuitively, one would calculate the first ratio as 4 ÷ 10 or 40% and the second as 5 ÷ 10 or 50%. Hence, one would say the latter figure is "ten percentage points" or "25% higher" than the former.
Under USI's construction, the QIRs would be calculated as 4 ÷ 6 = 0.67 and as 5 ÷ 5 = 1.00. In each case, the ratio is higher than the intuitive calculation. And the difference between the two statistics has been magnified as well. Under USI's approach, the latter number now appears to be 50% higher than the former.
14. The USI study is silent on the potential bias introduced by cases that settle after a trial is instituted. Settled cases raise two important issues. First, if cases that settle are disproportionately cases that would have otherwise reached a petitioner-friendly FWD, the QIRs calculated by the study will be generally and substantially overstated. According to at least one commentator, ". . . settlements . . . are virtually certain to be unfavorable to patent owners (especially post-institution, when the petitioner has much more leverage)." "Capitulation Settlements in IPR are No Win for Patent Owners", IPWatchdog (June 15, 2017), available at https://www.ipwatchdog.com/2017/06/15/capitulation-settlements-ipr-no-win-patent-owners/.
Second, a change in the mix ("questionable" vs. not "questionable") of instituted but settled cases could overwhelm the small monthly differences estimated by the USI study. Perhaps the study's authors assumed that the settled cases would hypothetically reach the same ratio of outcomes as cases that reach an FWD. But there is a large body of literature on the selection of cases for litigations that belies that hypothesis. See, e.g., George L. Priest and Benjamin Klein, The Selection of Disputes for Litigation, 15 The Journal of Legal Studies 1, 55 (1984).
15. We are unable to perform this analysis using USI data as they provide the data only for the months of September and October.
16. 471 joined cases from 2013-2018 are not shown and have been excluded in previous views.
17. This chart is based on all institution decisions. As such, the data for September and October do not match the data elsewhere in this article, which only count institution decisions that eventually resulted in an FWD.
The content of this article is intended to provide a general guide to the subject matter. Specialist advice should be sought about your specific circumstances.

