

US MARKET REVIEW AND OUTLOOK
Market Review
Despite lingering economic uncertainty for much of the year, in 2012 the venture capital market produced the second-strongest deal flow since the end of the dot-com boom in 2001, although financing proceeds declined from 2011 levels. Liquidity performance in 2012 was also mixed, as the number of VC-backed IPOs increased from the 2011 total, while the number of acquisitions of VC-backed companies and their acquisition prices declined from the prior year's levels.
The number of reported venture capital financings dipped 4%, from 3,506 in 2011 to 3,363 in 2012, although this gap is likely to close after all deal activity has been reported. The quarterly totals of 838, 940, 852 and 733 transactions in 2012 probably reflect delayed reporting of some second-half transactions, but may also signal increasing investor concern about the impending fiscal cliff.
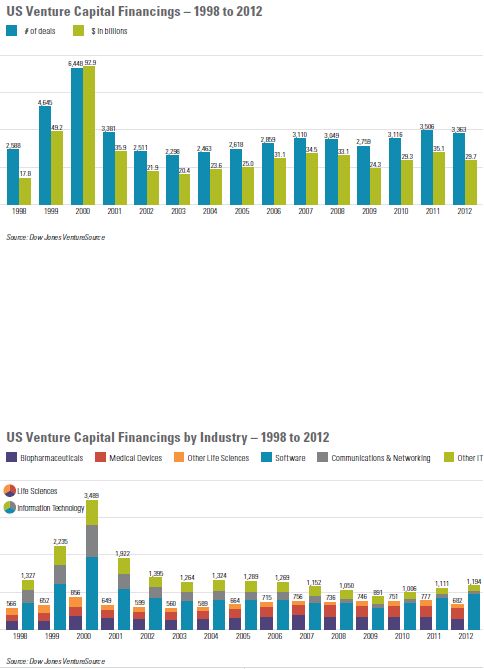
Year-over-year, total venture capital financing proceeds contracted more sharply than the number of financings. Proceeds declined 15%, from $35.1 billion in 2011 to $29.7 billion in 2012, although the amount raised was still 7% above the $27.8 billion in average gross proceeds for the preceding 10 years, and the year's tally is likely to increase further after all 2012 financings have been reported.
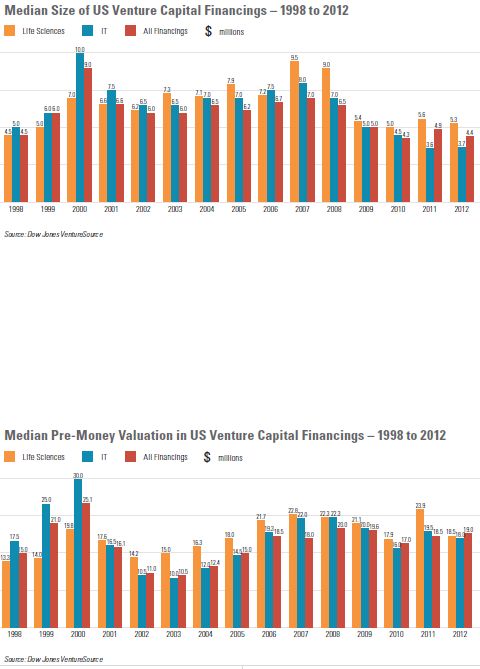
The median size of all venture capital financings decreased from $4.9 million in 2011 to $4.4 million in 2012—the second-lowest level since the start of the dot-com boom in 1997. The median financing size for life sciences companies decreased from $5.6 million in 2011 to $5.3 million in 2012, but remained in line with the sector's average since 2009. For information technology companies, the median financing size edged up from $3.6 million to $3.7 million. The decline in the median financing size for information technology companies in recent years reflects the ability of many technology companies to commence and scale their operations with lower levels of funding than historically required, due to technological advances.
Consistent with the decline in total proceeds and median financing size in 2012, the number of very large financings also declined. The number of financing rounds of at least $50 million decreased from 93 in 2011 to 79 in 2012, and the number of financing rounds of at least $100 million decreased from 34 to 19, although both metrics exceeded the average for the preceding five years.
With strong competition for attractive deals, valuations of venture-backed companies increased for the second year in a row in 2012. Among all venture financings, the median pre-money valuation increased from $18.5 million in 2011 to $19.0 million in 2012. The median pre-money valuation, however, fell for both life sciences and information technology companies. Among life sciences companies, the median pre-money valuation declined 23%, from the $23.9 million peak in 2011 to $18.5 million in 2012. Information technology companies saw a more modest 8% decline, from $19.5 million in 2011 to $18.0 million in 2012.
Seed and first-round venture capital financings accounted for 46% of all venture financings in 2012, compared to 44% in 2011, representing the highest level since the 47% figure in 2000. In contrast to the ten-year period from 2001 to 2010, when seed and first-round financings accounted for an annual average of only 35% of all financings, the figures for 2011 and 2012 rival the average of 45% that prevailed from 1996 to 2000.
Proceeds from seed and first-round deals represented 20% of all venture capital financing proceeds in 2012, up from 18% in 2011. While this percentage increased in 2012, it is below the 21% average for the period from 2001 to 2010, and is well short of the 32% average for the 1996 to 2000 period, reflecting the proliferation of companies receiving smaller financing amounts and surviving on much lower burn rates than historical norms.
Information technology companies represented 36% of all venture capital financings in 2012, compared to 32% in 2011. Market share for life sciences companies declined for the third consecutive year, from 22% in 2011 to 20% in 2012. Reversing a three-year trend, the aggregate amount invested in information technology companies ($9.9 billion) exceeded the amount invested in life sciences companies ($7.1 billion) in 2012.
California—which has led the country in financings in each year since 1996 (the first year for which this data is available)—accounted for 40% of all venture financings in 2012 (1,341 financings). New York, home to companies with 310 financings in 2012, finished second in this category for the first time, passing Massachusetts, which had 291 financings. Texas (127 financings) and Pennsylvania (121 financings) rounded out the top five positions for 2012.
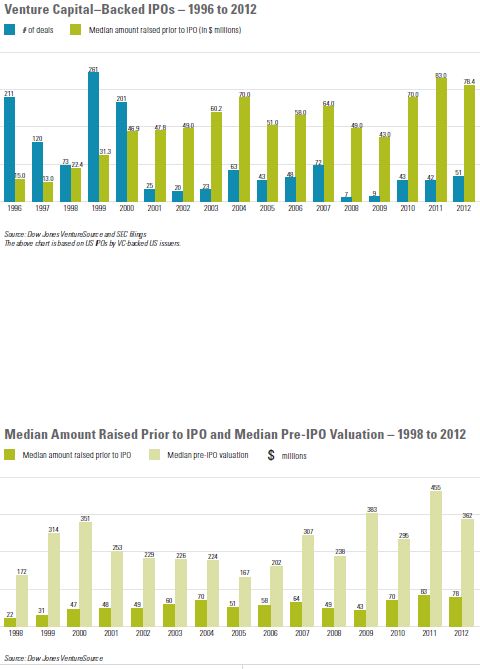
The IPO market remained receptive to VC-backed companies in 2012, continuing the recovery that began in 2010 after VC-backed IPOs all but disappeared for most of 2008 and 2009. A total of 51 US venture-backed companies went public in the United States in 2012, up from 42 IPOs in the prior year. The largest VC-backed IPO of 2012 was the $16.0 billion offering by Facebook. The median amount of time from initial funding to an IPO increased from 6.4 years in 2011 to 7.4 years in 2012.
The ratio of pre-IPO valuations to the median amount raised prior to IPO by venture-backed companies going public decreased from 5.5:1 in 2011 to 4.6:1 in 2012 (a higher ratio means higher returns to pre-IPO investors). This ratio was between 3.2:1 and 5.3:1 for each year from 2001 to 2008. In contrast, this ratio ranged from 7.7:1 to 10.0:1 from 1997 to 2000, due to very large pre-IPO valuations by younger companies, and spiked temporarily to 8.9:1 in 2009 based on a very small sample size of VC-backed IPOs that year.
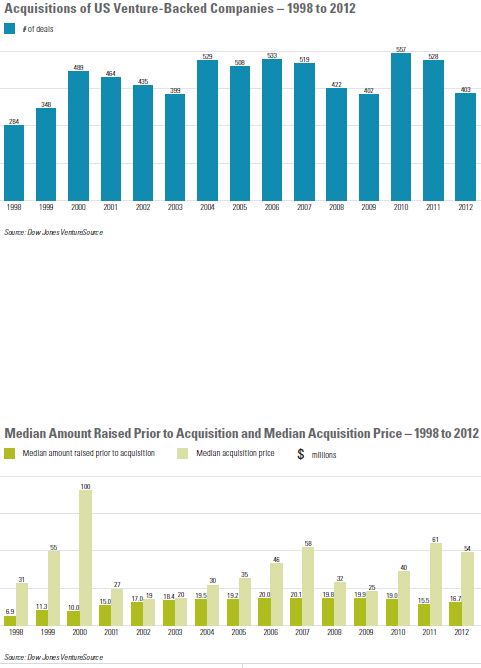
Unlike the growth in the market for VC-backed IPOs, the M&A market for venture-backed companies contracted in 2012. The number of reported acquisitions of VC-backed companies declined by almost a quarter, from 528 to 403. While total proceeds fell 23%, from $48.4 billion in 2011 to $37.4 billion in 2012, the median acquisition price for venture-backed companies fell only 11%, from $61 million to $54 million—still the third-highest figure since 2000. The median amount of time from initial funding to acquisition inched down from 5.2 years in 2011 to 5.1 years in 2012—continuing a five-year trend of annual declines since the median peaked at 6.5 years in 2007. Despite the slightly shorter timeline to liquidity, the median amount raised prior to acquisition increased 8%, from $15.5 million in 2011 to $16.7 million in 2012.
The largest VC-backed company acquisitions of 2012 were the acquisitions of Meraki by Cisco and Yammer by Microsoft—both $1.2 billion deals. There were a total of eight VC-backed company acquisitions for at least $500 million in 2012, down from 14 in 2011 but equal to the tally in 2010.
The ratio of median acquisition price to median amount raised prior to acquisition decreased from 3.9:1 in 2011 to 3.2:1 in 2012 (a higher ratio means higher returns to pre-acquisition investors). The decline reflects a combination of higher investment levels prior to acquisition and lower sale valuations. Apart from 2011, this ratio in 2012 was the highest since 2000's ratio of 10.0:1 at the apex of the dot-com delirium.
The above comparison of the ratios of valuations to the financing amounts required to achieve liquidity events indicates that returns to venture capital investors remain higher on IPOs than on M&A transactions. The higher valuations attained by IPO companies are offset, in part, by the fact that the median amount raised prior to liquidity for IPO companies ($78.4 million in 2012) is generally much higher than the amount for M&A companies ($16.7 million in 2012), and by the longer timelines from initial funding to liquidity for IPO companies (7.4 years in 2012) than for M&A companies (5.1 years in 2012). Moreover, venture investors generally achieve liquidity more rapidly in an M&A transaction (which frequently yields the bulk of the purchase price in cash at closing) than in an IPO (which generally involves a post-IPO lockup period of 180 days and market uncertainty on the timing and prices of subsequent sales).
The ratio of M&A transactions to IPOs for venture-backed companies was 7.9:1 in 2012, compared to 12.6:1 in 2011 and 13.0:1 in 2010. This ratio had spiked to 51.5:1 between 2008 and 2009, compared to the figure of 11.5:1 that prevailed during the period 2001–2007 and the remarkable ratio of 2.1:1 seen during the Internet boom of 1998–2000.
Outlook
The overall health of the venture capital market over the coming year will be significantly affected by general economic conditions, investor confidence and the strength of the IPO market for VC-backed companies, among other factors.
- Financing Activity: We expect the level of venture capital financing activity to moderately increase in 2013, although a lag between improvements in market fundamentals and investor confidence is likely to mean a delay in gains until later in the year. Early results for 2013 bear out this prognosis. Capital market conditions were robust in the first quarter, with the Nasdaq increasing by 8% and the Dow surging by 11%, yet venture capital deal flow declined from the prior year's levels. In the first quarter of 2013, 752 venture capital financings raised $6.36 billion, compared to 848 financings with proceeds of $7.21 billion in the first quarter of 2012, although the number of financings and proceeds for the first quarter of 2013 should approach the prior year's figures once all financings have been reported. The largest venture financings in the first quarter were by Pinterest ($200 million), SevOne ($150 million) and LivingSocial ($110 million, bringing its total financing to $1.1 billion).
- VC-Backed IPOs: On the heels of a very good IPO market for venture-backed companies in the preceding three years, expectations for a strong market in 2013 abound, particularly for the second half of the year. The VC-backed IPO market may also get a boost from the JOBS Act, enacted in April 2012, although the extent to which the act prompts eligible companies to go public remains to be seen, and some provisions of the act actually make it easier for a company to stay private for a longer period of time—a path deliberately chosen by some VC-backed companies. The first quarter of 2013 saw nine venture-backed IPOs, compared to 21 in the first quarter of 2012. The largest venture-backed IPO in the quarter was the $105.0 million offering by Marin Software, followed by Model N ($104.5 million) and Xoom ($101.2 million).
- Acquisitions: Prospects for the M&A market for venture-backed companies also appear promising, despite the decline in acquisition activity and prices last year. Strategic acquirers have excess cash to deploy, and the existence of a credible IPO alternative enhances the leverage of venture-backed companies in negotiating acquisition prices. According to Dow Jones VentureSource, the number of acquisitions of VC-backed companies declined to 94 in the first quarter of 2013 from 105 in the first quarter of 2012. Total M&A proceeds fell 47%, from $9.24 billion to $4.88 billion—the lowest quarterly proceeds since the third quarter of 2009—although the prior year's results were inflated by several large acquisitions.
- Attractive Sectors: The massive adoption of smartphones and mobile applications and the ever-increasing level of broadband connectivity means the number and variety of lucrative opportunities for technology companies has never been higher. Life sciences companies with compelling market opportunities (especially those whose founders have successful track records) should also continue to attract funding. As a result of disappointing returns in recent years, investment in the clean technology and renewable energy sector is likely to decline.
- Looming "Series A Funding Cliff "?: The growth in the number of startup accelerators, incubators and angels, and the resulting high level of seed and early-stage financing in recent years has spurred talk of a "Series A funding cliff," which could see many startups having trouble competing for the venture capital rounds they need to grow. While this talk is probably overblown—because some early-stage companies will become viable without additional venture capital funding, many will be acquired (either in traditional transactions or in "acquihire transactions" in which the buyer's principal motivation is to capture the target's employee pool), and others will fail—the recent surge in early-stage financing may limit the availability of expansion rounds for some companies.
REGIONAL MARKET REVIEW AND OUTLOOK
California
California companies reported 1,341 financings in 2012, down slightly from 1,361 financings in 2011. Despite the dip, the year's deal tally was the second largest since the peak of the dot-com boom in 2000, when California produced a staggering 2,553 financings. Gross proceeds in 2012 declined 7% to $15.2 billion—still the fourth-highest total since 2000.
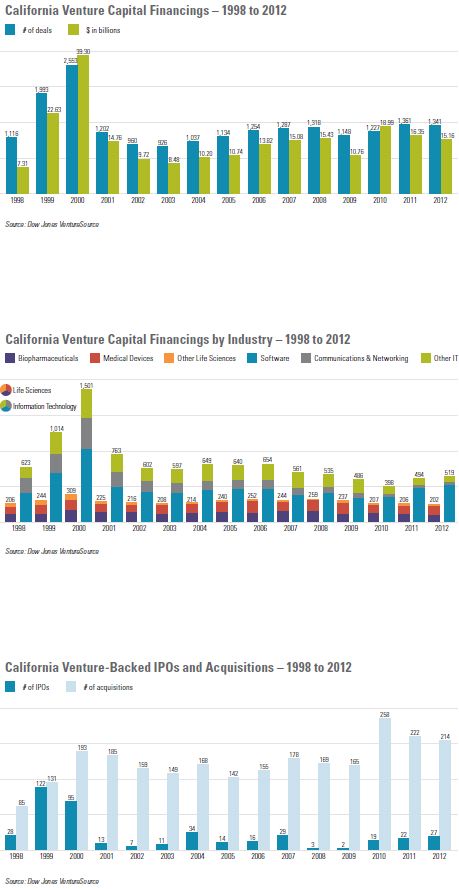
Roughly four times the size of the next-largest venture capital market in the United States, California was responsible for 40% of the nation's financing transactions in 2012. Accounting for 39% of all California financings in 2012, information technology was the largest sector in the state, followed by consumer services (19%) and life sciences (15%).
The state generated 27 IPOs by VC-backed companies in 2012, compared to 22 in 2011. California was home to the five largest VC-backed IPOs of 2012, led by Facebook ($16.0 billion), Workday ($637.0 million) and Palo Alto Networks ($260.4 million).
The number of reported acquisitions of California VC-backed companies slipped from 222 in 2011 to 214 in 2012. California produced the country's four largest venture-backed company acquisitions of 2012: two $1.2 billion acquisitions—Meraki by Cisco and Yammer by Microsoft—followed by the $1.05 billion acquisition of Nicira by VMware and Instagram's $1.0 billion acquisition by Facebook.
While combined IPO and M&A exits in 2012 lagged behind the preceding two years, liquidity events for California VC-backed companies remained well above those of any other year, with the exception of 1999 (when IPOs peaked at 122) and 2000 (when acquisitions peaked at 193).
We expect California to maintain its venture capital leadership in the coming year. Future growth in financing activity and continued strength in liquidity will depend, in part, on venture capital fund raising, the willingness of strategic buyers to pay attractive premiums, and the overall health of the capital markets. First-quarter 2013 liquidity highlights include five VC-backed IPOs and Verinata Health's $350 million acquisition by Illumina.
Mid-Atlantic
The number of reported venture capital financings in the mid-Atlantic region of Virginia, Maryland, North Carolina, Delaware and the District of Columbia decreased 9%, from 169 in 2011 to 153 in 2012—the lowest number of financings in the region since 1997, other than in 2009. Gross proceeds plummeted from $2.03 billion in 2011—a figure buoyed by two huge financing rounds for LivingSocial—to $825 million in 2012.
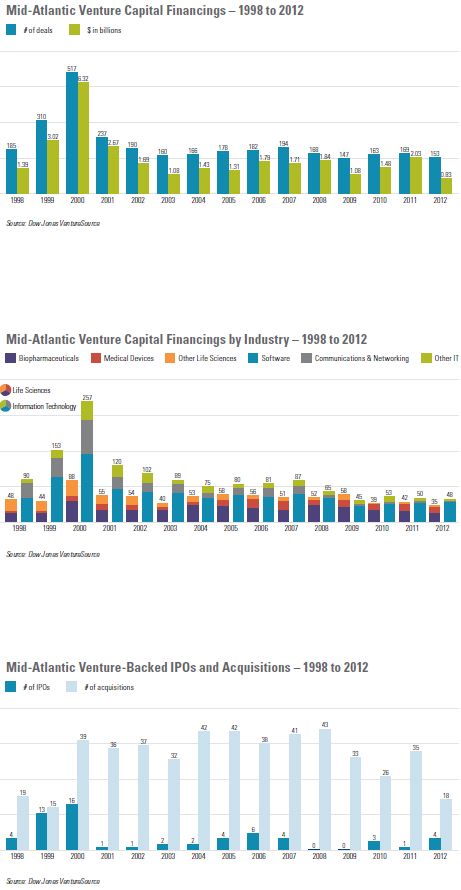
Information technology companies accounted for 31% of all financings completed in the mid-Atlantic region in 2012, with life sciences companies taking a 23% share.
Rebounding from one solitary IPO in 2011, the mid-Atlantic region produced four VC-backed IPOs in 2012: Millennial Media ($132.6 million—the country's eighth-largest VC-backed IPO of the year), Eloqua ($92.0 million), Cempra ($50.4 million) and Supernus Pharmaceuticals ($50.0 million).
In contrast to the uptick in the region's IPO activity, the number of reported acquisitions of mid-Atlantic VC-backed companies fell by almost half, from 35 in 2011 to 18 in 2012. Virginia continued to lead the region in VC-backed M&A transactions, with nine deals, followed by Maryland with four and North Carolina with three. The region's largest M&A transaction of the year was the $169 million acquisition of iContact by Vocus, followed in size by iEnergizer's $150 million acquisition of Aptara.
The combined number of IPO and M&A exits for mid-Atlantic VC-backed companies in 2012 was equal to only half the average level in the region for the period from 2004 to 2008, and represented the lowest annual total since 1997.
We expect a moderate increase in activity for the mid-Atlantic region in the coming year, led by life sciences and defense-related technology companies, although companies in both sectors face a challenging financing environment. Year-to-date highlights include IPOs by a pair of biotech companies— Chimerix and LipoScience.
New England
New England companies reported 374 venture capital financings in 2012, down 6% from 397 financings in 2011. Despite the decline, the 2012 figure remains above the region's annual average of the preceding 10 years. Gross proceeds declined from $3.83 billion in 2011 to $3.21 billion in 2012.
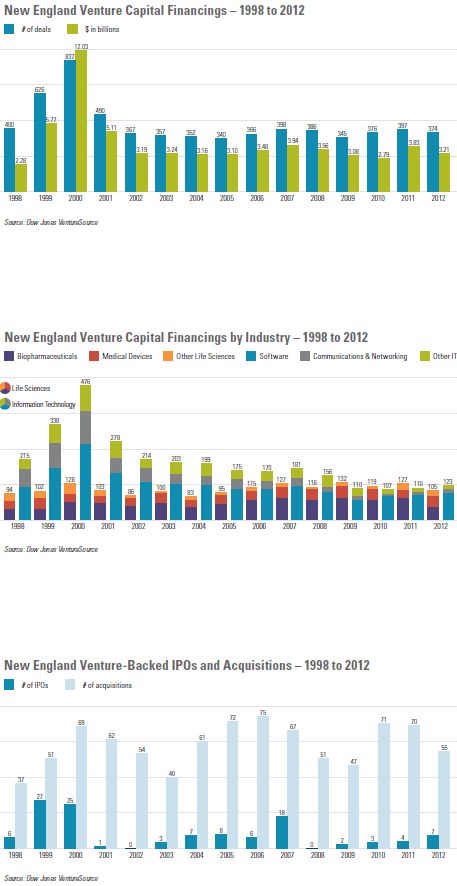
Reversing a three-year trend, the number of financings by information technology companies in 2012 topped the number of financings by life sciences companies. Information technology companies accounted for 33% of New England's venture capital financings (up from 31%) and life sciences represented 28% of the region's financings (down from 32%).
New England generated seven venture-backed IPOs in 2012—six from Massachusetts and one from Connecticut—compared to four in 2011. The largest New England VC-backed IPOs were by Merrimack Pharmaceuticals ($101.1 million), KAYAK Software ($94.0 million) and Demandware ($88.0 million).
The number of reported acquisitions of VC-backed companies in New England declined 21%, from 70 in 2011 to 55 in 2012. The region's largest M&A transaction of the year was the $775 million acquisition of Kiva Systems by Amazon.com, followed by Celgene's acquisition of Avila Therapeutics ($350 million up front, plus up to $575 million in milestone payments), the $206 million acquisition of NEXX Systems by Tokyo Electron, and the acquisition of Boston Biomedical by Dainippon Sumitomo Pharma for up to $2.63 billion ($200 million up front, plus up to $2.43 billion in milestone payments).
With its concentration of world-renowned universities and research institutions, we expect New England—and Massachusetts in particular—to remain one of the country's most appealing environments for emerging companies and a hub of venture capital and IPO activity during 2013. The year has already seen two biotech IPOs in the region— Enanta Pharmaceuticals and Tetraphase Pharmaceuticals—and a number of acquisitions in the life sciences sector.
Tri-State
The number of reported venture capital financings in the tri-state region of New York, New Jersey and Pennsylvania edged down from 481 in 2011 to 476 in 2012. New York led the region with 310 financings—eclipsing Massachusetts for the first time. Annual financing tallies in New York have increased from an average of 120 between 2000 and 2006, to 200 between 2007 to 2009, and to just over 300 since 2010. Although the overall number of deals in the region remained steady, gross proceeds fell 20%, from $3.80 billion in 2011 to $3.04 billion in 2012—a reflection of the large number of smaller consumer Internet deals.
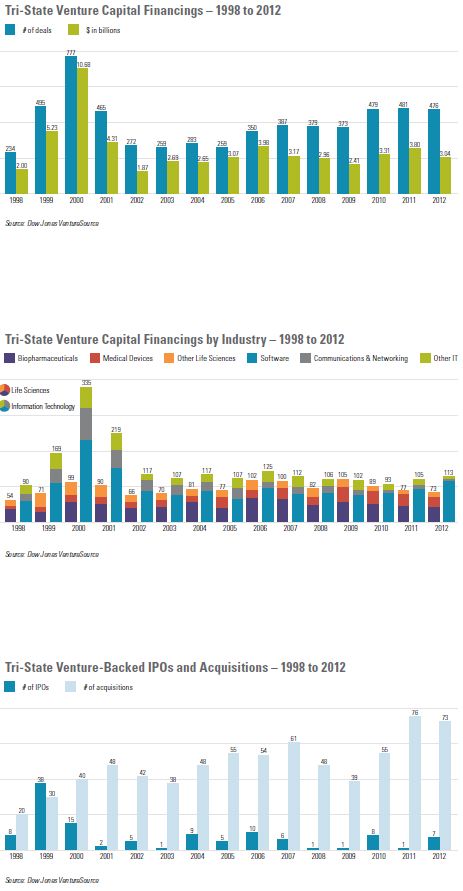
Consumer services companies accounted for the largest share of the tri-state region's VC financings in 2012, with 29% of all financings, followed by information technology companies with 24%. Life sciences financings have declined in the three years since they led the region, and represented only 15% of financings in 2012.
The tri-state region generated seven VC-backed IPOs in 2012, compared to a single IPO in 2011. New York led the region, with four IPOs, followed by Pennsylvania with two and New Jersey with one. The region's largest VC-backed IPO was by Globus Medical ($100.0 million), followed by Shutterstock ($76.5 million) and Intercept Pharmaceuticals ($75.0 million).
Reported acquisitions of venture-backed companies in the tri-state region decreased 4%, from 76 in 2011 to 73 in 2012. The region's largest deal of 2012 was the $689 million acquisition of Buddy Media by Salesforce.com, followed by Ascend Health's $517 million acquisition by Universal Health Services and the $425 million acquisition of Argus Information & Advisory Services by Verisk Analytics.
We anticipate increased venture capital activity in the tri-state region over the coming year, particularly in the consumer Internet space. Year-to-date exits by VC-backed companies include IPOs by biotech companies Omthera Pharmaceuticals and Stemline Therapeutics, and the $160 million acquisition of Valcera by Perrigo.
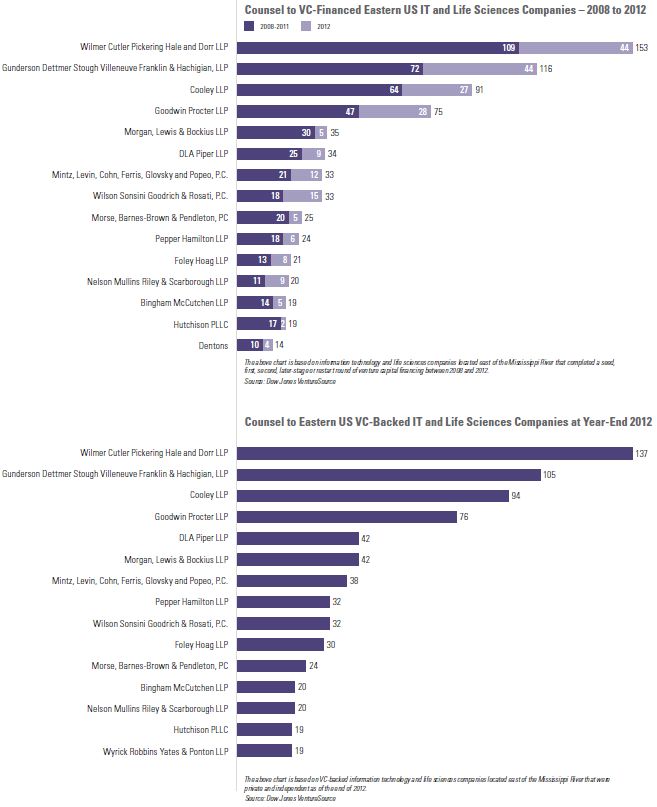
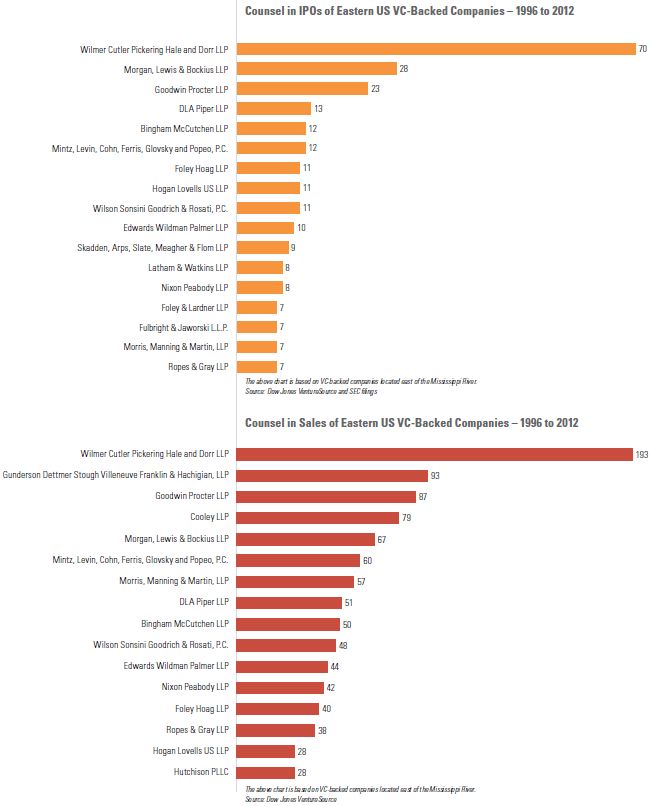
LAW FIRM RANKINGS – EASTERN US
EUROPEAN MARKET REVIEW AND OUTLOOK
Review
Weighed down by continuing concerns over economic conditions and the sovereign debt crisis, European venture capital financing activity declined in 2012. Liquidity outcomes were mixed, with the number of IPOs increasing slightly while acquisitions declined.
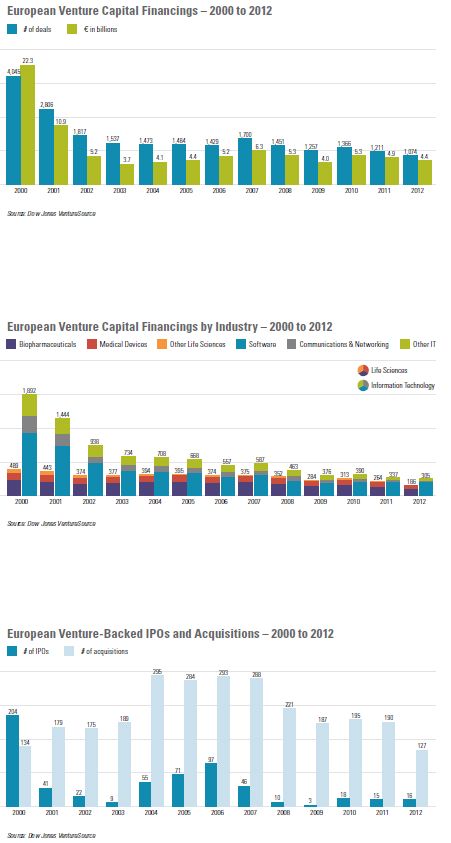
The number of reported venture capital financings in Europe fell 11%, from 1,211 in 2011 to 1,074 in 2012—comparable to the decline from 2010 to 2011. Venture capital proceeds decreased 9%, from €4.9 billion in 2011 to €4.4 billion in 2012. Once all 2012 transactions have been reported, this gap should narrow, but is unlikely to be fully bridged.
In 2012, the software sector again accounted for the largest portion of the European venture capital market, representing 21% of all financings and 28% of gross proceeds, followed by consumer information services companies (17% of financings and 18% of proceeds) and biopharmaceuticals (11% of financings and 17% of proceeds).
Once again, the United Kingdom was the largest venture capital market in Europe in 2012, generating 27% of the year's financings and 31% of gross proceeds, followed by France (19% of financings and 16% of proceeds) and Germany (18% of financings and 19% of proceeds).
The number of IPOs by European venture-backed companies increased from 15 in 2011 to 16 in 2012, but average company proceeds decreased from €47 million to €24 million. Acquisitions of European VC-backed companies fell by a third, from 190 in 2011 to 127 in 2012, with total proceeds declining from €7.7 billion to €4.3 billion.
Outlook
Exciting new venture-backed companies should continue to emerge in Europe. Negative economic growth is forecast for 2013, however, and austerity measures are wearing thin on voters, leading to political uncertainty in some countries. Taken together, these factors suggest that challenging conditions in the European venture capital market are likely to persist for at least the next year.
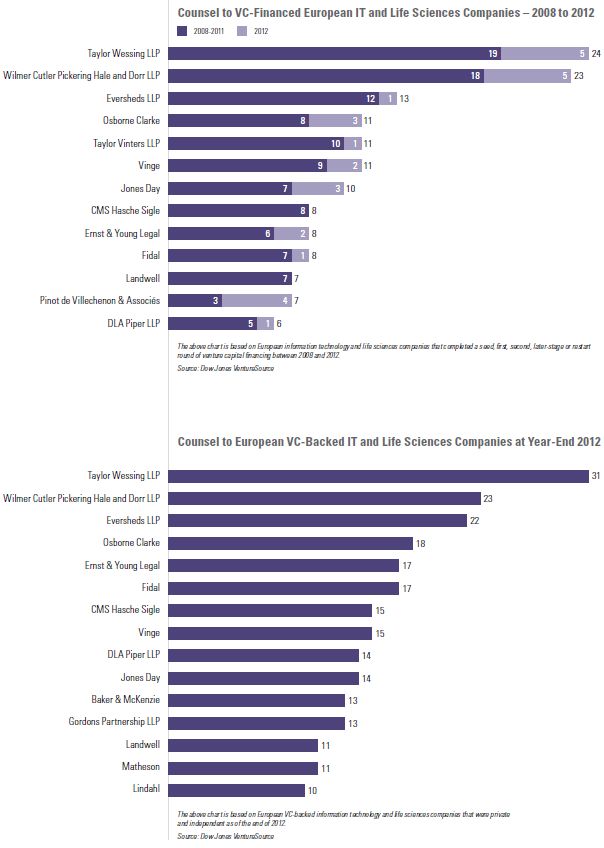
LAW FIRM RANKINGS – EUROPE
INVESTING IN QUALIFIED SMALL BUSINESS STOCK IN 2013
The American Taxpayer Relief Act of 2012, signed into law by President Obama on January 2, 2013, extended—and made retroactive to January 1, 2012—the ability of non-corporate investors to exclude from federal taxable income 100% of the eligible gain realized from the sale of "qualified small business stock" (QSB Stock) held for more than five years. As a result, the 100% exclusion under Section 1202 of the Internal Revenue Code is available to any QSB Stock acquired between September 27, 2010 and December 31, 2013.
Now and Then: Exclusion Rates Under Section 1202
Prior to 2009, Section 1202 provided an exclusion from federal taxable income for 50% of any gain realized from the sale of QSB Stock. The exclusion, however, was limited in several ways:
- the amount of gain eligible for the exclusion was limited to the greater of (1) $10,000,000, reduced by the amount of gain attributable to the issuer's stock already excluded by the investor in prior tax years, and (2) ten times the aggregate adjusted basis of all of the issuer's QSB Stock disposed of by the investor during the current tax year;
- long-term gain from the sale of QSB Stock ineligible for the exclusion was subject to taxation at a maximum rate of 28% (and not the lower capital gains rates in effect for most other types of assets); and
- a portion of the gain excluded under Section 1202 was required to be included in income for alternative minimum tax (AMT) purposes.
Although the cap on the gain eligible for the exclusion remains in effect, legislation passed in the last four years provides for exclusion rates of 50%, 75% or 100%, depending on the date of acquisition of the QSB Stock. In addition, for QSB Stock acquired on or between September 28, 2010, and December 31, 2013, no portion of the excluded gain is includable in income for AMT purposes.
The most recent legislative amendments to Section 1202, providing for the 100% exclusion rate, expire at the end of this year, at which point the pre-2009 rules will once again apply. In addition, gain that is ineligible for exclusion—i.e., a portion of the gain realized from the sale of QSB Stock acquired before September 28, 2010, or after December 31, 2013— is, as of January 1, 2013, subject to the new Net Investment Income Tax.
What is QSB Stock?
Generally, stock will be treated as QSB Stock only if all of the following requirements are satisfied:
- The QSB Requirement: As of the date of issuance, the issuer was a domestic C corporation and neither it nor any predecessor corporation had aggregate gross assets—generally, cash and the aggregate adjusted tax basis of any other property—in excess of $50 million at any time prior to or immediately after the issuance.
- The Active Business
Requirement: During substantially
all of the investor's holding period, the issuer must have used
at least 80% (by value) of its assets in the active conduct of one
or more "qualified trades or businesses." For this
purpose:
- A "qualified trade or business" is any trade or business except those explicitly excluded by the statute. For example, any business where the issuer's principal asset is the reputation or skill of its employees is excluded.
- The issuer cannot be a special tax-advantaged entity (such as a domestic international sales corporation, regulated investment company or real estate investment trust).
- For corporations that have been in existence for less than two years, assets held to meet the reasonable working capital needs of a qualified trade or business, or held for investment and reasonably expected to be used within two years to finance research and experimentation or increase working capital, are treated as used in the active conduct of a qualified trade or business. For corporations that have been in existence for two years or more, only 50% of those assets will qualify to be counted as used in the active conduct of a trade or business.
- Generally, a corporation does not meet the active trade or business test for any period during which (1) more than 10% of the total value of its assets consists of real property not used in the active conduct of a trade or business, or (2) more than 10% of the value of its assets (in excess of liabilities) consists of stock or securities in other corporations.
- The Original Issuance Requirement: Stock is required to have been acquired by the investor at its original issuance in exchange for cash or property (other than stock), or as compensation for services. Subject to limited exceptions, stock acquired by an investor will generally not be treated as QSB Stock if either (1) at any time during the four-year period beginning two years before the issuance of the stock, the issuer redeems any of its stock from the investor or a related person, or (2) at any time during the two-year period beginning one year before the issuance of the stock, the issuer redeems stock with an aggregate value exceeding 5% of the aggregate value of all of its stock as of the beginning of the two-year period.
Rolling Over QSB Stock Gain
Section 1045 of the Internal Revenue Code allows non-corporate investors to defer gain from the sale of QSB Stock held for more than six months if other QSB Stock is purchased within 60 days of the date of sale. Provided Section 1045's requirements are met, gain on the sale of the original QSB Stock is recognized only to the extent that the amount realized exceeds the replacement stock's purchase price; unrecognized gain reduces the investor's basis in the replacement stock. In addition, the holding period of the original QSB Stock is tacked to the holding period of the replacement stock.
The recent legislative changes to Section 1202 offer particularly significant tax benefits to investors who choose—by the end of 2013—to invest in QSB Stock or roll over gain from QSB Stock previously held. Due to the complexity of the provision, however, investors and issuers should consult with their tax advisors regarding their specific circumstances prior to seeking the benefits of Section 1202.
JOBS ACT PROVIDES IMPORTANT BENEFITS FOR STARTUPS N INVESTING IN QUALIFIED SMALL BUSINESS STOCK IN 2013 OT ON THE IPO ON-RAMP
The JOBS Act is probably bestknown for creating an "IPO on-ramp" intended to reduce the cost and complexity of going public, but the act also contains important benefits for startups that are years away from an IPO, or never plan to go public. By loosening decades-old restrictions on private fundraising, permitting a new financing technique known as "crowdfunding," and increasing the maximum number of stockholders a private company may have, the act should make it easier for startups to obtain financing and remain private if they so choose. Startups will have to wait a bit longer to enjoy most of these benefits, however, as the SEC has yet to fully implement the changes.
Elimination of Ban on General Solicitation
Current SEC rules prohibit general solicitation and general advertising to attract investors in private placements. The JOBS Act requires the SEC to amend its rules to permit such activities in placements conducted pursuant to Rule 506 (the SEC rule that allows companies complying with its requirements to raise unlimited amounts of capital) as long as all purchasers qualify as "accredited" investors. (Accredited investors are high-income and high-net-worth individuals and qualifying institutions.) A company must take reasonable steps to verify that purchasers are accredited investors, using methods to be determined by the SEC.
In August 2012, the SEC proposed rule amendments to implement the above requirements. As of March 31, 2013, these amendments have not become effective.
New Crowdfunding Exemption
The JOBS Act requires the SEC to adopt rules to permit private US companies, without registration, to engage in "crowdfunding" transactions, subject to the following restrictions:
- Within any 12-month period, the maximum offering size is $1 million.
- The amount any individual investor may invest must not exceed (1) the greater of $2,000 or 5% of the annual income or net worth of the investor, if either the annual income or net worth of the investor is less than $100,000, and (2) 10% of the annual income or net worth of the investor, not to exceed a maximum aggregate investment of $100,000 by the investor, if either the annual income or net worth of the investor is equal to or more than $100,000.
- An intermediary, either a broker or "funding portal," must be used in the transaction. The intermediary must register with the SEC and any applicable self-regulatory organization; ensure that investors understand the risks of the investment and can bear the burden of possibly losing the investment; conduct a background check on each officer, director and 20% stockholder of the company; make sure that no investment limits are exceeded; and comply with any other requirements the SEC may prescribe.
- Companies have to file with the SEC and provide to investors and potential investors an anticipated business plan, the financial condition of the company, a description of the intended use of the proceeds, and a description of the ownership and capital structure of the company.
- Investors can bring rescission claims (claims for refunds) for material misstatements and omissions. Claims may be brought against the company, the company's directors and certain officers, and any person who offers or sells the security in the offering.
- Companies need to disclose a target offering amount and the deadline to reach the target offering amount. Companies must provide regular updates regarding their progress in meeting the target offering amount.
- Companies may not advertise the offering, except for notices that direct investors to the intermediary. Companies may not compensate anyone for promoting the offering through the intermediary's communication channel without taking proper steps to ensure that the promoter discloses that compensation in each promotional communication.
- Companies must file financial statements and ongoing reports with the SEC, subject to rules, exceptions, termination dates and other requirements to be determined by the SEC.
- Investors may not resell securities for one year, beginning on the date of purchase, except to the company; to an accredited investor, as part of an SEC-registered offering; to family members; or in connection with death or divorce.
- Crowdfunding is available only to US companies (and not foreign companies) that are not already an SEC reporting company.
Crowdfunding will not become available until the SEC issues rules to implement it. As of March 31, 2013, the SEC has not proposed any crowdfunding rules.
Higher Stockholder Threshold for Mandatory SEC Reporting
The JOBS Act increases the stockholder threshold at which a private company must register its securities and become an SEC reporting company. The former limit was 500 holders of any class of equity security; the new limit is 2,000 persons, or 500 persons who are not accredited investors.
For purposes of the new threshold, securities held by persons who received the securities pursuant to an employee compensation plan—such as a stock option plan—in transactions exempt from SEC registration are excluded. Securities issued in crowdfunding transactions will also be excluded, once the SEC adopts crowdfunding rules. The increase in the registration threshold and the exclusion from such calculations of securities issued in employee compensation and crowdfunding transactions should allow some large private companies to remain private longer, and may enable companies to avoid creating new classes of equity security as a workaround to the old 500-person limit. The change may also encourage some companies to grant equity more broadly within the company, or to stop including restrictions on grants that were intended to keep the company below the former 500-person limit.
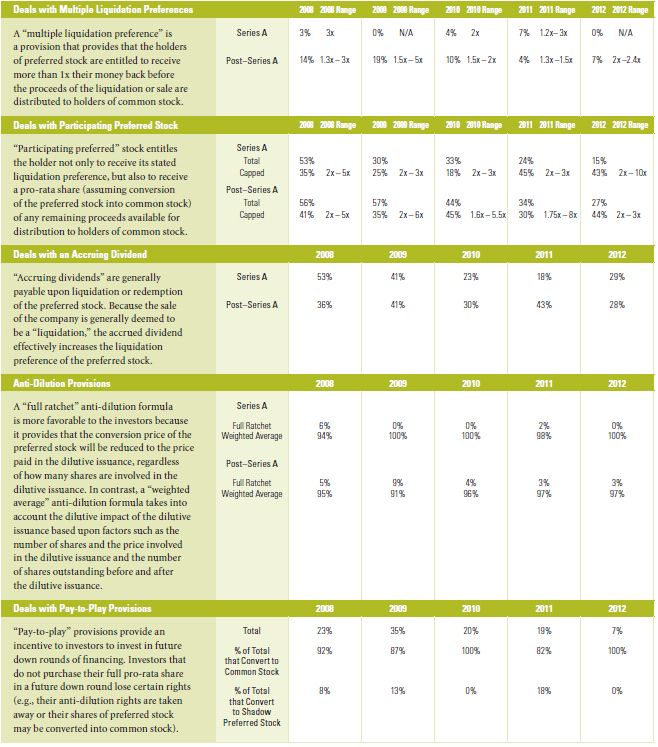
TRENDS IN VENTURE CAPITAL FINANCING TERMS
Based on hundreds of venture capital financing transactions we handled from 2008 to 2012 for companies and venture capitalists in the United States and Europe, we have compiled the following deal data:
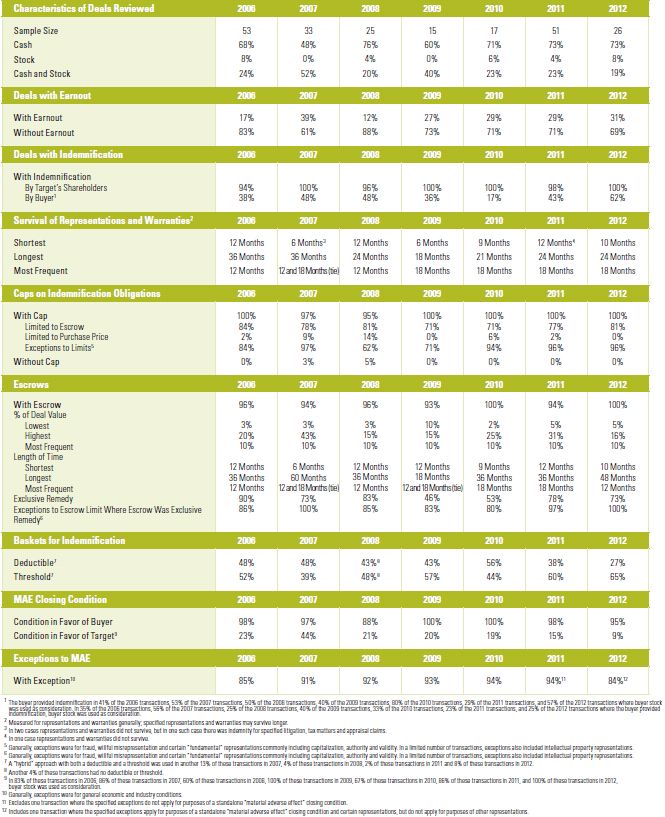
TRENDS IN VC-BACKED COMPANY M&A DEAL TERMS
We reviewed all merger transactions between 2006 and 2012 involving venture-backed targets (as reported in Dow Jones VentureSource) in which the merger documentation was publicly available and the deal value was $25 million or more. Based on this review, we have compiled the following deal data:
Please click here to view the original article (PDF).
The content of this article is intended to provide a general guide to the subject matter. Specialist advice should be sought about your specific circumstances.