

Analysis of the Occupational Safety and Health Administration's (OSHA) publicly available inspection and citation data, which dates back to the 1970s, can help employers forecast and spot enforcement trends and changes, identify new and emerging issues, and correlate information to make unique connections that may not be readily apparent. To assist employers, Ogletree Deakins has developed the OSHA Tracker, a purpose-built resource designed to provide clients and consumers with easy-to-use search tools and filters to convert OSHA data into more digestible and useful information. Features of the OSHA Tracker include the following:
- Individual state OSHA data
- OSHA regional data
- Filters for dates and years for searching specific time periods
- Industry filters
- Penalty statistics
- A "search by state" feature optimized to allow users to view data for a specific state, including the state's leading cities by violation, average initial penalty, average current penalty, and percentage of inspections leading to violations
Ogletree Deakins' Practice Intelligence and Analytics team has synthesized OSHA's publicly available information and records and joined forces with the firm's workplace safety and health attorneys to analyze and parse the data to create an interactive and thought-provoking user experience. For example, if users select "Texas" to examine Texas's OSHA data for 2020 and 2021, they will see the top cities in the state ranked by the number of cited OSHA violations, the total number of cited OSHA violations for the two years, the average initial penalty, the average current penalty, and the percentage of inspections that led to the issuance of a citation.
The data for California—a state with a reputation for being aggressive when it comes to enforcement of occupational safety and health standards—reveals only 112 inspections per 100,000 employees during 2020 and 2021. Washington State, by contrast, leads the nation with an average of 1,490 inspections per 100,000 employees in the same timeframe. Oregon was second with 1,186 inspections per 100,000 employees, followed by Michigan with 513 inspections per 100,000 employees. In 2022, California has led the nation in total number of OSHA inspections, but Washington and Texas are close behind.
The publicly available figures reveal that Delaware tops the nation in average current penalty per citation. In California, the leading city by average penalty ($30,134 per citation) is San Quentin, a small town located in Marin County. (This statistical anomaly indicates that citations related to violations of California's COVID-19 Prevention Emergency Temporary Standards at the large state prison located in the community are likely driving the high penalty value for the city of San Quentin.)
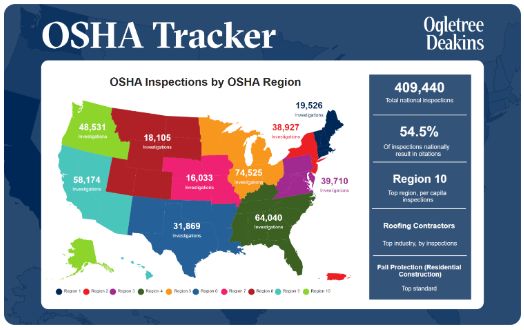
National or multistate employers may choose to view data by OSHA region and compare the data across regions. Other employers may find value in filtering the data to discover the top citations for their industries and using the information for risk management and safety planning.