
Executive summary
Canadian retailers continue to experience challenging times with difficult domestic and global economies, changing consumer behaviour and an increasingly competitive retail landscape. While changing economic conditions will persist to greatly impact retailers, the results of our security survey for 2012 show signs of relative stability, as retailers redefine the role of loss prevention, the activities used to monitor threats and deal with criminal activity. The responses for the survey indicate that Canadian retailers are continuing to protect themselves against internal and external criminal activities and other sources of loss.
Retailers indicated that they employ theft prevention policies and procedures for internal and external theft, vendor or supplier fraud and pirating of intellectual property. Used in conjunction with new technology and proven theft prevention methods, most Canadian retailers have the capability to monitor and control recognized theft risks. While retailers stated that internal and external theft are the most impactful criminal activities to their organization, credit and debit card fraud (including Pin Pad tampering) and return or gift card fraud are also significant security issues.
Although retailers continue to leverage a combination of policies, monitoring procedures and enhanced loss prevention technologies, respondents still reported shrink rates that ranged from a low of 0.4% to a high of 2.19%. The average shrink rate for all respondents was 1.04%, slightly lower than the 1.13% result in the 2008 survey. By our estimates, total shrink dollars for Canadian retailers has increased since our 2008 survey to approximately $4 billion. For total retail in Canada, this equates to an average shrink of $10.8 million per shopping day.
To put these numbers into perspective, total shrink dollars is close to the total investment levels made by all Canadian retailers in Information Technology (IT) and exceeds investments in Finance department functions. However, unlike IT and Finance function investments, shrink provides no benefits to retailers, and requires significant time and resources to identify, manage and prevent. Simply put, shrink has a significant bottom line impact that must be minimized wherever possible. Compared to the 2008 survey results, notwithstanding differences in the respondent base, the average shrink rates for retailers who are in the $1 billion plus range has increased. Although there was a reported increase in shrink rates for retailers in the $1 billion plus range, overall results have remained steady since our last report. Continued investment in people, processes and technology seem to have prevented shrink rates from rising as the retail trade has grown by $44 billion in Canada since fiscal year 2007.
The survey shows that estimated external theft has significantly decreased its portion attributed to total shrinkage, while internal theft estimates have significantly increased. This suggests that while retailers have made positive strides in reducing theft through their investments in loss prevention, the need for strong internal policies and procedures, as well as performing pre-employment screening and background checks before hiring new staff will be important measures to reduce losses and control theft risks.
While retailers today are continuing to take action against both external and internal theft, how action is taken has changed to some degree. Although respondents indicated that they are more often confronting and issuing verbal warnings to employees and customers caught stealing, at the same time they indicated that their appetite to pursue criminal charges has decreased. Likely a result of the difficult economic conditions since 2007, retailers are choosing less costly and severe options in these circumstances.
As criminal activity continues to evolve in more sophisticated and organized ways, companies will need to continue their investments in loss prevention to ensure that benefits achieved are sustained and shrink rates continue to improve.
Survey information
Timing and dates
Survey information was collected in August and September 2012, and is based on the respondents 2011 fiscal year. Responses were anonymously obtained using confidential web-based survey application software and therefore information was provided by respondents on a voluntary basis.
Respondents' profiles
Respondents to the survey included vice presidents, directors and managers within the Loss Prevention or Security functions of some of Canada's leading retail organizations. To the extent it was applicable, owners and other management staff of smaller retail operators also participated in the survey targeted at the smaller market retail segment.
Compilation of information and results
Information was provided by respondents in an anonymous and confidential format. Responses to survey questions were compiled and analyzed by PricewaterhouseCoopers LLP (PwC) with assistance from the Retail Council of Canada (RCC). Certain statistical information provided by respondents was analyzed in comparison to survey questions requiring similar information to ensure consistency of the responses obtained. These analytical procedures permitted the correction of clerical errors noted on the submission of responses by respondents (i.e. decimal places and use of percentage symbol).
Comparability to previous surveys
Where possible, comparisons and analysis were made to the 2012 Canadian Retail Security Survey results using data generated from PwC's last loss prevention survey conducted in 2008. However, due to fluctuations in our respondent base, we acknowledge that there are inherent limitations in our ability to isolate changes in results (2008 to 2012) strictly to trends in the market and the change in the profile of respondents from then until now. In addition, the relative short history of this survey (2007, 2008, 2012), also makes trend analysis difficult since it is commonly accepted that trends are patterns that are proven to exist over multiple years.
Please refer to the "Profile of respondents" section for more information on changes to respondents from 2008 to 2012.
Overall 34 retailers, representing approximately 16% of 2011 retail net sales (excluding new and used automotive sales) as estimated and reported by the Retail Council of Canada, responded to our request for participation. However, the rate of 16% includes some respondents who did not report their net sales in the survey. Assuming the undisclosed net sales reflected the average of the disclosed respondents, our projected participation rate would be approximately 24% of 2011 retail net sales before new and used automotive sales in Canada.
Profile of respondents
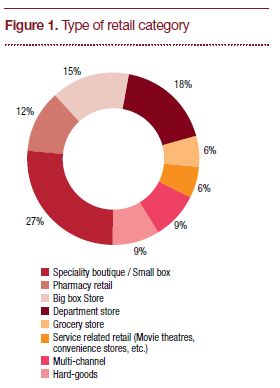
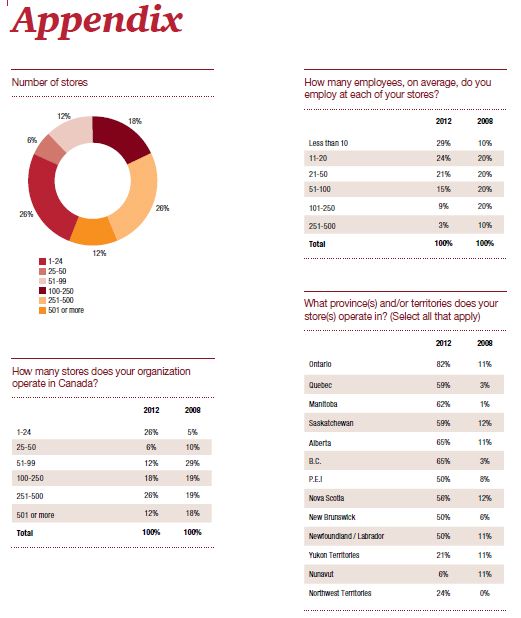
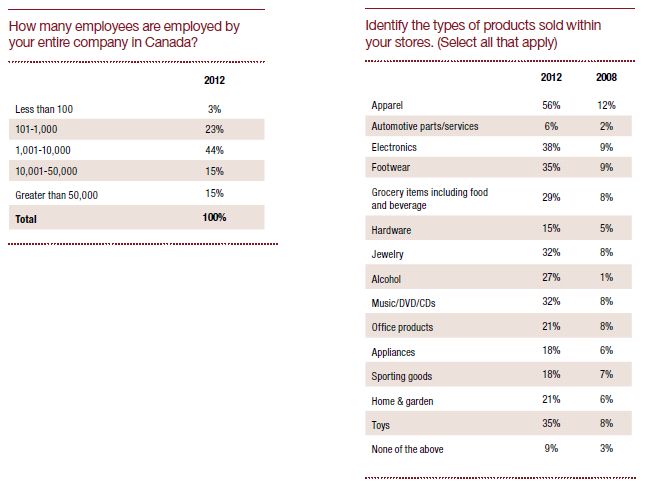
Retailers who responded reported 2011 average net sales of $2.540 billion, with an average of 48 employees employed at each store and 14,407 across Canada, and a median of 20 and 3,587 employees respectively. The retail categories of the respondents are included in Figure 1. It should be noted that 21% of respondents also operate franchise operations in addition to their corporate owned stores. Where applicable, the franchise operations results are included as part of the survey results.
Due to fluctuation in the respondent base, we are limited in the comparisons that can be made between the survey results as compared to 2008. We are confident that the respondents represent the medium to large retail segment based on the overall store counts, overall employment figures and average net sales as compared to current published statistics within the Canadian retail industry.
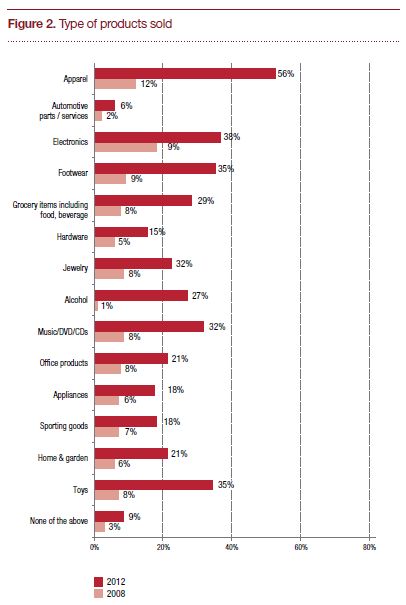
The product offering of the survey participants is broken down in Figure 2.
Loss prevention (LP) function
Respondents indicated that they dedicate resources to the prevention of losses at their locations. Capital and operating budgets exist to invest in loss prevention measures and technology designed to assist in identifying and preventing theft. Thirty-six per cent of respondents identified the senior director/director as the most senior loss prevention positions in their organization; whereas 27% of respondents identified both the senior vice-president/ vice-president and the manager positions as the most senior positions.
The direct line of reporting for the LP function among our respondent group has changed significantly since the 2008 survey. Forty-six per cent of respondents' LP department leaders now report to store operations, representing an 8% increase since 2008. Eighteen per cent act as a stand-alone function, reporting to the Audit committee or the president, which is a decrease of 11% from 2008. Twenty-three per cent of respondents have Finance overseeing loss prevention, compared to 19% in 2008.
The survey identified that when LP reports as a stand-alone function (i.e. report to Audit Committee or president), the estimated per cent portion of external theft is highest. However, when LP reports to store operations, the estimated per cent portion of external theft is lowest. As store operations generally have the most direct impact on behaviour at the store level, we believe this result is reflective of this reality. When store operations are closely aligned with loss prevention it appears the enhanced focus on external theft prevention measures pays off.
Overall, the average number of employees working in the LP department for respondent retailers was 35 - ranging from 1 to a high of 300 people. A median of 5.32% of retailers stated that they have employees solely dedicated to manage organized retail crime activities.
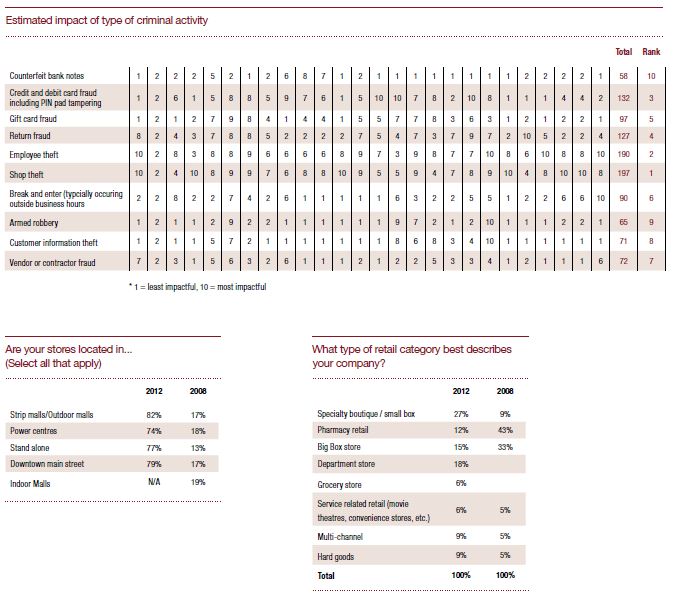
LP departments ranked shop and employee theft as the two categories with the biggest impact to loss prevention. Respondent retailers are also greatly concerned about high risk categories such as credit and debit card fraud (including PIN pad tampering) and return or gift card fraud.
The ability to identify and prevent inventory shrinkage can be measured by the total annual department budget for LP activities as a percentage of sales. Retail chains participating in the survey spent an average of 2% of sales on loss prevention, 1.25% on capital, 1.13% on security and 1% on third-party activities.
Retail theft
Retail shrinkage is the loss of inventory caused by different sources such as theft by employees, customers or organized crime, inventory counting errors, accounting errors, fraud and damaged product loss. Respondents reported the following shrink rates:
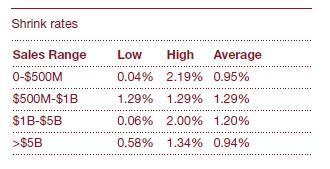
Compared to 2008 results, average shrink results were lower in the 0-$500M range by 0.29%, but higher in the $1B-$5B and $5B ranges by 0.36% and 0.07% respectively. Although retailers in these two ranges saw positive gains in the low range, the high range was significantly higher, contributing to an overall higher shrink rate in those sales ranges. However, due to fluctuation in the respondent base, we cannot definitively state that shrinkage has increased industry wide as compared to 2008.
Using the retailer total sales dollars responses in conjunction with the reported shrink rates, the statistics show that both large and small retailers are dealing with similar shrink issues and as a result are exposed to a comparable level of shrink. Notwithstanding the impact of the merchandise mix, conventional thinking would indicate that the $5B retailers would be exposed to a notably high level of shrink than smaller retail operations.
However, this retail segment has continued, since the 2008 survey, to invest in the suitable mix of procedures, technology and training programs to keep their shrink levels near those of smaller retail concepts. We also noted that 71% of respondents reported shrink rates below 1.5%. The remaining 29% of respondents reported rates between 1.58% and 2.19%. This breakdown is attributed to two elements noted in the responses:
- the majority of respondents reported having fewer than 500 locations - representing a smaller location base to manage and the ability to identify shrink issues more easily than retailers with greater than 500 locations
- continued investment in loss prevention programs by respondents reduces shrink and ensures that shrink remains a controlled expenditure
Respondents indicated that although the average shrink rates in larger sized stores has increased since the 2008 survey, retailers are generally continuing to maintain strong control over shrink levels. However, given the increase in retail trade in Canada since 2008, the reporting shrink rates translate to approximately $4 billion in annual loss to Canadian retailers.
Merchandise categories
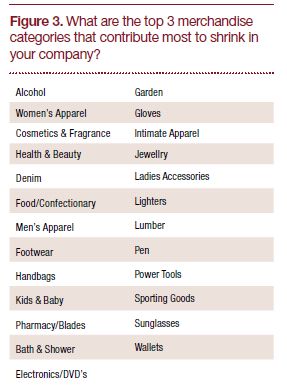
Given the diverse group of respondents, 25 different merchandise categories were identified that contribute most to shrink (see Figure 3). From these responses, the top three identified (in order) were alcohol, ladies apparel and cosmetics & fragrances. As expected, each of these categories are high volume and high value categories that appeal to criminal activity, both internal and external in nature.
Incident breakdown
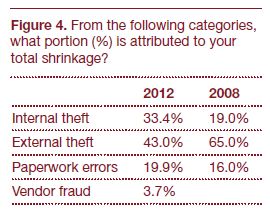
The survey respondents estimated that 43% of theft-related incidents are perpetrated by external parties. This represents a significant decrease since 2008, when the reported percentage was 65%. The breakdown of incidents is shown in Figure 4. Internal theft has increased to 33.4% of all reported incidents from only 19% in 2008, while paperwork errors account for 19.9%, up slightly from 16% in 2008.
The 43% external theft suggests that retailers have made positive strides in reducing theft through their investments in loss prevention. However, the 33.4% of internal theft further emphasizes the need for strong internal policies and procedures as criminal activity gains momentum from within the core of the retail operation. Over the past decade it is well known that many retailers have increased some of their investments and attention from external to internal theft prevention measures. As this shift has occurred the per cent attributed to each has also changed. With insight into retailer's operations and systems, dishonest employees have the ability to do more harm than typical shoplifters. As a result it seems clear that investing in internal theft prevention is wise.
The survey indicated that the average number of external apprehensions and recovered dollar amounts for all respondents per annum at 1,533 and $277,026 respectively. Internal apprehensions and recovered dollar amounts averaged 158 and $166,893 respectively for the respondent group. These numbers align with the reported increase in internal theft and suggest that while retailers are working diligently to decrease theft, greater emphasis will need to be placed on internal loss prevention activities.
Returns
In addition to shrink, retailers are also exposed to fraudulent returns. Survey respondents indicated that their estimated refund-related theft averaged approximately 4.2% of all customer refunds.
Policies and actions taken against theft
The retail industry is the largest employer in Canada. As a direct result, it is also exposed to greater employee theft than any other industry. Similar to our findings in 2008, all respondents to our survey this year indicate having established policies that define the consequences for employees that are caught stealing. The pervasiveness of such policies suggests a continued strength in governance practices and in the general retail and consumer market.
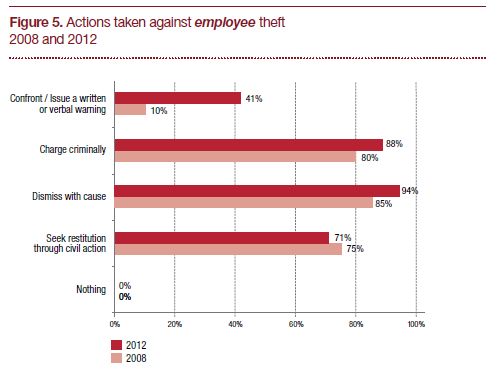
Consistent with the responses in 2008, respondents to the 2012 survey indicated a strong tendency toward prosecution of employees caught stealing (see Figure 5). However, there was a noticeable decline in the tendency toward prosecution of customers (see Figure 6). Approximately 60% of the respondents indicated they report incidents of theft by employees or customers to law enforcement more than half of the time (see Figure 7). Forty-one per cent of respondents stated that they confront or issue a verbal warning to employees when caught stealing, an increase of 31% from the 2008 survey.
Eighty eight per cent of respondents charge the employee criminally and nearly all (94%) dismiss the employee with cause. In the event that a customer is caught stealing, respondents confront the customer 77% of the time (an increase of 27%) and charge the customer criminally 65% of the time (a decrease of 20% from the 2008 survey). Respondents seek restitution through civil action 35% of time, the same result our survey identified in 2008.
Interestingly, compared to the 2008 survey, there was a notable increase in the number of respondents that are choosing to report incidence of theft less frequently. Respondent retailers are leveraging the appropriate policies to inform customers while protecting themselves, demonstrating that action will be taken and that theft will not be tolerated.
Notwithstanding the differences in the respondent base, we consider the likelihood that given the difficult economic conditions since 2007, retailers in some cases choose to avoid legal prosecution, instead choosing to leverage employee termination or barring a customer from their stores as sufficient action taken.

Inventory counts
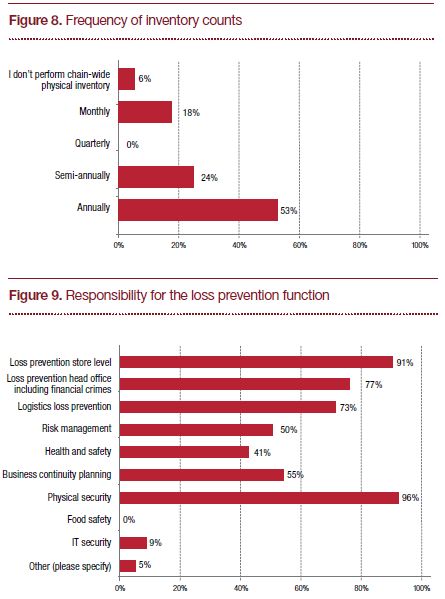
Monitoring inventory is one of the most proven methods to identify retail shrink. Depending on the characteristics of the inventory, number of retail stores and level of automation in the supply chain, this activity can be time consuming and costly. Respondents to this year's survey indicated a wide range of tendencies (see Figure 8) towards the frequency of performing chain-wide physical inventory counts that verify the existence of merchandise as compared to recorded amounts.
Seventy-six per cent of respondents perform either annual or semi-annual chain-wide inventory counts, while 6% do not perform any chain-wide inventory counts at all. Since the frequency of the inventory counts is reflective of the size and complexity of both the merchandise and service offering, the response is consistent with the profile of the respondents with the majority operating large retail operations. Only slightly more than half of the respondents count high loss locations more frequently than chain-wide. Given the benefits of monitoring inventory to identify shrink, this represents a potential opportunity for retailers to more quickly detect localized shrink problems and execute loss prevention efforts.
About one-third of respondents use internal resources to conduct inventory counts. The rest use external, third-party resources.
The promise of Radio Frequency Identification (RFID) as an enabling technology to provide efficiency and improved control over products still does not appear to have been realized with retailers in Canada. While only a small number of respondents in the 2008 survey indicated that they use RFID in their organization to some extent, none of the respondents in the current survey indicated usage. While the costs of this technology have continued to decrease, overall implementation cost can still be relatively high making it difficult to support the business case, especially in challenging economic times. However, given the potential benefits that RFID offers retailers in reducing shrink, improving inventory management and expediting customer check out we believe it is inevitable that retailers will re-examine investing in this technology in the future.
Logistics and vendor controls
Approximately three-quarters of respondents have a policy that defines consequences for vendors, suppliers and carriers that are caught stealing. Those with a policy responded that their policy specifically addresses elements such as theft of intellectual property or intangibles.
Responsibility for loss prevention
Respondents indicated that the main responsibility for loss prevention falls under three categories physical security, loss prevention store and head office level, and logistics loss prevention (see Figure 9). Despite the acknowledged differences in the respondent base, the results in this category differ from our 2008 survey where 90% of respondents indicated that loss prevention was responsible for loss prevention at head office (including financial crimes) and 57% indicated that loss prevention was responsible for health and safety. By focusing on fewer areas of responsibility, loss prevention can better achieve meaningful bottom line results in crime related areas.
Hiring and training
For a number of years it has been common practice to perform pre-employment screening before hiring new staff. Fifty-nine per cent of respondents perform preemployment screening before hiring new staff. However, only 29% of respondent retailers request new employees to pass a police background security check as part of the hiring process. This is approximately half as many respondents in the 2008 survey. We consider budgetary pressure as the likely cause for reduced background checks.
The survey indicated that performing pre-employment screening before hiring new staff improves shrink attributed to external theft. Pre-employment screening helps identify less desirable employees - those with a higher probability of being dishonest and ultimately with a higher potential of instigating criminal activity. Candidates that pass this type of screening are more likely to be watchful of external and internal theft risks and take the appropriate efforts to prevent it.
Responses showed that the majority of retailers have store policies that specifically address theft prevention or security of assets (i.e. a minimum of two staff to open and close store) or avoid having employees work alone in your store(s) or other areas of high risk (i.e. warehouse). Slightly more than half of the respondents identified that they do not routinely rotate employee's duties in stores or other areas of high risk. However, for retailers that do routinely rotate employee's duties, the survey results indicated higher estimates of external shrink. Lack of consistency of staff (especially in a high shrink department) would make it more difficult to identify suspicious customers that return over and over again. A lack of staff continuity should make it easier for thieves to operate for longer periods of time unnoticed. A small minority of respondents actively encourage employees to stop and detain shoplifters. Respondents that routinely encourage employees to take action have a lower percentage of external theft.
Although the impact on shrink for these respondents was positive, we believe this approach must be carefully weighed against employee safety, legal requirements and the advice most frequently provided by law enforcement.
Most respondents provide training on store policies designed specifically to address theft prevention and/or security measures. Highlights of previous internal theft cases with detail of the consequences on both the company and the employee are increasingly used to create awareness and ultimately deter new employees from theft. Responses showed person-to-person employee training programs, as opposed to web-based or video programs, is believed to be the most effective method to educate on matters of loss prevention. Despite its effectiveness, respondents still resort to using online and audio video nearly half of the time. As the use of smartphones and tablets become more common, we expect the usage of computer-based training to supplement person-to-person and continue to grow.
Preventative and detective Methods
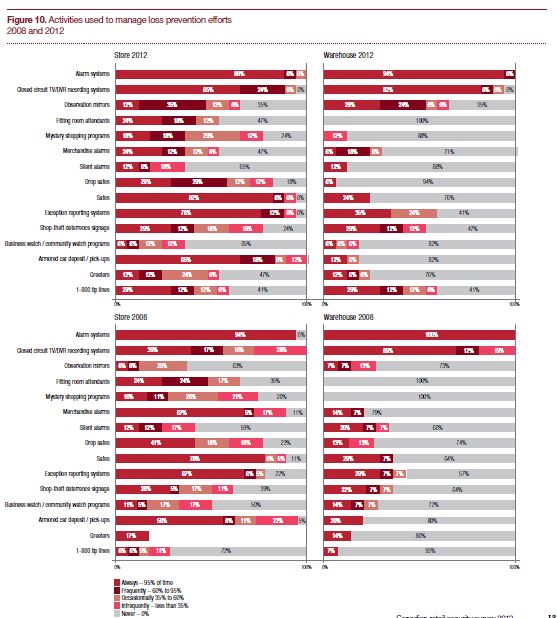
Figure 10 indicates responses to questions related to surveillance systems. Their comparison to the 2008 survey responses, suggest that retailers are investing more in concealed tools to manage loss prevention efforts. Respondents noted a sharp increase in the use of closed circuit TV/ DVR recording systems, observation mirrors and 1-800 tip lines to control losses both in-store and in-warehouse.
Only 35% of respondents in the survey stated that they frequently or always leverage in-store merchandise alarms, compared to 72% in 2008. This is likely a result of retailers using the concealed tools to keep shrink low while providing customers better opportunities to interact with merchandise and a more pleasurable shopping experience.
Responses that indicated frequent use of theft deterrent signage had a higher estimated percentage of shrink from internal sources. While signage provides a visual deterrent that is assumed to discourage external theft, we assume it is less impactful as an internal theft deterrent, especially in organizations where internal controls are weak or inconsistent. Frequent use of in-store safes was also identified as positively reducing shrink.
Conclusion
The 2012 Canadian Retail Security Survey demonstrates that Canadian retailers have worked hard to keep shrink levels relatively stable while operating in a challenging and changing retail landscape. Canadian retailers are continuing to protect themselves against internal and external criminal activities and other sources of loss.
Moving forward, managing internal theft, controlling the supply chain and inventory and competitive efficiency will be important for retailers as they focus their efforts to improve shrink results.
The 2012 survey identified a significant increase in the estimated percentage portion attributed by internal theft to total shrinkage. Retailers will need to address the economic and cultural changes that enable and drive internal theft and the potential solutions to reduce its impact. Preemployment screening, training and the use of concealed preventative and detective methods will play an important part of the retailer's loss prevention toolkit. By reducing internal theft, retailers will be able to positively impact their bottom line and ultimately become more competitive.
The survey also suggests that there are opportunities to leverage technology such as RFID to identify and reduce store shrink. Given the considerable costs to acquire loss prevention tools, retailers will need to examine the trade-offs of initial investment and their potential benefits. Loss Prevention departments that accurately identify the root causes of shrink in their organizations will be most effective in developing profiles and strategies that best address those causes in a prioritized manner.
As the Canadian retail landscape continues to evolve, increased competition from foreign retailers will put more pressure on all areas of the business to reach maximum efficiency, especially those related to cost containment. Increased retail rental/ property costs and price competitiveness will force Canadian retailers to seek meaningful approaches to reduce costs that do not impact the customer experience. Given the significant impact that shrink has on the bottom line, managing and reducing it will be an increasingly important competitive advantage for Canadian retailers.

The content of this article is intended to provide a general guide to the subject matter. Specialist advice should be sought about your specific circumstances.

