1. Executive summary
When preparers of financial statements which are to comply with International Financial Reporting Standards (IFRS) are faced with some 3000 required disclosure points, it is no surprise that the end result is lengthy. Furthermore, as each new reporting season brings another raft of new rules, the financial statements get longer and longer.
So 2009 has been the same as 2008. Financial statements have increased in length by 6% over one year to an average of 47 pages. This compares with 30 pages in 2005, giving an increase of 57% over that four year period. If the 2008/9 increase is repeated every year through to 2020, the average length will be over 100 pages for the audited financial statements alone. A few will shout "what joy". For everyone else faced with this prospect, the reaction might be "how can this be stopped?".
There is some good news. The IASB, shortly to be christened with the longer name of the IFRSB and have its membership expanded from 14 to 16, has learnt how to cut down. Its new IFRS for small and mediumsized entities has only 300 disclosure points.
The UK's Financial Reporting Council calls in its Louder than words report for urgent change to "ensure disclosure requirements are relevant and proportionate to the risks". Unfortunately any moment of hope for action here is cruelly dashed by the FRC's comment that "ideally, we believe another organisation could constructively kick off this work with a view to providing recommendations to the relevant regulators, including the IASB". That organisation is not named. Indeed it is not clear why the FRC should not be that organisation to lead the work.
But what else does the 2009 Deloitte survey on financial statements have to offer, apart from the comments on length?
What is of particular interest this year is identifying the effects of the current economic conditions on companies. This report finds that for companies other than investment trusts:
- nine companies (2008: five) had received modified audit reports. Seven (2008: five) related to going concern and another referred to a subsidiary going into administration post year end;
- 69% of companies (2008: 51%) presented additional non-GAAP performance measures on the face of their income statements. Of these, 61% (2008: 45%) referred to fundamental reorganisations. Impairment charges featured in 35% of relevant companies, compared with 24% in 2008;
- additional sensitivity disclosures for goodwill balances were given by 64% of relevant companies (2008: 23%); and
- 32% of companies (2008: 48%) had made at least one business acquisition.
The trend in these findings will not be a surprise. The rate of change may be more of a concern, given that the economic conditions deteriorated in August/ September 2008 onwards, that is in the second half of the reporting periods under review. No speculation is offered on what the 2009 findings will be. But sadly more complexity in financial reporting rules is promised and the report comments on many of these in "Looking forward" sections within individual chapters. The final chapter reports on the financial statements of investment trusts.
For those wishing assistance with the requirements for the 2009/10 reporting season, Deloitte's iGAAP 2010 Financial statements for UK listed groups will be published at the end of November 2009.
2. Survey objectives
The main objectives of the survey were to discover:
- the level of variety in presentation of the primary statements in listed companies' financial statements;
- which critical judgements and key estimations directors consider to be the most significant when preparing their financial statements;
- how compliance with disclosure requirements and the accounting policy choices made under IFRSs varied;
- how many companies chose to adopt IFRSs for the parent only financial statements and how audit opinions varied; and
- how the results compared with similar surveys performed in previous years.
The annual reports of 130 listed companies were surveyed to determine current practice. The sample of companies is the same as that used for Deloitte's recent publication A telling performance which surveyed narrative reporting. Consistent with the approach adopted in Deloitte's 2008 surveys, the companies were split into two groups being 30 investment trusts and 100 other companies. Investment trusts are those companies classified by the London Stock Exchange as non-equity or equity investment instruments (this excludes real estate investment trusts). They have been treated as a separate population due to their specialised nature and the particular needs of their investors.
The sample is, as far as possible, consistent with that used in last year's survey. As a result of takeovers and mergers over the last twelve months, the sample could not be identical. Replacements and additional reports were selected evenly and at random from three categories being those within the top 350 companies by market capitalisation at 30 June 2009, those in the smallest 350 by market capitalisation, and those that fall in between those categories (the 'middle' group).
The annual reports used were those most recently available and published in the period from 1 August 2008 to 31 July 2009.
As noted above the findings for investment trusts are analysed separately within this publication. Sections 3 to 15 summarise the results for the 100 companies excluding investment trusts and section 16 reviews the 30 investment trusts.
This publication is structured in a similar way to that of most financial statements starting with analysis of the primary statements, followed by the accounting policies and then the notes.
3. Overview of the financial statements*
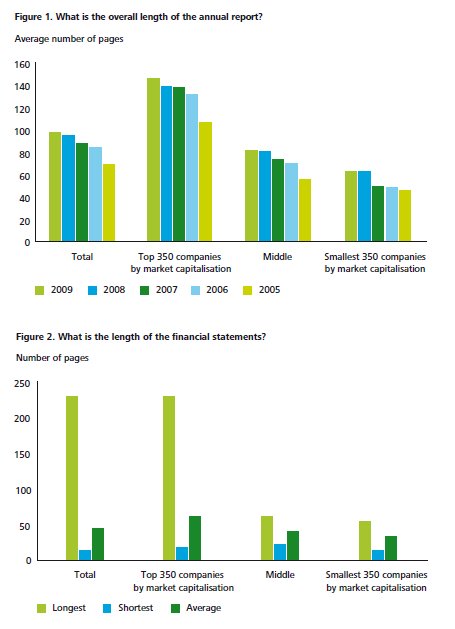
- Annual reports are on average 99 pages long, 41% longer than in 2005.
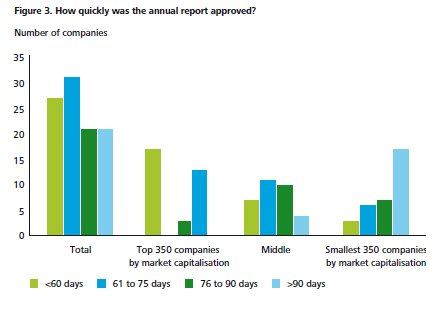
- Financial statements range from 16 to 230 pages.
- One company has a qualified audit opinion and nine companies have an emphasis of matter paragraph.
The average length of annual reports has continued to rise. As discussed in A telling performance it is perhaps not surprising that the length of annual reports has increased given the current economic climate and its effect on companies' results, that requires explanation.
Figure 1 sets out the results in total by category for the five most recent survey periods.
Annual reports ranged from 32 to 469 pages with the financial statements covering from 16 to 230 pages, as shown in Figure 2. As a percentage of the annual report as a whole, the financial statements varied from 25% to 72%. The top 350 companies continue to dedicate more pages to narrative reporting with an average of 44% of the report being financial statements, compared to an average of 48% across the sample. In comparison, the smallest 350 companies surveyed had an average of 54% of the annual report taken up by financial statements. Overall there has been a small increase in the relative length of financial statements this year from 46% of the annual report in 2008 to 48% this year. The main reason for this is probably the need to comply with the extensive financial instruments disclosures required by IFRS 7 which came into force over the last year.
Speed of reporting
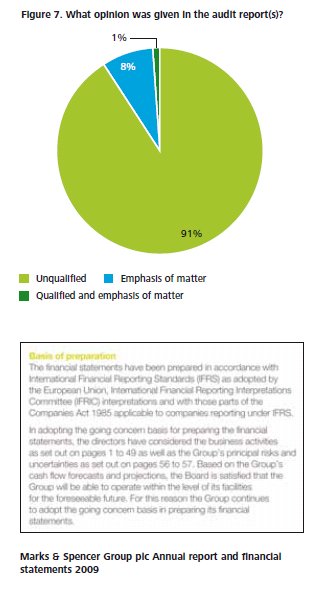
As noted in A telling performance, 59% of companies reported within 75 days (2008: 61%). However there was an overall improvement in speed of reporting on prior year with only 20% of companies reporting after 90 days (2008: 25%), as shown in Figure 3.
The top 350 companies were the quickest reporters, with 91% reporting within 75 days and the remaining 9% within 90 days, which is consistent with 2008. The middle group was quicker than last year with only 12% reporting after 90 days (2008: 18%). The smallest companies remain the slowest reporters with 49% reporting after 90 days, albeit an improvement on 2008 when 58% reported in that timeframe.
The Disclosure and Transparency Rules (DTR) require that the annual report, which includes the audited financial statements, a management report and the responsibility statement, is published within four months of the end of the financial year. This is a significantly shorter deadline than the six months allowed under the previous Listing Rules.
All companies included in the survey were required to publish within four months of their year-end. The potential impact of not complying with this rule is the suspension of shares.
* This section analyses the findings for all companies other than investment trusts
Overall, compliance with this requirement was good with 99 companies meeting the deadline. The company which missed the deadline announced its preliminary unaudited results within four months, but took 141 days to approve its financial statements.
During this period administrators were appointed to two of its subsidiaries and a company voluntary arrangement was entered into.
Reporting frameworks and auditors' reports
In the sample of companies only one newly listed company was adopting IFRS for the first time whilst the remaining 99 had transitioned to IFRS in a previous period.
As illustrated by Figure 4, all but one company had an audit opinion under accounting policies which were in accordance with IFRS as adopted by the European Union (EU). The exception was a Guernsey company which reported under IFRSs as issued by the International Accounting Standards Board (IASB).
Twelve companies had further audit opinions under IFRSs as issued by the IASB in addition to those adopted by the EU.
This year saw differences between IFRSs as adopted by the EU and as issued by the IASB for the first time as the timing of adopting new standards and interpretations differed.
During the year there were differences with IFRIC 12 Service Concession Arrangements, IFRIC 13 Customer Loyalty Programmes and IFRIC 14 IAS 19 – The limit on a defined benefit asset, minimum funding requirements and their interaction. In Deloitte's 2008 survey, 19% of companies surveyed had further audit opinions under IFRSs as issued by the IASB. These above differences may be the reason for the reduction this year to 12%.
Three FTSE 100 companies also had an audit opinion provided under US GAAP and one FTSE 100 company also had an opinion under Australian IFRSs.
57% reported the results of their parent company under IFRSs, 42% of companies reported under UK GAAP and the remaining company was exempt from producing a further set of financial statements because it was a listed entity with no subsidiaries, as shown in Figure 5.
The number of parent companies reporting under IFRS has increased by eight from last year's survey where 49 companies used IFRSs in their parent company individual financial statements. The increase in parent companies using IFRSs suggests that the benefit of using the same reporting framework and therefore applying consistent accounting policies is outweighing the benefits of remaining under UK GAAP.

Looking forward
The UK Accounting Standards Board (ASB) is consulting with its constituents over the future of UK GAAP. The ASB believes that only one accounting framework is needed in the UK and it should be based on IFRS. The ASB has issued a paper seeking views on its proposal to replace current UK GAAP by adopting the IFRS for SMEs. IFRS for SMEs would then be available for use by all UK companies except those with public accountability who would use full IFRS. Thus the listed parent company would have to use full IFRS in its solus financial statements.
The majority of companies provided one auditors' report which covered all opinions given, whether applicable to the consolidated financial statements or the parent company financial statements. 38% of companies had two auditors' reports, being one for the consolidated financial statements and a separate opinion for the company financial statements. This is shown in Figure 6.
British Telecommunications plc and Vodafone plc both contained three separate auditors' reports, being one for consolidated financial statements covering both IFRS opinions (EU endorsed IFRSs and as issued by the IASB), one for consolidated financial statements under US GAAP and one for parent company financial statements.
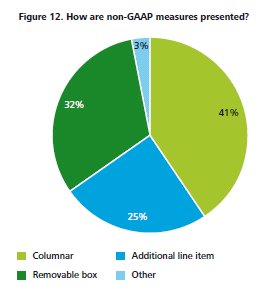
As set out in Figure 7, 91% of audit opinions were clean. Of the remaining nine, one was both qualified in respect of limitation of scope and contained an emphasis of matter paragraph on going concern. There were six further emphasis of matter paragraphs on going concern and one each on the post balance sheet liquidation of a subsidiary and uncertainty around the outcome of litigation.

Going concern
In November 2008 the Financial Reporting Council (FRC) published an Update for directors of listed companies: going concern and liquidity risk. The Update brought together the requirements on directors to comment on going concern and liquidity in annual reports and financial statements, in the light of the significant economic difficulties that were being experienced in the latter half of 2008. However, its status was that of guidance and it did not replace the formal 1994 Guidance on going concern.
Eighty seven companies approved their financial statements on or after 15 December 2008 and therefore were able to take heed of the FRC Update published in November 2008. 62% of eligible companies clearly adopted the FRC guidance. Of the 38% which did not, 21% were in the smallest 350 companies, 13% in the top 350 and 5% in the middle group. The Marks & Spencer Group plc example below shows a clear disclosure of the going concern basis used in preparing the financial statements.
Looking forward
In October 2009 the FRC published Going concern and Liquidity Risk: Guidance for Directors of UK Companies 2009 (the 2009 Guidance). This will be implemented for periods ending on or after 31 December 2009 as it is expected that the Financial Services Authority (FSA) will take the necessary steps to replace the 1994 Guidance with the 2009 Guidance to meet this timetable.
The 2009 Guidance brings together the Update published in November 2008 and the 1994 Guidance and draws on the experience gained in the first half of 2009. The format and style of the 2009 Guidance is significantly different to the 1994 Guidance. It follows the same practical approach to making a going concern assessment but then seeks more disclosures. The FRC believes that its impact will be to support directors in making high quality assessments of going concern and providing effective disclosures without increasing the costs for companies or users of financial statements.
A key feature of the 2009 Guidance is that it requires companies to provide details, either directly or by cross reference, on the assessment of the company's going concern basis in the financial statements as opposed to the narrative section of the annual report. Currently, only 30% of companies included a statement regarding the directors' assessment of going concern within their financial statements, an example of which is given above left.
4. Income statement – results from operating activities*
- 99% of companies comply with at least the minimum disclosure requirements for the face of the income statement.
- 69% (2008: 51%) of companies present additional non-GAAP performance measures on the face of the income statement.
- One company elects to adopt early the requirements of IAS 1 (2007).
Looking forward: new reporting requirements
IAS 1 Presentation of Financial Statements revised 2007 (IAS 1 (2007)) was endorsed in December 2008. IAS 1 (2007) gives an additional choice over the presentation of statements of financial performance, principally whether to present a single statement of comprehensive income or an income statement together with a statement of comprehensive income.
The standard is effective for periods beginning on or after 1 January 2009. One company sampled had elected to adopt the revised IAS 1 (2007) ahead of its effective date and presented a single statement of comprehensive income.
Contents of the income statement
Both IAS 1 (2003) and IAS 1 (2007) require, as a minimum, separate disclosure on the face of the income statement of revenue, finance costs, tax expense and profit or loss.
All but one company sampled complied with the presentation requirements of IAS 1. The non-compliant company disclosed its finance costs net of finance income. This presentation is popular with companies reporting under UK GAAP but has been rejected by IFRIC as it is an unacceptable option under IFRS.
The length of the income statement, measured in number of lines from top to profit after tax, ranged from eight to 34 lines. Figure 8 illustrates how this varied according to size of company.
There is no specific requirement regarding the classification of operating expenditure on the face of the income statement. IAS 1 recognises that showing expenses by either function or nature has benefits for different companies. Figure 9 shows how operating expenses are presented on the face of the income statement.

The majority of companies sampled chose to present their expenses by function, for example as part of cost of sales or administrative costs. Where costs are presented by function there is a further requirement within IAS 1 to disclose additional information on the nature of the expenses including depreciation and amortisation expense and employee benefits expense. This requirement was met by all but one company sampled.
There is considerable variety in presentation of the income statements which allows companies to present their results in a manner that is most appropriate to their business. However, this variety may not help the users of the financial statements to compare one company to another.
* This section analyses the findings for all companies other than investment trusts
Additional non-GAAP measures Last year 51% of companies went beyond the IAS 1 requirements and presented additional non-GAAP performance measures on the face of the income statement. This year, as a result of the turbulent economic period, that percentage has risen to 69%. This is illustrated in Figure 10 below. This use of additional measures is permitted under IAS 1 which encourages such items to be presented when this is relevant to an understanding of a company's financial performance.


However, of the companies presenting additional non-GAAP information 22% of companies did not define their additional non-GAAP measures. Thus, it was hard to understand fully why these measures were being used.
The items most commonly excluded from non-GAAP performance measures are detailed in Figure 11 below.
The costs of fundamental reorganisations were excluded from performance measures by 61% of relevant companies, a significant increase from the 45% in last year's survey. Impairment charges were excluded by 35% of relevant companies, again a big increase on last year's 24%. These results are not surprising given the economic environment that these companies were operating in during the period under review.
Other common measures excluded the effects of amortisation of intangible assets, the disposal of investments and fixed assets, and items relating to IAS 39 Financial instruments: Recognition and measurement.
46% of companies giving additional performance measures referred to the highlighted items as 'exceptional', a term not used in IFRSs but obviously familiar to those who used to report under UK GAAP. FRS 3 Reporting Financial Performance requires identification of such items. Less common were the terms 'non-recurring' and 'underlying' used by 9% and 6% of companies respectively.
These additional performance measures are presented on the face of the income statement in a variety of ways, as Figure 12 illustrates.
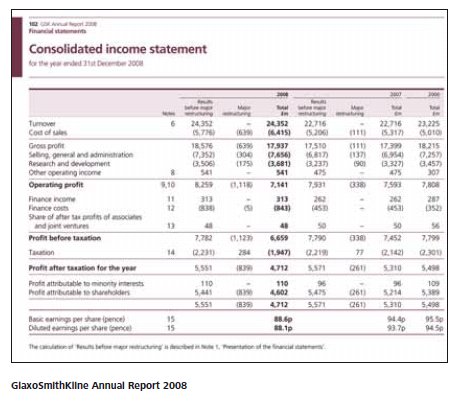
41% of relevant companies took a columnar approach to presenting their non-GAAP measures. There was:
- a complete income statement, from revenue to profit after tax, which excluded the non-GAAP measures;
- a middle column containing the non-GAAP items; and
- a column showing the full results including the non- GAAP items were presented.
This method is illustrated in the Annual Report for GlaxoSmithKline plc above right.
The removable box approach was the second most popular option to present non-GAAP items, used by 32% of relevant companies. Under this approach the non-GAAP items were included in the income statement but further analysis, typically of operating profit, was presented to highlight these 'exceptional items'. This is demonstrated in the Annual Report of Rexam PLC.

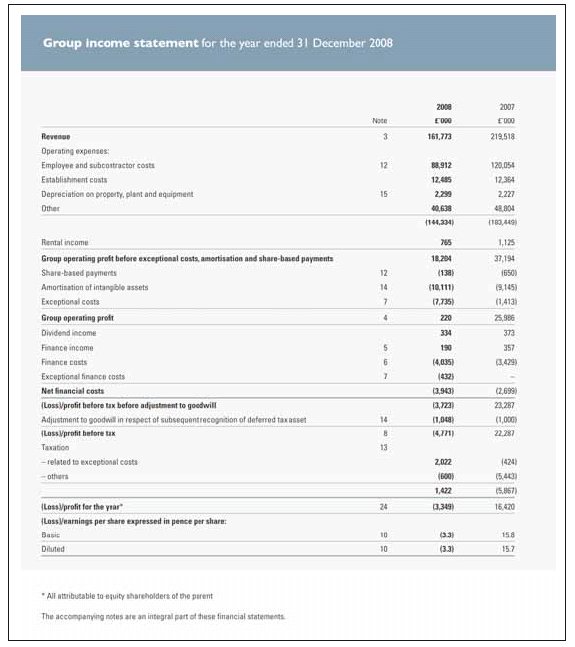
A quarter of relevant companies in the sample included additional line items in their income statement. This approach excluded the non-GAAP measure from the main body of the expense and often included a sub-total such as "operating profit before exceptional items", such that the non-GAAP measure was integral to the income statement. This is demonstrated in the Annual Report of LSL Property Services plc shown above.
To read this document in its entirety please click here.
The content of this article is intended to provide a general guide to the subject matter. Specialist advice should be sought about your specific circumstances.

