

The UK was recently ranked the second most innovative country in
the world according to the 2015 Global Innovation Index
(GII).
The GII is an index co-published by Cornell University, INSEAD and the World Intellectual Property Organisation (WIPO). The theme for the 2015 GII was "Effective Innovation Policies for Development" with a particular focus on the impact of policies designed to increase innovation capacity in developing countries. The GII uses 79 indicators across a range of themes to identify and analyse global innovation trends. This year the GII has metrics for 141 economies which represent 95.1 per cent of the world's population and 98.6 per cent of the world's GDP.
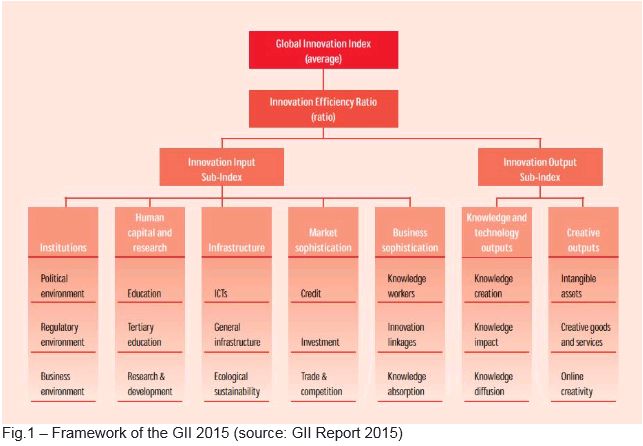
The 79 indicators are divided into a framework with the main scores being an overall GII, Input and Output Sub-Indices and an Innovation Efficiency Ratio. The chart in Figure 1 provides a high level overview of what factors are used to calculate each score and how they relate to each other.
As part of the analysis of the index, the report accompanying the GII 2015 highlights that Switzerland, the UK, Sweden, the Netherlands and the USA are the world's top five most innovative nations. It notes that "The GII leaders have created well-linked innovation ecosystems where investments in human capital, combined with strong innovation infrastructures, contribute to high levels of creativity". It further explains that these countries consistently score well in most of the indicators used to compile the index. The top 25 countries are shown in Figure 2.

While the main body of the report focusses on developing countries, a number of interesting conclusions might be drawn from its contents and the UK's second place rank on the GII.
- One major factor that sets the leaders of the high income countries apart from each other in the rankings is the "Quality of Innovation" score (made up of the performance of the top three universities in that country, the reach of scholarly articles from that country and the international dimension of patent applications made by businesses in that country – see Figure 3). The UK and USA stay ahead of the pack in this area largely due to their world-class universities. This result seems to indicate that the university funding crisis in the UK has not significantly affected the UK's innovation ranking – although it should be highlighted it may take a number of years for any effect to trickle through and be noticeable in the indicators used by the GII.
- In the overall score, the UK was ranked 10th in 2011, fifth in 2012, third in 2013, second in 2014 and second again in 2015. These results suggest the UK is doing something right for it to have increased and maintained its position in the index. This goes against a seemingly commonly held belief in media coverage that UK businesses have been losing their position as top innovators. The report suggests that compared to the vast majority of the world, the UK has fine-tuned its policies to allow innovation to thrive.
- The UK's weaknesses appear to be mainly in the areas of education, investment and productivity. Some particularly weak scores include percentage of total graduates from science and engineering subjects (39th ), pupil-teacher ratio for secondary education (56th), gross capital formation (122nd) and growth rate of GDP per person engaged (ie employed or self-employed – 78th). These scores match up with the widely held belief that the UK needs more science and engineering graduates and has school class sizes that are too large. The low scores on gross capital formation and GDP growth rate could simply be a symptom of the developed economies having naturally lower growth rates than developing economies which tend to score more highly in these areas.
- There are some unexpected rankings where countries that do not have a wider reputation for being particularly innovative have scored highly whereas countries often considered to be powerhouses of science, technology and innovation have not done so well. One notable example is Germany (seen as the powerhouse of Europe) which ranks outside the top ten at 12th only just ahead of Iceland, but for example behind Luxembourg and Ireland which are at ninth and eighth place respectively. These rankings could be indicative of the fact that the GII takes into account many additional indicators not usually associated with innovation. Indeed, if the Quality of Innovation rankings in Figure 3 are used as a measure instead of the overall GII rankings, a list of countries appears that are more commonly associated with innovation in high and middle income economies.
Luxembourg's high score might be attributable, at least in part, to the fact that many companies use Luxembourg as an EU base for tax reasons, which creates the impression that the country might be more innovative than it actually is. This explanation is supported by Luxembourg being ranked first for Foreign Direct Investment inflows and outflows (suggesting assets are simply channeled through the country) but having low rankings for a number of indicators that make up the Quality of Innovation score (such as 73rd in university performance, 76th in citable scholarly articles) and other factors often associated with innovation (84th in percentage of graduates from science and engineering).

- Further, despite a drop in R&D investment during the economic crisis, the report notes that UK business R&D investment has now fully recovered to pre-crisis levels. Again, this seems to go against the school of thought that investment in R&D has suffered long-term damage from the economic crisis and that innovation in the UK is suffering as a result.
It should be appreciated that the scores are simply the output of the methods and indicators used by the GII's authors and these can sometimes produce results that seem contrary to widely held opinion or subjective experience (such as the relatively low score of Germany). Despite this, it can be a useful tool to analyse changes and trends in innovation globally. In particular, the GII 2015 report flags that innovation policies which work for one nation might not be suitable for another, and finding what works for any given country is largely a matter of trial, error and perseverance. Based on the consistently high scores of the UK, it seems the innovation policies of the last four years are fostering an ecosystem that encourages and supports innovation or at the very least, supports the indicators which the GII uses to score it.
The content of this article is intended to provide a general guide to the subject matter. Specialist advice should be sought about your specific circumstances.