
Background—We analyzed the terms of venture financings for 114 companies headquartered in Silicon Valley that reported raising money in the first quarter of 2012.
Overview of Fenwick & West Results
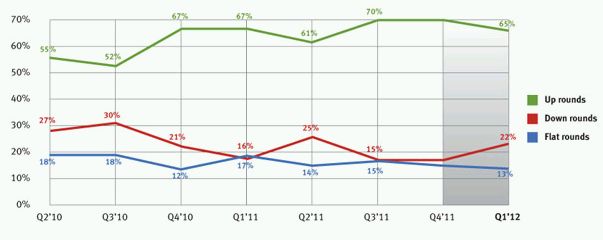
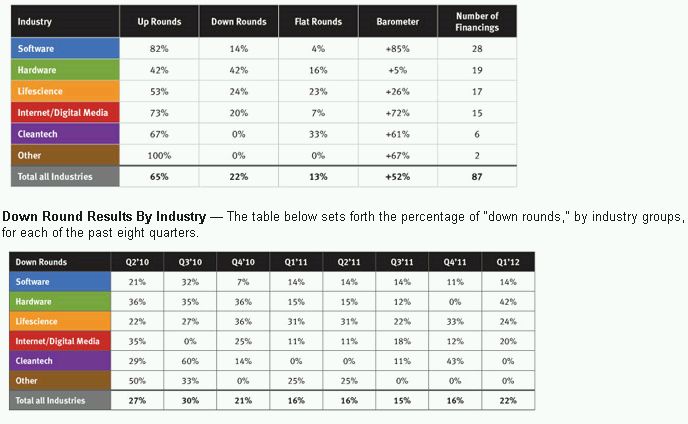
- Up rounds exceeded down rounds in 1Q12, 65% to 22%, with 13% of
rounds flat. This showed continued solid valuations in the venture
environment, although a small drop off from 3Q11 and 4Q11, when 70%
of rounds were up rounds. This was the eleventh quarter in a row in
which up rounds exceeded down rounds.
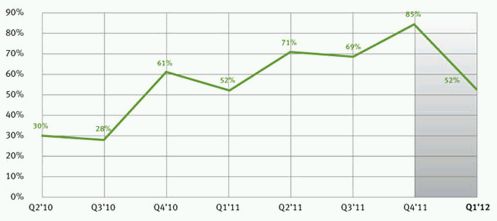
- The Fenwick & West Venture Capital Barometer" showed
an average price increase of 52% in 1Q12, a decline from the 85%
reported in 4Q11, but still a solid showing.
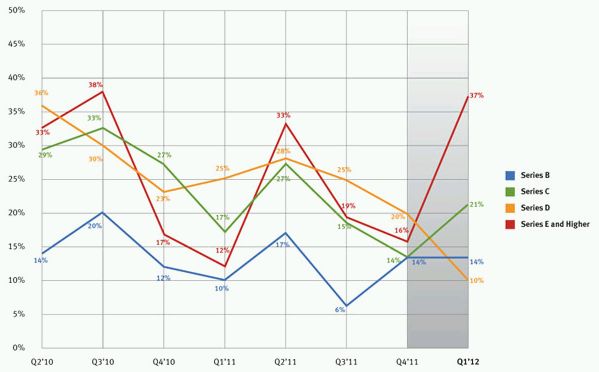
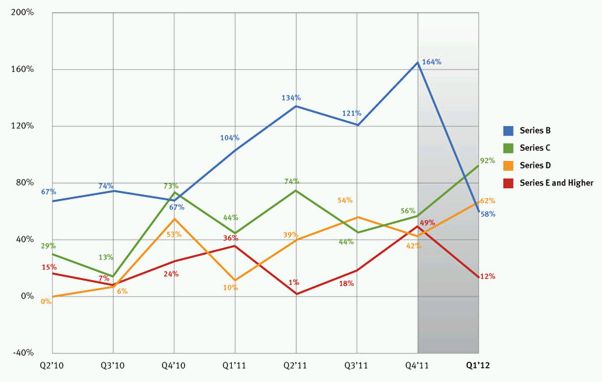
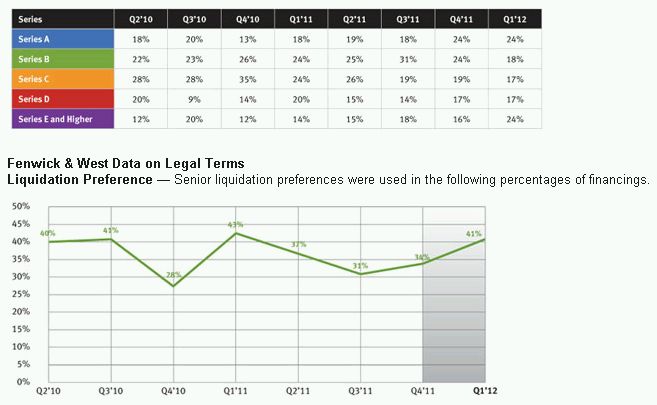
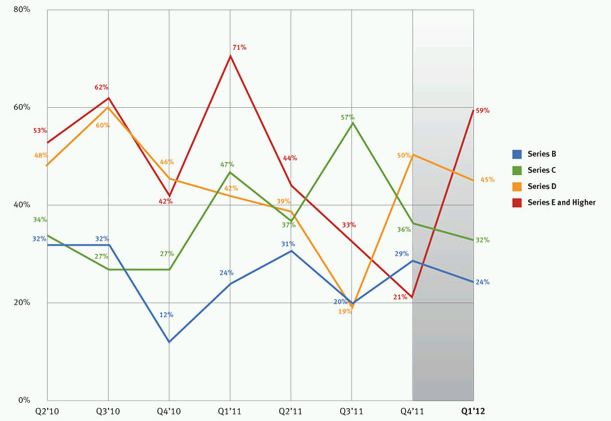
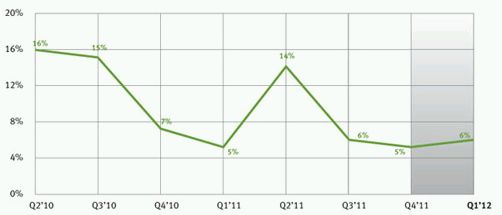
- We note some weakness in late stage financing (Series E and
higher) valuations, where 37% of the financings were down rounds
and the Barometer reported only a 12% increase. Series B financings
were also not as frothy as they have been, with a Barometer reading
of 58%, the lowest since 4Q09, but still very solid.
- The results by industry are set forth below. In general
software and digital media/internet companies continued to see the
strongest valuation increases, with hardware and life sciences
lagging.
Overview of Other Industry Data
- Venture valuations were healthy, but investment was down.
- M&A valuations were up, but the number of deals was
down.
- Venture fundraising was mixed, but corporate venture investing
was up.
- IPOs were up, and the passage of the JOBS Act is a further
encouraging signal for the public market, but continuing global
financial uncertainty, especially in Europe, is a concern.
So what is the take-away? Venture fundraising continues to be problematic, and likely contributed to the decreased venture investment the last two quarters. However with IPOs improving, and interest rates still extremely low, there is reason to believe that venture fundraising will improve, if the global economic environment doesn't further increase risk averseness. The M&A market slowed a bit in 1Q12, possibly to give participants a chance to evaluate the improvement in IPOs, and its possible effect on valuations, but corporate America has plenty to spend, evidenced by their increasing participation in venture investment. And the areas of entrepreneurial focus and innovation are broad, with mobile, cloud, security, big data and of course social media all attracting substantial attention.
-
Venture Capital Investment.
Venture capital investment in the U.S. declined for the second quarter in a row, with the decline evident in most major industry segments, including internet/digital media.
Dow Jones VentureSource ("VentureSource") reported $6.2 billion of venture investment in 717 deals in 1Q12, a 16% decline in dollars from the $7.4 billion invested in 803 deals in 4Q11 (as reported in January 2012).
The PwC/NVCA MoneyTree" Report based on data from Thomson Reuters (the "MoneyTree Report") reported $5.8 billion of venture investment in 758 deals in 1Q12, a 12% decline from the $6.6 billion invested in 844 deals in 4Q11 (as reported in January 2012).
-
Merger and Acquisitions Activity.
M&A activity for venture-backed companies had mixed results in 1Q12, with deal volume declining for the second quarter in a row, to the lowest quarterly amount since 2009, but with Dow Jones reporting a significant increase in deal proceeds.
Dow Jones reported 94 acquisitions of venture-backed companies in 1Q12 for $18.1 billion, a 12% decline in transaction volume, but a 93% increase in dollars, from the 107 transactions for $9.4 billion in 4Q11 (as reported in January 2012).
Thomson Reuters and the NVCA ("Thomson/NVCA") reported 86 transactions in 1Q12, a 7% decline from the 92 reported in 4Q11 (as reported in January 2012). Sixty-eight of the 86 deals were in the IT sector.
Dealogic reported that Google, Facebook, Groupon and Zynga purchased a combined 34 companies in 1Q12 (not necessarily all venture-backed).
- IPO Activity.
IPO activity for venture-backed companies improved again in 1Q12, which was the best quarter for number of IPOs since 4Q07.
VentureSource reported 20 venture-backed IPOs raising $1.4 billion in 1Q12, compared to 10 IPOs raising $2.4 billion in 4Q11 (as reported in January 2012). There were 50 companies in registration at the end of the quarter.
We note that the new law that permits confidential IPO filings may delay future information on the number of companies in registration, as a substantial number of companies appear to be taking advantage of this alternative.
Thomson/NVCA reported 19 IPOs for $1.5 billion in 1Q12, compared to 12 IPOs raising $2.6 billion in 4Q11. Eleven of the IPOs were in IT and five in healthcare, and 95% were U.S.-based companies.
- Venture Capital Fundraising.
Industry sources reported conflicting fundraising results for 1Q12, with Dow Jones reporting an increase in dollars raised and Thomson/NVCA reporting a decline. Taking an average of the two, venture capital fundraising and venture capital investing were approximately equal this quarter, but the number of funds raising money continues to be low.
Dow Jones reported that 47 U.S. venture funds raised $7 billion in 1Q12, a 35% increase in dollars over the $5.2 billion that was raised in 4Q11 (as reported in January 2012).
Thomson/NVCA reported that 42 U.S. venture capital funds raised $4.9 billion in 1Q12, a 13% decrease in dollars over the $5.6 billion raised by 38 U.S. funds in 4Q12 (as reported in January 2012). The top 5 fundraisers accounted for 75% of the total amount raised, with Andreessen Horowitz raising $1.5 billion and leading the way.
- Secondary Markets.
The secondary market for venture-backed company shares is in uncharted waters.
The recently passed JOBS Act made filing for an IPO more appealing to companies, which could decrease the number of late stage private companies whose shares would be available for secondary trading. However, the Act also increased the maximum number of shareholders that private companies could have before registering with the SEC, which allows private companies to stay private longer, which could increase the pool of late stage private companies whose shares would be available for secondary trading.
Additionally, Facebook, which accounted for a large percentage of the trading on secondary exchanges, and whose shares were also purchased by secondary funds, just went public, and secondary trading of their shares ended at the end of March 2012.
And the venture-backed IPO market seems to be improving in general, providing more opportunity for late stage private companies to go public.
Second Market reported that issuers were the buyer in 54% of second market transactions, but only accounted for 1.7% of transaction proceeds, suggesting that issuers are using Second Market to purchase small amounts of shares from numerous sellers, likely to limit their number of shareholders.
- Corporate Venture Capital.
With a challenging venture fundraising environment, we thought it would be useful to provide some information on corporate venture capital ("CVC").
In general, CVC declined precipitously in 2009 as a result of the stock market decline and global financial problems in 2008. Since then it has rebounded significantly with corporate venture investment increasing from $1.4 billion in 2009 to $2.0 billion in 2010 to $2.3 billion in 2011. Similarly, CVCs participated in 12.7% of all venture deals in 2009, 13.6% in 2010 and 14.9% in 2011. That said, these amounts significantly lag 2007, the best year for CVC in the past decade, when CVCs invested $2.6 billion and participated in 19% of deals (data from the MoneyTree Report).
While companies like Intel and Cisco have long been significant players in CVC investing, it will be interesting to see how heavily the current wave of major Silicon Valley companies participate in CVC. One indiciation is that Google started Google Ventures two years ago with the goal of investing $100 million a year, and has invested in 20 start-ups through March 2012. (Data from San Jose Mercury)
Another indication of CVC activity is that the number of CVCs who are members of the NVCA has grown from 50 to 62 members in the past year, and now comprises 7% of the total membership. (Data from Dow Jones VentureWire)
CVC investment seems more focused in industries with large capital requirements like cleantech and biotech, which accounted for 23% and 16% of CVC investment respectively in 2010/2011, than are independent venture capitalists. (Data from the MoneyTree Report)
- Venture Capital Sentiment.
The Silicon Valley Venture Capitalist Confidence Index® produced by Professor Mark Cannice at the University of San Francisco reported that the confidence level of Silicon Valley venture capitalists was 3.79 on a 5 point sale in 1Q12, a significant increase from the 3.27 reported in 4Q11, and the first increase in four quarters.
- Nasdaq.
Nasdaq increased 16% in 1Q12, but has declined 10% in 2Q12 through May 21.
The Barometer results by series are as follows:
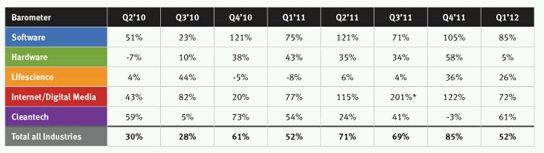
Barometer Results By Industry — The table below sets forth Barometer results by industry group for each of the last eight quarters.
A graphical representation of the above is below.
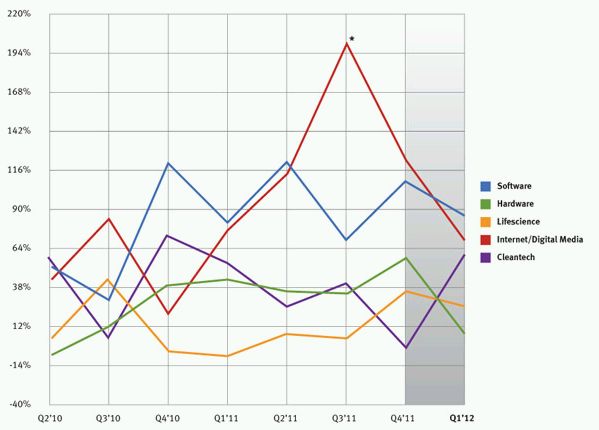
*Please note that one internet/digital media company had a
1,500% up round. If this were excluded the Barometer result for the
internet/digital media industry would have been 73%.
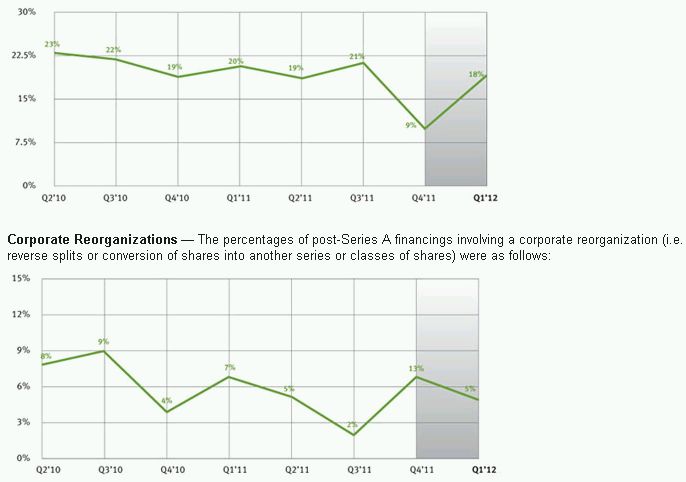
Note that anecdotal evidence indicates that companies are
increasingly using contractual "pull up" provisions
instead of charter based "pay to play" provisions. These
two types of provisions have similar economic effect but are
implemented differently. The above information includes some, but
likely not all, pull up provisions, and accordingly may understate
the use of these provisions.
- Notes on Methodology
-
When interpreting the Barometer results please bear in mind that the results reflect the average price increase of companies raising money in a given quarter compared to their prior round of financing, which was in general 12 to 18 months prior. Given that venture capitalists (and their investors) generally look for at least a 20% IRR to justify the risk that they are taking, and that by definition we are not taking into account those companies that were unable to raise a new financing (and that likely resulted in a loss to investors), a Barometer increase in the 30-40% range should be considered normal.
When comparing current period results to prior period results based on third party data (e.g., amounts invested by venture capitalists, amount of M&A proceeds, etc.), we use the prior period results initially published by the third party for the period, not the results that have been updated with additional information over time, to provide better comparability with the current period published results. For example, when comparing fourth quarter results to third quarter results, we use the initially published third quarter results, typically provided in October, not the updated results that are typically provided in January. Such situations are set forth in our report with a parenthetical as to the date the information was initially reported.
- Disclaimer
-
The preparation of the information contained herein involves assumptions, compilations and analysis, and there can be no assurance that the information provided herein is error-free. Neither Fenwick & West LLP nor any of its partners, associates, staff or agents shall have any liability for any information contained herein, including any errors or incompleteness. The contents of this report are not intended, and should not be considered, as legal advice or opinion.
The content of this article is intended to provide a general guide to the subject matter. Specialist advice should be sought about your specific circumstances.