
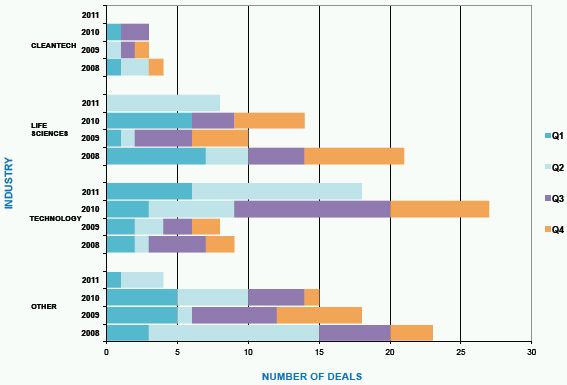
Activity Level of New England Series A Transactions
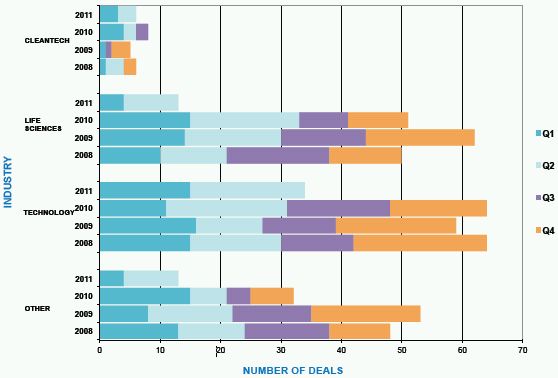
Activity Level of New England Series B and Later Round Transactions
Size of New England Q2 2011 Series A Transactions by Industry

Size of New England Q2 2011 Series B and Later Round Transactions by Industry

THE NUMBERS
Set forth below are analysis and commentary regarding the information reported in the various tables throughout this issue of Venture Perspectives.
Activity Levels
During Q2 2011, the total number of New England Series A transactions increased 229% over Q1 2011 and 109% over Q2 2010. The Technology sector accounted for 52% of the Q2 2011 total, the Life Sciences sector for 35% and the "Other" sector for 13%. There were no Series A Cleantech transactions.
The total number of New England Series B and Later Round transactions during Q2 2011 increased 54% over Q1 2011 and decreased 13% from Q2 2010. The Technology sector showed the strongest performance, accounting for 48% of the Q2 2011 total. The Life Sciences and "Other" sectors each accounted for 23% of the Q2 2011 total, and the Cleantech sector accounted for less than 10%.
At the national level, the reported Q2 2011 information presents a somewhat different picture from the quarterly New England information. Nationally, the total number of Series A transactions increased only 22% over Q1 2011 (compared to a 229% increase in New England) and only 29% over Q2 2010 (compared to a 109% increase in New England). The total number of Series B and Later Round transactions at the national level increased only 17% over Q1 2011 (compared to a 54% increase in New England) and decreased only 7% from Q2 2010 (compared to a 13% decrease in New England). There was also considerable variation between the New England data and the national data with respect to the relative number of transactions represented by each of the various sectors for both Series A Round and Series B and Later Round transactions. In New England, the sector with the greatest relative percentage of the reported transactions for the quarter was Technology, but nationally it was the "Other" category.
For the first half of 2011 compared to the first half of 2010, New England Series A activity was up 15%, national Series A activity was up 22%, New England Series B activity was down 27% and national Series B activity was down 2%.
Deal Size
During Q2 2011, 70% of the New England Series A transactions involved investments under $5 million, and 17% involved investments between $5 million and $10 million, 4% involved transactions between $10 million and $15 million, and 9% involved transactions over $20 million. No Series A financings fell between $15 million and $20 million invested.
During Q2 2011, 35% of the New England Series B and Later Round transactions involved investments under $5 million, 18% involved investments between $5 million and $10 million, 13% involved investments between $10 million and $15 million, 15% involved investments between $15 million and $20 million, and 20% involved investments greater than $20 million.
Implied Pre-Money Valuations
Series A Round
The Selected New England Series A Transactions information for Q2 2011 presents the usual varied picture both across and within industry sectors:
- Cleantech: There were no Cleantech transactions.
- Life Sciences: In the five reported Life Sciences transactions, the implied pre-money valuations ranged from $12.6 million to $107.5 million.
- Technology: In the eight Technology transactions, the implied pre-money valuations ranged from $3.2 million to $33.7 million.
- Other: In the three transactions in the "Other" category, the implied pre-money valuations were all under $5 million.
Series B and Later Round
The Selected New England Series B and Later Round Transactions information for Q2 2011 also presents a varied picture across and within industry sectors:
- Cleantech: Of the three reported Cleantech transactions, two were large Series B up rounds and one was a small Series "B+" even round. The implied pre-money valuations ranged from $82.2 million in the even round to $264.8 million in the larger up round.
- Life Sciences: Of the seven reported Life Sciences transactions, six were up rounds and one was an even round. The implied pre-money valuations ranged from a low of $30.3 million in a Series C up round to a high of $892.5 million in a Series F up round.
- Technology: There were 16 reported Technology transactions, of which seven were up rounds and nine were down rounds. The implied pre-money valuations ranged from a low of $7.7 million in a Series B down round to a high of $162.8 million in a Series G up round.
- Other: There were eight reported transactions in the "Other" category, which included seven up rounds and one down round. The implied pre-money valuations ranged from a low of $20.2 million to a high of $81.6 million, both in Series B up rounds.
Terms
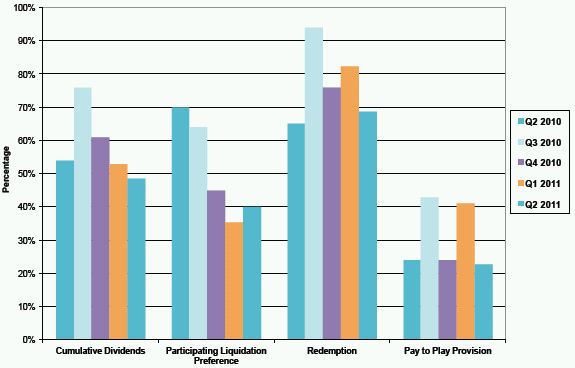
The bar graph relating to Terms for Selected New England Series A Transactions shows the following trends in Q2 2011 as compared to the comparable prior year quarter and the immediately preceding quarter:
- an increase in the percentage of transactions with cumulative dividends (53% in Q2 2011 versus 43% in both Q2 2010 and Q1 2011);
- no change in the percentage of transactions with a participating liquidation preference compared to the prior year quarter and a decrease compared to the immediately preceding quarter (29% in both Q2 2011 and Q2 2010 and 43% in Q1 2011);
- an increase in the percentage of transactions with a redemption provision compared to the prior year quarter and a decrease compared to the immediately preceding quarter (65% in Q2 2011 versus 57% in Q2 2010 and 86% in Q1 2011); and
- an increase in the percentage of transactions with a pay to play provision (18% in Q2 2011 versus 7% in Q2 2010 and 14% in Q1 2011).
The bar graph relating to Terms for Selected New England Series B and Later Round transactions shows the following trends in Q2 2011 as compared to comparable prior year quarter and the immediately preceding quarter:
- a decrease in the percentage of transactions with cumulative dividends (49% in Q2 2011 versus 54% in Q2 2010 and 53% in Q1 2011);
- a decrease in the percentage of transactions with a participating liquidation preference compared to the prior year quarter and an increase compared to the immediately preceding quarter (40% in Q2 2011 versus 70% in Q2 2010 and 35% in Q1 2011);
- an increase in the percentage of transactions with a redemption provision compared to the prior year quarter and a decrease compared to the immediately preceding quarter (69% in Q2 2011 versus 65% in Q2 2010 and 82% in Q1 2011); and
- essentially no change in the percentage of transactions with a pay to play provision compared to the prior year quarter and a decreased compared to the immediately preceding quarter (23% in Q2 2011 versus 24% in Q2 2010 and 41% in Q1 2011).
Conclusion
There were positive trends in Q2 2011. New England Series A activity levels were up significantly, both for the quarter and for the first half of 2011. Thomson Reuters and the National Venture Capital Association reported continuing improvement in venture-backed exit activity for the quarter, with the dollar volume of IPOs being the highest quarterly total since 2000 and M&A exits attaining 2009 levels.
There were also negative trends in the quarter. The primary area of concern continues to be the level of venture capital fundraising activity. As many have noted, the venture industry can not continue to invest more than it raises. Of particular concern is the dwindling number of funds able to obtain capital commitments. According to Thomson Reuters and the National Venture Capital Association, the number of venture capital funds obtaining commitments during the second quarter and first half of 2011 decreased compared to the comparable prior year periods, and the number of funds receiving commitments during the first half of 2011 was the lowest since the first half of 1995. Moreover, again according to Thomson Reuters and the National Venture Capital Association, approximately 50% of the fundraising total for Q2 2011 was represented by two funds in the same fund family. This contraction in the venture capital industry may bode well for the funds that survive and the returns that they will be able to achieve. It is not likely to have such a beneficial effect on the companies seeking venture financing. Fewer and larger funds is likely to mean that outside the industry de jour, financing will become even harder to obtain, particularly for new entrepreneurs and for Series A rounds.
Selected New England Series A Round Transactions

Selected New England Series B And Later Round Transactions


Terms Of Selected New England Series A Round Transactions 2010-2011

The chart above summarizes publicly available information about various terms included in the Certificates of Incorporation for Series A financings for companies headquartered in New England. For the purposes of this table we have focused solely on transactions that appeared to us, from the public filings, to be identifiable as Series A financings. We have excluded transactions that appeared to us to involve considerations and concerns different from those applicable in a typical Series A round, such as might occur, for example, in the case of a recapitalization. For this reason, the set of transactions described above may vary somewhat from the set of transactions described in the tables elsewhere in this publication. We have selected terms to report on that we believe will be of particular interest to entrepreneurs. A definition of each of these terms may be found on our website. Information included in the table above is based on information made publicly available by participants in the relevant transactions and is not comprehensive.
Terms of Selected New England Series B and Later Round Transactions 2010-2011
The chart above summarizes publicly available information about various terms included in the Certificates of Incorporation for Series B and later round financings for companies headquartered in New England. For the purposes of this table we have focused solely on transactions that appeared to us, from the public filings, to be identifiable as Series B and later round financings. We have excluded transactions that appeared to us to involve considerations and concerns different from those applicable in a typical Series B or later round, such as might occur, for example, in the case of a recapitalization. For this reason, the set of transactions described above may vary somewhat from the set of transactions described in the tables elsewhere in this publication. We have selected terms to report on that we believe will be of particular interest to entrepreneurs. A definition of each of these terms can be found on our website. Information included in the table above is based on information made publicly available by participants in the relevant transactions and is not comprehensive.
The National Activity Level Summary

The content of this article is intended to provide a general guide to the subject matter. Specialist advice should be sought about your specific circumstances.

