
Whilst most DGFs share a common goal of achieving equity-like returns with a lower risk level, they still have a wide range of risk/return objectives, and a variety of approaches to achieving those objectives. Some are based on quantitative or systematic processes, while others are qualitative in nature. The broad range of strategies and approaches will have a significant impact on the performance of the funds. Despite targeting similar objectives of delivering equity-like returns with lower volatility than global equity markets over 3-5 years, the actual outcome of DGFs can show (and has shown) significant dispersion.
The basis of the peer group construction is the submission of multi-asset manager responses to MJHudsonIQ (Camradata and Bloomberg were used as supplementary sources). The initial screen included 285 multi-asset funds. We filtered this list further through applying a set of internally defined rules and principles to create the relevant peer groups. The main rules used were:
- To exclude alternative risk premia funds;
- To exclude duplicate funds, carve-outs & international versions of existing products;
- To exclude income share classes;
- To exclude multi-asset income funds and multi-asset credit funds;
- To exclude segregated accounts and retail share classes;
- Fund performance data must be readily available (excludes the funds not reporting gross return, or GBP returns).
The result of this process narrowed the universe down from 285 to 91 funds, including 18 passive/strategic allocation funds and 73 DGFs. It is important to compare performance on a gross of fee basis, which is a better representation of managers' investment skill without being affected by the costs. Where multiple share classes are available, we chose GBP denominated, institutional, accumulation share class.
In this section, we assess the past performance of 91 multi-asset funds in 1-year, 3-year and 5-year investment horizons. We started our peer fund performance assessment by classifying multi-asset funds by (1) stated investment targets, (2) stated volatility targets and (3) strategies as defined above. In order to maintain the reliability and accuracy of the result, we excluded any back-tested or simulated track records.
Performance Assessment by Investment Target
2018 got off to a turbulent start, with significant volatility across many asset classes driven by geopolitical and some macro-economic concerns resulting in major equity markets suffering double-digit losses in the first quarter. In Q2, the global economy recovered from its initial stumble earlier in the year as growth picked up in most developed markets, although volatility remained heightened relative to 2017. Our multi-asset universe suffered with a return of -2.0% in Q1 as a result of the recent turbulence, and the year-to-date average return is almost flat at -0.3%. Over the last 12 months, there was wide dispersion across all the funds as displayed in the chart below, averaging a return of 4.1%.
CHART 1: MULTI-ASSET FUNDS: 1-YEAR RISK VS RETURN AS OF Q2 2018
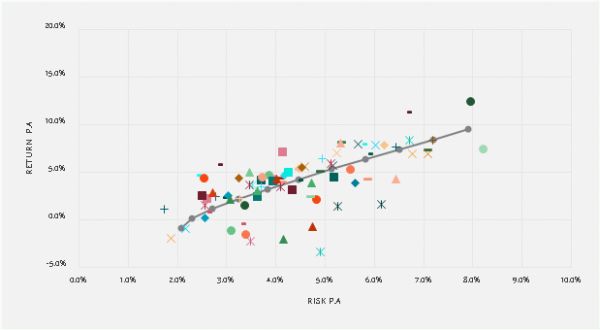
Source: MJ Hudson Allenbridge, Camradata and Bloomberg
Note: The grey line is made of global equities (MSCI ACWI Gross GBP Index) and global fixed income investments (Bloomberg Barclays Global Aggregate Corporate Total Return Index Hedged GBP).
However, most of the multi-asset funds are targeting outperformance of inflation/cash plus 3% to 5% in the medium term over three to five years, which implies that we should allow at least three years to assess their investment ability against the target. The performance analysis over the past three years is summarised in Table 1 and Chart 2.
Since January 2001, the annual total return of global equities (as measured by MSCI ACWI Gross GBP Index) has been 3.6% per annum and the annual total return for cash (as measured by the ICE LIBOR GBP 1 Month) has been 0.4% over the same period. Therefore, given the long-term timeframe, and taking into account currently low growth expectations across major economies, it has been suggested that a cash plus 3% to 5% return target is a good proxy for long-term equity returns.
We classified multi-asset funds by their stated target returns and assessed their past three-year performance on a gross-of-fee basis. The result is summarised in the table below. For the funds that do not have or did not provide us with a specified target return, we used the historic long-term cash plus equity return of 4.0% as a proxy for the minimum required return.
TABLE 1: PERFORMANCE ASSESSMENT BY INVESTMENT TARGET
| INVESTMENT TARGETS | NUMBER OF FUNDS | MINIMUM REQUIRED RETURN ("MRR") | % OF FUNDS'
3-YEAR RETURN P.A. > MRR |
AVERAGE 3-YEAR RETURN P.A. | AVERAGE SHORTFALL (OF UNDER-PERFORMERS) |
| Cash Plus <3% | 3 | 0.4% | 100% | 4.0% | 0.0% |
| Cash Plus >3% <5% | 41 | 3.4% | 69% | 5.3% | 1.2% |
| Cash Plus >5% <7% | 16 | 5.4% | 20% | 4.0% | 2.2% |
| Cash Plus >7% | 1 | 7.4% | 0% | -1.6% | 9.0% |
| N/A or Target Not Provided | 30 | 4.0% | 90% | 8.1% | 1.4% |
| Overall | 91 | 65% | 5.6% | 2.0% |
Source: MJ Hudson Allenbridge, Camradata and Bloomberg
Of the wide universe of funds that we analysed, there was a large dispersion in the 3-year medium-term results as illustrated in the chart below, with approximately two thirds of the funds (65%) achieving their targets as of Q2 2018. In addition, over the same period, a 60/40 global equities/global fixed income portfolio, hedged to sterling, gained an average of 10.2% a year. The overall multi-asset group targeting the proxy for longer-term equity returns (cash plus 3-5%) posted 5.3% annualised returns – in line with their target but trailing the passive 60/40 substitute.
CHART 2: MULTI-ASSET FUNDS: 3-YEAR RISK VS RETURN AS OF Q2 2018
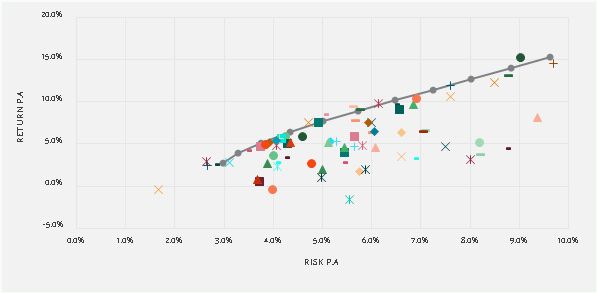
Source: MJ Hudson Allenbridge, Camradata and Bloomberg
Note: The grey line is made of global equities (MSCI ACWI Gross GBP Index) and global fixed income investments (Bloomberg Barclays Global Aggregate Corporate Total Return Index Hedged GBP).
Similarly, there was also a great deal of disparity among the funds in terms of their risk/return characteristics over recent five years as illustrated below.
CHART 3: MULTI-ASSET FUNDS: 5-YEAR RISK VS RETURN AS OF Q2 2018

Source: MJ Hudson Allenbridge, Camradata and Bloomberg
Note: The grey line is made of global equities (MSCI ACWI Gross GBP Index) and global fixed income investments (Bloomberg Barclays Global Aggregate Corporate Total Return Index Hedged GBP).
Performance Assessment by Volatility Target
Most of the funds claim to have been under two-thirds of the volatility level of global equities, but some of them propose a range of absolute volatility instead, and approximately 40% of the funds do not place or did not provide a volatility target. We compared each funds' recent three-year annualised volatility versus the volatility targets provided.
We can see large dispersion in the realised volatility varying from less than 2% to around 10% over a 3-year time horizon. Only 13% of the managers have performed in line with their stated medium-term volatility targets, while 54% the funds have performed lower than target volatility level, and the remaining 33% have been much more volatile than they expected. The percentage of funds at different volatility levels is illustrated in the Chart 4 below.
CHART 4: MULTI-ASSET FUNDS: 3-YEAR ANNUALISED VOLATILITY AS OF Q2 2018

Source: MJ Hudson Allenbridge and Camradata
Global equities have posted an annualised volatility of 9.6%, and the range of half to two thirds of its volatility level is about 4.8-6.4% per annum over the three-year period. As illustrated in the histogram above, most of the multi-asset funds had an annual realised volatility between 4.0-7.0% over the same period, about the same as half to two thirds of global equities volatility level.
Performance Assessment by Strategy
We grouped the 91 funds and their performance figures into four broad strategies which we defined earlier.
TABLE 2: PERFORMANCE ASSESSMENT BY STRATEGY
| NO. OF FUNDS ASSESSED | AVG. OF YEAR-TO-DATE RETURN | AVG.OF 1-YEAR RETURN | AVG.OF 3-YEAR ANNUALISED RETURN | AVG.OF 5-YEAR ANNUALISED RETURN | AVG. 3-YEAR INFORMATION RATIO VS CASH + 3% | AVG. 5-YEAR INFORMATION RATIO VS CASH + 3% | |
| Passive / Strategic Allocation (or Balanced) Funds | 18 | 0.9% | 5.4% | 9.0% | 8.2% | 0.85 | 0.73 |
| Absolute Return Funds | 17 | -0.4% | 1.2% | 3.1% | 4.3% | -0.24 | 0.04 |
| Dynamic Asset Allocation Funds | 32 | -0.4% | 4.4% | 5.5% | 6.5% | 0.29 | 0.47 |
| Risk-based Allocation Funds (incl. Risk Parity Funds) | 24 | -1.0% | 4.6% | 5.6% | 6.4% | 0.29 | 0.47 |
| Overall | 91 | -0.3% | 4.1% | 5.6% | 6.4% | 0.28 | 0.44 |
Source: MJ Hudson Allenbridge, Camradata and Bloomberg
As illustrated in the above table, there is wide dispersion in past performance. Over the last three years, the passive/strategic allocation funds have posted an average annual return of 9.0% outperforming the three DGF categories; the dynamic asset allocation DGFs and risk-based allocation DGFs returned 5.5% and 5.6% respectively, in line with the generic inflation/cash + 3% to 5% target. However, the absolute return DGFs have been disappointing and have underperformed the market average, generating 3.1% vs. the average return of 5.6% p.a. over the same period.
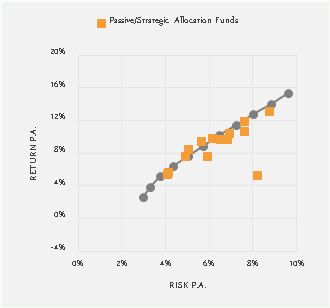
CHART 5: 3-YEAR RISK RETURN PLOT BY STRATEGY AS OF Q2 2018
 |
 |
 |
 |
Source: MJ Hudson Allenbridge, Camradata and Bloomberg
Note: The grey line is made of global equities (MSCI ACWI Gross GBP Index) and global fixed income investments (Bloomberg Barclays Global Aggregate Corporate Total Return Index Hedged GBP).
Most of the funds have not outperformed the equity/bond benchmark over 3-years on a gross-of-fees basis, but the majority of the passive/strategic allocation funds have performed in line with the equity/bond efficient frontier as they are meant to gain exposure to the passive strategic benchmark. The absolute return DGFs, which generally aim to generate positive total returns across varying market conditions, have clustered around the lower risk and lower return area for the purpose of their capital preservation targets. There is a less clear message for dynamic asset allocation and risk-based allocation funds due to significantly differing methods of tactical asset allocation.
From a longer-term perspective, under a period of strong economic growth post-crisis, multi-asset funds overall (measured as the median of each category of strategy) achieved their general return target, posting a long term cumulative return more than cash plus 3% to 5% on a rolling 3-year basis since 2012 as shown Chart 6.
CHART 6: ROLLING 3-YEAR ANNUALISED RETURN

Source: MJ Hudson Allenbridge, Camradata and Bloomberg
Notably, over the financial crisis, the absolute return strategy was a good diversifier to equity investments and outperformed all other multi-asset strategies as would be expected. However, performance has been disappointing in the last three years, and the volatility for this strategy has remained relatively low. As shown in Chart 7, the absolute return strategies have kept a low-risk profile consistently over time, which could be one of the main reasons for the last several years of underperformance.
We looked at the rolling volatility and maximum drawdown of each strategy type to see how they performed. The results are presented in Charts 7 and 8. Focusing simply on the negative periods, we can see multi-asset funds on average have realised less drawdown than global equities over the last 10 years as would be expected.
CHART 7: ROLLING 3-YEAR ANNUALISED VOLATILITY

CHART 8: ROLLING 1-YEAR MAXIMUM DRAWDOWN

Source: MJ Hudson Allenbridge, Camradata and Bloomberg
The full MJ Hudson Allenbridge Multi-Asset Funds Market Review is available to download for free at https://www.mjhudson.com/download/multi-asset-market-review/
The content of this article is intended to provide a general guide to the subject matter. Specialist advice should be sought about your specific circumstances.

