Appendix 3 – Illustrative OFR (Delto plc)
This illustrative Operating and Financial Review (OFR) was developed to provide good examples of the typical disclosures which should be included by a UK company publishing a voluntary OFR and seeking to comply with the Accounting Standard Board’s 2006 "Reporting Statement: Operating and Financial Review".
The OFR is based on a hypothetical company which is the parent of a group of companies. The wording used in this OFR is purely illustrative and in practice will need to be modified to reflect the circumstances of a Group and its business. Similarly, the structure of the illustrative OFR set out below will not necessarily be appropriate for all companies and therefore the structure of other OFRs is likely to be different. In places, the illustrative OFR utilises examples set out in the illustrative guidance to the Reporting Statement. It may also contain internal inconsistencies.
Operating and Financial Review
To the members of Delto plc
[Insert suitable wording to the effect that the OFR has been prepared solely to provide additional information to shareholders as a body to assess the company’s strategies and the potential for those strategies to succeed, and that the OFR should not be relied on by any other party or for any other purpose.]
[Insert suitable wording to clarify that the OFR contains forwardlooking statements and that these statements:
(1) have been made by the directors in good faith based on the information available to them up to the time of their approval of this report; and
(2) should be treated with caution due to the inherent uncertainties, including both economic and business risk factors, underlying any such forward-looking information.]
[Insert suitable compliance statement explaining how the OFR has been prepared – see options 1 and 2 in box below.]
Example compliance wordings
Option 1 – Directors complying with ASB’s 2006 Reporting Statement:
The directors, in preparing this OFR, have sought to comply with the ASB’s 2006 Reporting Statement on OFRs [except that … add any exceptions to compliance].
Option 2 – Directors complying with ASB’s 2003 Statement of best practice for OFR and intending to comply with the 2006 Reporting Statement next year (this is most likely to apply to December 2005 year ends):
The directors, in preparing this OFR, have sought to comply with the ASB’s 2003 Statement on OFRs [except that…add any exceptions to compliance]. Due to the timing of the company’s financial year end and reporting calendar, it was not possible to comply with the ASB’s Reporting Statement on OFRs published in January 2006. The directors will seek to comply with the 2006 Reporting Statement in the company’s next OFR.
This Operating and Financial Review has been prepared for the Group as a whole and therefore gives greater emphasis to those matters which are significant to Delto plc and its subsidiary undertakings when viewed as a whole.
The Operating and Financial Review discusses the following areas:
|
Long term strategy and business objectives |
p.X |
|
Results for 2006 financial year |
p.X |
|
Future outlook |
p.X |
|
Operations |
p.X |
|
Risks and uncertainties |
p.X |
|
Resources |
p.X |
|
Financial review |
p.X |
Long term strategy and business objectives
Delto is a manufacturer of products used in the X and X industries for X. The Group operates in a total of over X countries in three main geographical markets: Europe, the Americas and Asia Pacific. Its core products are X, X and X. A detailed analysis of current operations is set out in the ‘Operations’ section below.
There are three key elements to Delto’s strategy for accelerating growth and creating real shareholder value. They are:
- achievement of leading positions in markets capable of long-term growth;
- targeted investment in new product development, innovation and marketing to support strong organic growth and profitability; and
- focused acquisitions which meet strict rate of return criteria.
We implement and monitor our performance against the strategy by having the following strategic objectives:
- to attain an overall return on capital employed for the Group of X% per year;
- to achieve a total market share across our markets of X% by 2009;
- to maintain a gross margin of X%; and
- to earn X% of revenue from new products each year.
These financial objectives are supported by non-financial objectives which are:
- to minimise waste by reducing the amount of packaging used with our products to below the levels of 2000, being Xkg packaging waste per £X sales; and
- to reduce lost time injury frequency rate (LTIFR) by X% per year.
We have made significant progress in the year on the three key elements of our strategy. We have gained market share in X of our X market. We have invested £Xm (2005: £Xm) in our core products and have launched a number of new products in the year including X and X. Further new products are nearing completion and are due to be launched in the next year. We also acquired Company X in the USA to grow our market strength and have restructured this part of our business following the acquisition to consolidate our positions in this territory.
Our progress on our strategic objectives is monitored by the Board of Directors by reference to six key performance indicators applied on a Group wide basis. These same indicators are used by in executive management appraisal on a global and regional basis. Performance in 2006 against these targets is set out in the table below, together with the prior year performance data. No changes have been made to the source of data or calculation methods used in the year.
|
Key performance indicators |
Target |
2006 |
2005 |
|
Return on capital employed(1) |
X% |
X% |
X% |
|
Market share(2) |
X%* |
X% |
X% |
|
Gross margin(3) |
X% |
X% |
X% |
|
Percentage of revenue from new products(4) |
X% |
X% |
X% |
|
Packaging waste rate(5) |
X |
X |
X |
|
Lost time injury frequency rate (injuries per X hours worked)(6) |
X |
X |
X |
|
(1) ROCE = Operating result as a percentage of Capital employed Operating result as per financial statements. Capital employed being Intangible assets plus property, plant and equipment plus investments plus trade accounts receivable less non-interest bearing provisions and liabilities. |
|||
|
(2) Market share = Revenue as a percentage of Market revenues Revenue as per consolidated income statement in financial statements. No external verifiable source for market share exists. Accordingly data for market revenues are internal estimates based on information available in each market. * – target is to achieve this share by 2009. |
|||
|
(3) Gross Margin = Gross Profit as a percentage of Revenue Gross profit and revenue both as per consolidated income statement in financial statements. |
|||
|
(4) % Revenue from new products = Revenue from new products as a percentage of Revenue Revenue derived from new products is per internal company data. Revenue as per consolidated income statement in financial statements. |
|||
|
(5) Packaging waste rate = Total packaging in kg x X/Revenue Total packaging in kg as per internal company data. Revenue as per consolidated income statement in financial statements. |
|||
|
(6) Lost time injury frequency rate (LTIFR) = Number of injuries x X hours/total hours worked Source of underlying data: Injury and hours data per returns from 100% owned facilities only. |
|||
The results in the table show that we met our targets for three of our six objectives. One objective (market share) is to be achieved by 2009 so is ‘in progress’ and the two objectives for which we did not meet our targets were gross margin and packaging waste rate. The directors believe that, having achieved a market share of X% in 2006, the group is still well placed to achieve the 2009 target for market share. Each of our financial objectives is discussed in the ‘Results’ section below and the non-financial objectives are discussed in the ‘Risks and Uncertainties’ (Packaging waste rate) and ‘Resources’ (LTIFR) sections below. Whilst other performance measures are discussed in this Review, it is the above six measures that the directors utilise and apply as the Group’s KPIs.
Results for 2006 financial year
A summary of key financial results is set out in the table below and discussed in this section. A detailed review of each division’s operations is included in ‘Operations’ on page X.
|
Key Financials |
Revenue |
Gross Margin % |
Underlying Operating Profit* |
|||
|
2006 |
2005 |
2006 |
2005 |
2006 |
2005 |
|
|
£m |
£m |
X% |
X% |
£m |
£m |
|
|
Europe |
X |
X |
X% |
X% |
X |
X |
|
Americas |
X |
X |
X% |
X% |
(X) |
X |
|
Asia Pacific |
X |
X |
X% |
X% |
X |
X |
|
Group Total |
X |
X |
X% |
X% |
X |
X |
*Underlying Operating Profit is profit before interest, tax and oneoff items and is reconciled to the financial statements as follows.
|
2006 |
2005 |
|
|
£m |
£m |
|
|
Profit from operations per financial statements |
X |
X |
|
Exchange differences |
X |
(X) |
|
Goodwill impairment |
X |
X |
|
Underlying operating profit |
X |
X |
Delto made further progress towards its stated objectives in 2006. In last year’s OFR we predicted that the performance of the Group (in terms of both profit and market share) would increase due to the launch of new products and this has been borne out in the year. Total group revenue was up X% on 2005 to £Xm. Despite a decline in gross margin percentage in 2006 by X percentage points to X%, underlying operating profit before interest, tax and one-off items increased by £Xm to £Xm.
Eliminating the effect of currency movements, revenue growth was strong. The Group sees market share as a key performance indicator as it allows us to assess how the company is growing in relation to its competitors. We stated in our previous annual report that the Group aims to achieve a market share of X% within 4 years (i.e. by 2009). During the year we achieved a market share of X% which was up from X% in 2005. We are therefore making progress in this area although the growth in 2006 was not as high as previously expected due to the fall in sales of product X in the year, price pressures in Europe and to the problems experienced in the American division. There are a number of new product launches scheduled in 2007 and therefore the directors expect that our market share will increase and that the target of X% within four years is still achievable.
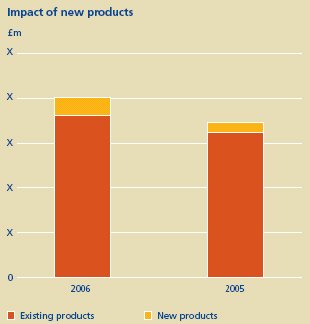
The Group launched X new products in 2006 which contributed revenue of £Xm.
Percentage of revenue from new products
To continue to grow in the fast paced market, the Group needs to ensure that it is continually renewing its product portfolio. We measure our success in this area by a KPI that looks at the percentage of revenue generated by new products. Percentage of revenue from new products = revenue from those products launched over the past two years over total revenue for the year.
Our target was to achieve X% of revenue from new products per annum. We have achieved this target for the first time in 2006 with a result of X%.
Applying a constant currency basis, Europe and Asia Pacific achieved a growth in profit of X% and X% respectively. The growth in Europe was partly attributable to the acquisition of Company X in France early in the year which had an immediate effect on our market share. Growth of X% in Asia Pacific was almost entirely organic growth with only X% of this increase being attributable to acquisitions. A small loss was made in Americas due to weaker sales, continuing delays in the integration of several small acquisitions made in 2004/5 and to problems in the management of the US offices in Boston.
Cash levels were down by £Xm from £Xm at the end of 2005 to £Xm at the end of the current financial year. Although profits increased in 2006, cash inflows from operating activities were offset by restructuring costs and higher interest payments on debt that was drawn down to fund further acquisitions in the year. Net interest payable was £Xm (2005: £Xm).
Return on Capital Employed
The Group’s key measure of the effective use of resources is Return on Capital Employed (ROCE). ROCE demonstrates the effectiveness of our managers in utilising the assets of the business to deliver profits to provide a return to our shareholders. ROCE is calculated as the operating result [explain which figure and reconcile to FS] divided by total capital employed (invested) in the business and is expressed as a percentage.
The Group has a target ROCE of X% per year. We again met this target in 2006, achieving a ROCE of X% which represents a small increase on the 2005 figure of X%. This improvement was largely due to the strong performance in the Asia Pacific market which drove Group profits up by £Xm.
Future outlook
While the external commercial environment is expected to remain competitive in 2007, we have good momentum across both Europe and Asia Pacific and we believe that we have now taken the necessary actions, and put in place processes, to implement the restructuring of the American business.
In Europe, we expect continued price pressure from our competitors in the more developed markets. This will push gross margins downwards, a trend that is likely to continue for the next two to three years until the current consolidation activity in the market slows. We anticipate that, despite our efficient manufacturing process, our margins in Europe in 2007 will decline. In unit terms, we expect continued sales growth for the year as a whole and we are now aiming to launch new product X in this market in the second half of the year. This launch was delayed by the regulatory approval process which took longer than anticipated due to the testing of new product features. The Group acquired X% of Company X in the Czech Republic after year end, representing only our second investment in Eastern Europe. We view the Eastern European markets as critical to maintaining our competitive strength across Europe and we expect to make further acquisitions in these markets and to achieve high growth rates as a result over the coming years.
In Asia Pacific, we expect our portfolio to perform well but sustaining the outstanding growth rates we saw in 2006 will be challenging. We have not identified further acquisition targets at this stage but will continue to watch closely the emerging players in our existing and other related markets.
We expect that the benefits of restructuring our business in the Americas may take one to two years to be realised and we therefore anticipate that like-for-like sales in this division may decline further in the first half of 2007 before recovering to 2006 levels for the second half of the year. Gross margins should benefit from the faster and more efficient manufacturing process at our new facility in Texas and costs across the American business should be lower in 2007 following the restructuring of the business including the consolidation of our east coast operations into one head office (rather than two offices previously) for that division. We anticipate that this business will return to profitability in the second half of 2007 so that it should break even for the full year.
We believe that the Group has an advantage in terms of its business model within the sector as we are positioned in the more attractive, growing product markets and a significant portion of our unique product portfolio is sold through higher margin distribution channels. We have a strong management team committed to winning in the market place and have clear goals and priorities which focus the business on delivering improvements in growth and efficiency. Our efficiency programmes implemented across the business in 2005 are now providing the necessary additional funds to enable us to invest in our commercial programmes and capabilities so that we can better exploit the full potential of the portfolio we now have. This should enable us to deliver superior business performance which will in turn drive shareholder returns.
Operations
Delto manufactures innovative, high quality products for the X and X industries. These products are used by our customers in a variety of systems which perform functions such as X and X. Our product portfolio includes lines such as the Product X range and the Product X range and our key brands include X, X and X. We are a global player in our market and we are in the top 5 players in X of the X countries in which we operate. We distribute our products via our cross border sales offices and also through distributor agents in some markets.
Competitive environment
Many of the specific markets in which Delto operates experience a high degree of competition. Globally, Delto’s key competitors are X, X, and X. Over the years we have developed a creative, innovative, competitive culture and a reputation for advanced functionality and superior product quality. However, we continue to experience price pressure from our competitors in the more developed markets which impacts our products at the top end of the market range. There has been much consolidation occurring in the newer markets as the key players seek to gain market share by acquiring smaller, local operators.
Regulatory environment
The key regulations which affect Delto and its products are the X regulations and the X regulations. The proposed European Directive on X means that we anticipate further regulatory requirements to be enforced in our EU markets although the Directive is not due to be implemented until 2008 at the earliest. Delto monitors developments in the regulatory environment to stay abreast of any changes and acts in a timely and efficient manner to comply and to avoid infringing law or regulation and incurring fines as a result. There are no changes expected in the coming year which would influence Delto’s ability to continue to supply its products worldwide.
Macro-economic environment
In the X, our biggest single market in both revenue and profit terms, the economic environment over the last year has been relatively stable, with a high level of growth. GDP growth is estimated to have been X% in 2006, the highest for four years. However, this is forecast to drop back slightly in 2006 and 2007. In the rest of Europe, growth has been lower at an average of X% for 2006 and this rate of growth is not expected to change significantly in 2007. In the Americas, the economy strengthened during 2006 after three years of poor performance. The Asia Pacific market continues to grow at a fast pace driven largely by growth in China and India.
Review by division
We are organised around three regional units supported by the group global functions. Each region has an operating director who is responsible for meeting the key targets set for the region.
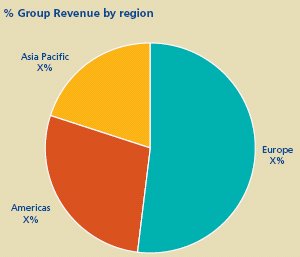
The performance of each region in terms of 2006 revenue growth and contribution to Group revenues is shown in the charts below.
Europe
Europe is our strongest market contributing over X% of our total Group revenues for 2006 (2005: X%). We are now present in X markets in Europe having added Hungary and the Czech Republic to our territories since the end of the 2005 financial year. Our key brands in Europe are X and X and our main products are X and X. Our product X is the fastest growing new launch in our portfolio having contributed £Xm to revenue since its launch in the first quarter of 2006. We also continue to grow the share of this market achieved by Products X and X. However, the replacement of Product X globally by its updated version (which adds the X functionality) was delayed when the regulator X imposed further testing requirements on the new version. This impacted our European business with sales of this line down X% from 2005 to £Xm. The new launch is now expected to occur in the first quarter of 2007.
Our position within the largest six markets in Europe within industry X together with our 2006 market share of revenues is set out below.
|
Market |
Market position |
Market share (%) |
|
UK |
1 |
X% |
|
France |
2 |
X% |
|
Spain |
4 |
X% |
|
Germany |
2 |
X% |
|
Italy |
5 |
X% |
|
Holland |
3 |
X% |
Our businesses in the European sector achieved record revenues of £Xm during 2006 despite an increasingly competitive environment dominated by multinational players. Underlying profits were also slightly ahead at £Xm.
Revenue growth was largely a result of an increase in unit sales and of the major acquisition made in 2005 of Company X in France which moved us from 4th in the market to 2nd and which contributed £Xm to revenues. We achieved double-digit growth of X% in France. There has been significant price pressure in the more developed markets (UK, France, Germany and Spain) resulting in little growth in like-for-like sales in these markets and a drop in gross margin from X% in 2005 to X% in the current year. Despite such market pressures, we maintained our market share in most markets by aggressive marketing of existing products and through the launch of Product X.
We will continue to experience pressure on margins but expect that we will maintain if not grow market share through further acquisitions, largely in Eastern Europe.
To read the next part of this article, please click the link below.
The content of this article is intended to provide a general guide to the subject matter. Specialist advice should be sought about your specific circumstances.
