
We analyzed the terms of 174 venture financings closed in the second quarter of 2014 by companies headquartered in Silicon Valley.
Overview of Fenwick & West Results
Valuation results in 2Q14 were the strongest in the history of our
survey.
- Up rounds exceeded down rounds 80% to 6%, with 14% flat. The 74 point difference between up and down rounds was the largest since we began calculating up/down rounds in 1Q02.
- The Fenwick & West Venture Capital Barometer" showed an average price increase of 113%, the highest amount since we began calculating this statistic in 1Q04.
- The median price increase of financings in 2Q14 was 75%, the highest amount since we began calculating medians in 2010.
- The internet/digital media, software and hardware industries all had very strong results, with internet/digital media having the highest Barometer (169%) and median (99%) increases, software continuing not only to have strong valuations but also increasing its percentage of post Series A financings to 48%, and the hardware industry registering a very strong second best barometer result of 132%. The life science industry also posted solid results, while cleantech lagged other industries but still had reasonable results.
Overview of Other Industry Data
More generally, the second quarter of 2014 was another very strong
quarter for the U.S. venture environment.
- Venture capital investment hit its highest levels since the first quarter of 2001.
- Venture-backed IPOs lagged the very strong 1Q14, but the number of IPOs in the first half of 2014 has already surpassed the full year totals for each of 2008-2012, and if current trends continue 2014 would be the best year for venture-backed IPOs since 2000.
- Acquisitions in 2Q14 trailed a strong 1Q14, but were still healthy.
- Venture fundraising had another good quarter, with the largest number of funds raising money since 4Q07, although dollars raised lagged 1Q14.
- Venture capitalist sentiment for 2Q14 was essentially even with 1Q14, at a level of approximately 4 on a scale of 1 to 5
- Venture Capital Investment
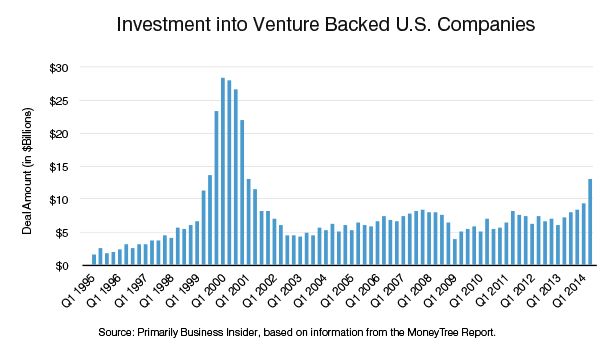
U.S. venture capital investment in 2Q14 hit its highest quarterly level in dollar terms since 1Q01, and was approximately 35% higher than 1Q14 which was itself a strong quarter. The number of deals also increased, by a less dramatic but still significant 11% over 1Q14. A summary of results published by three leading providers of venture data is below.
2Q14 Investing into Venture Backed U.S.
Companies
| 2Q14 ($Billions) |
1Q131 ($Billions) |
Difference % |
2Q14 Deals |
1Q141 Deals |
Difference % |
|
|---|---|---|---|---|---|---|
| VentureSource2 | $13.8 | $10.7 | 29% | 917 | 862 | 6% |
| MoneyTree3 | $13.0 | $9.5 | 37% | 1,114 | 951 | 17% |
| CBI4 | $13.9 | $10.0 | 39% | 974 | 890 | 11% |
| Average | $13.6 | $10.1 | 35% | 1002 | 898 | 11% |
1 As reported April 2014
2 Dow Jones VentureSource ("VentureSource")
3 The PWC/NVCA MoneyTree" Report based on data from Thomson Reuters ("MoneyTree")
4 CB Insights ("CBI")
While the amount of investment in 2Q14 was the largest since the
dot-com era, it was significantly lower than dot-com levels.
 Valuations were also high, as VentureSource reported that the median
pre-money valuation for the second quarter was $58.3 million, the
highest on record and 106% higher than the $28.4 million reported
for 1Q14.
Valuations were also high, as VentureSource reported that the median
pre-money valuation for the second quarter was $58.3 million, the
highest on record and 106% higher than the $28.4 million reported
for 1Q14.
Investment in late stage companies continued to be very strong in
2Q14, with Series D and later financings taking 45% of all funding,
and a five quarter high 17% of all deals, according to CBI. Similarly, the Wall Street Journal reported that venture
firms invested $15.6 billion in late stage financings in the first
half of 2014, which is on track to exceed the $28.5 billion
invested in late stage companies in 2000. This increase in late
stage financings is likely due in part to companies delaying their
IPO and raising more money privately.
Software companies received $6.1 billion of the 2Q14 investment,
including a single $1.2 billion investment, the largest single
investment ever reported by the MoneyTree. Digital health was also very
strong, with funding through the first half of 2014 exceeding all
of 2013, according to Rock Health.
With the growth of databases such as CrunchBase and AngelList, more
information on the startup environment is available. Medium.com recently analyzed some of this data
and reported that on average, over the last 5 years:
- Series B rounds raised 3x Series A rounds, Series C rounds raised 2.2x Series B rounds, and Series D rounds raised 1.9x Series C rounds, and that
- Series B financings occur 484 days after the Series A financing, Series C financings occur 542 days after the Series B financing and Series D financings occur 530 days after the Series C financing.
The increased availability of venture focused databases is also
increasing the use of "data driven" approaches to venture
investing, as discussed in Forbes.
Like the technology industry in general, the venture capital
industry is changing, with angels and online seed financing sites
providing competition at the low end of the investment spectrum,
hedge funds and private equity providing competition at the high
end and corporations providing competition throughout the
investment spectrum. As a result many venture capitalists are
focusing on providing more "value-add" to differentiate
themselves from other funding sources. Much of this value-add has
consisted of additional services such as HR or accounting, improved
networking/mentoring capabilities and the like. However we were
recently intrigued to read in Strictly VC about a new venture fund (Upside
Partners) providing a portion of the carried interest of their fund
to management of its investee companies, to encourage collaboration
among portfolio companies, and we assume to also improve the
fund's ability to attract the best investment
opportunities.
The growth in venture investing in 2Q14 was not limited to the
U.S., as Europe saw its largest amount of investment since 2001
(€2.1 billion) per the Wall Street Journal, China saw its largest
amount of investment ($2.8 billion) since at least 2006, per VentureWire, and Israel saw its highest
quarterly investment amount ($930 million) since 2000, per IVC.
- IPO Activity
There were 25 venture backed IPOs raising $2.2 billion in 2Q14, according to VentureSource. Although this was a decline from the very strong 38 IPOs raising $2.9 billion in 1Q14, it was a very solid quarter.
Similarly, Thomson Reuters and the NVCA (Thomson/NVCA) reported 28 IPOs in 2Q14,
although Thomson/NVCA reported an increase in funds raised. Four of
the IPOs, including the largest, were China based. Sixteen of the
28 IPOs were life science companies, as life science companies
continued to account for a large share of IPOs, including over 50%
in each of the last six quarters.
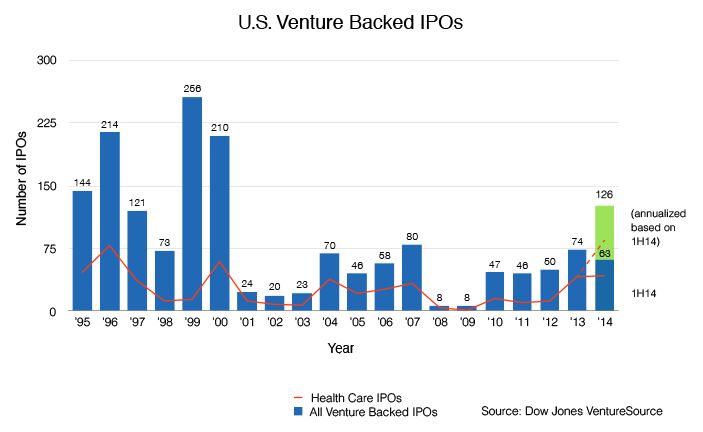
2014 is on track to have more venture backed IPOs in any year since
2000, and the companies going public now generally seem more
substantive than those that went public 15 years ago. For example,
while 80% of tech IPOs in 1999 had less than $50 million of
revenue, only 20% of IPOs in 2013 had revenue of less than $50
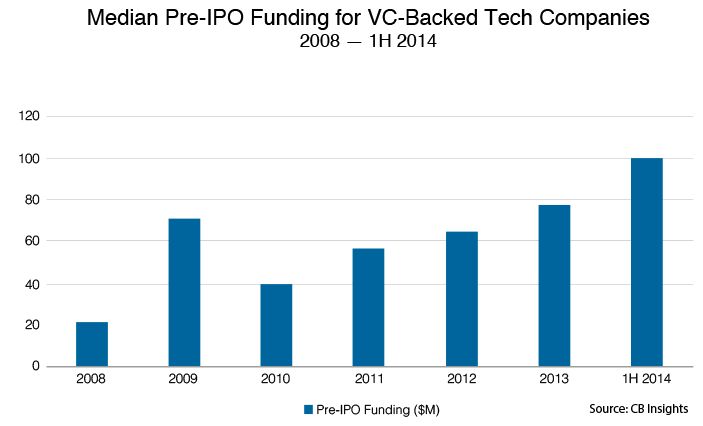
million, according to TechCrunch. The amount of money raised by
companies pre IPO has also been increasing, per CBI.
Things were not as good for venture backed companies that went
public in prior quarters, with the Thomson Reuters Post–Venture Capital
Index (which measures the change in stock price of venture
backed companies that have gone public over the past ten years),
declining 16% in 2Q14.
In an effort to improve the public company prospects of smaller
companies, the SEC has recently required U.S. stock exchanges
to develop a one year pilot program to increase the stock
"tick" size for a group of small and midsize public
companies to as much as $0.05. This action was in response to
concerns that the "decimalization" of stock quote tick
sizes ($0.01 tick sizes), which occurred in 2001, has been
detrimental to smaller and medium size companies by (i) reducing
incentives for underwriters to pursue smaller IPOs, (ii) limiting
the production of sell-side research and (iii) making it less
attractive to be a market maker for these companies. We share the
concerns about the effects of decimalization and look forward to
the implementation of the pilot, although we have concern that the
one year time frame might not be sufficient to cause a substantial
change in banker/analyst/market maker behavior.
The content of this article is intended to provide a general guide to the subject matter. Specialist advice should be sought about your specific circumstances.