
BACKGROUND
We analyzed the terms of venture financings for 124 companies headquartered in Silicon Valley that reported raising money in the fourth quarter of 2013.
OVERVIEW OF FENWICK & WEST RESULTS
Valuation results in 4Q13 continued strong, although not quite as strong as 3Q13.
Here are the more detailed results:
- Up rounds exceeded down rounds 71% to 16%, with 13% of rounds flat. This was slightly less strong than 3Q13 when 73% of rounds were up, 8% down and 19% flat.
- The Fenwick & West Venture Capital Barometer" showed an average price increase of 57% in 4Q13, again a small decline from 65% in 3Q13.
- The median price increase of financings in 4Q13 was 27%, a healthy result but a decline from the 43% registered in 3Q13.
- While internet and digital media continued to be the strongest industries valuation wise, the percentage of financings from the life science industry was the highest (24.5%) since 2Q11. Additionally, software and internet digital media only combined for 50% of all financings, the lowest amount since 1Q12. As life science financings have not performed as well as software and internet digital media financings from a valuation perspective, this shift in mix was the major reason for the slightly less strong overall valuation results.
The more detailed results are below.
OVERVIEW OF OTHER INDUSTRY DATA
The overall venture environment continued to improve in 4Q13, and 2013 overall, but M&A activity and VC fundraising lagged.
- Venture investing was strong in 4Q13, and 2013 was generally stronger than 2012, but lagged 2011. Software and internet investing was especially strong in 2013.
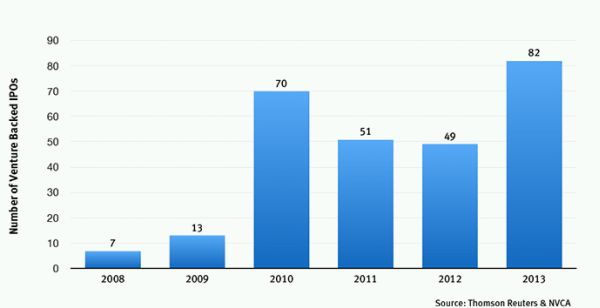
- IPOs were strong in both 4Q13 and 2013, with 2013 seeing the most venture backed IPOs since 2007.
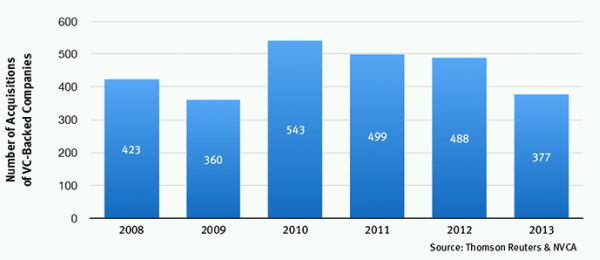
- M&A in 4Q13 was mixed but declined in 2013 overall. 2013 saw the lowest number of venture backed M&A since 2009.
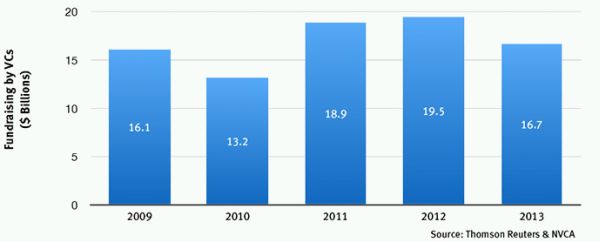
- Venture firm fundraising improved in 4Q13 but declined in 2013, which was the lowest fundraising year since 2010.
- Corporate venture investing increased through the first nine months of 2013 and was on track to be the best year since 2001
- Angel funding increased in 2013, but the number of companies funded by accelerators declined.
- Venture capitalist sentiment continued to improve in 4Q13 reaching the highest level since 3Q07.
Venture Capital Investment
Dow Jones VentureSource ("VentureSource") reported a 9.9% increase in venture investment and an 11.8% increase in the number of venture financings from 3Q13 to 4Q13. Specifically, $8.9 billion was invested in 901 deals in 4Q13 compared to $8.1 billion invested in 806 deals in 3Q13 (as reported in October 2013).1 For the full year of 2013, $33.1 billion was raised in 3480 deals, a 1% increase in dollars but a 5% decline in number of deals from 2012.
The PwC/NVCA MoneyTree" Report based on data from Thomson Reuters (the "MoneyTree Report") reported generally similar results. Specifically, it reported that $8.4 billion was invested in 1077 deals in 4Q13, a 7.6% increase in dollars and a 7.2% increase in deals from the $7.8 billion invested in 1005 deals in 3Q13 (as reported in October 2013).1 For the full year of 2013, $29.4 billion was reported invested in 3,995 deals, an increase of 7% in dollars and 4% in deals over 2012. Investments in internet and software companies reached their highest levels since 2001 and 2000, respectively.
Andreessen Horowitz was the most active VC in 2013 with 81 deals.
IPO Activity
There were 24 venture backed IPOs raising $5.3 billion in 4Q13, a slight decline in transactions from the 26 IPOs in 3Q13 but a substantial increase in dollars from the $2.7 billion raised in 3Q13 (as reported in October 2013)1, according to Thomson Reuters and the NVCA ("Thomson/NVCA").
There were 82 venture backed IPOs in 2013, the most since 2007, and the amount raised in 2013 ($11.2 billion) was also healthy, although less than 2012 due to the Facebook IPO.
Eleven of the fourth quarter IPOs were in life sciences and 10 in IT. Six of the IPOs were from outside of the U.S., due in part to China based companies beginning to re-enter the U.S. IPO market after having little activity in recent years. However the few venture backed Chinese companies going public in the U.S. in 2013 was far less than the 40 that did so in 2010 according to the Venture Capital Journal.
VentureSource reported similar IPO results.
Despite the healthy IPO market, there does not appear to be the large scale "irrational exuberance" in the industry as there was in 1999 when there were over 350 tech IPOs. However those companies that did go public, and those that have gone public in recent years, generally traded up significantly in 2013. And with CB Insights reporting at least 26 private venture backed IT companies with valuations over $1 billion, 2014 is positioned to be another good year for venture backed IPOs.
In November 2013, the Equity Capital Formation Task Force issued a report on some of the regulatory reasons why IPOs in the U.S. have declined over the past decade, and made suggestions for regulatory changes. The report focused on the problems caused by decimalization of trading and the resultant lack of aftermarket support for smaller public tech companies. The lack of small investment banks like the "Four Horsemen" of the 1990s (H&Q, Montgomery, Alex Brown, Robertson Stephens) is likely a related factor.
Merger and Acquisition Activity
VentureSource reported a 24% increase in the amount paid in the acquisition of venture backed companies and a 4% increase in the number of acquisitions in 4Q13 compared to 3Q13. Specifically there were 115 acquisitions for $12.0 billion in 4Q13 compared to 111 deals for $9.7 billion in 3Q13 (as reported in October 2013).1
For the full year 2013 the amount paid in acquisitions declined by 14.2%, and the number of acquisitions declined by 9.4%, from 2012. Specifically there were 413 acquisitions for $36.9 billion in 2013 compared to 456 acquisitions for $43 billion in 2012.
Thomson/NVCA reported a decline in M&A, from 116 in 3Q13 to 81 transactions in 4Q13, a 30% decrease, and from 488 transactions in 2012 to 377 transactions in 2013, a 23% decrease and the lowest year since 2009.
Somewhat in contrast, EY reported that the global (public and private) technology M&A market for 3Q13 was very healthy, with a post dot-com bubble record $71.2 billion of disclosed value acquisitions, and a continued increase in the amount of cash and investment held by the top technology companies–up to $784 billion in 3Q13.
Perhaps part of the reason for the apparent disparity between the public and private M&A markets is that the rebounding IPO market has provided private companies an alternative to acquisition, and perhaps raised their perception of what they are worth. Supporting this thesis, EY also reported that 45% of tech executives they interviewed expected a widening gap in valuation expectation between buyers and sellers, an increase from 18% just six months prior.
Another trend noted by TechCrunch is that increasing numbers of public non-tech companies are interested in acquiring private tech companies, especially those in the same industry (e.g., real estate or retail). And a new start up, ExitRound, has been formed to be a matchmaker for M&A, helping to match buyers and sellers on a confidential basis, a tool that could be especially useful for public non-technology company acquirors.
Of the top 50 VC backed U.S. tech exits each year since 2007, 42% of the companies were based in Silicon Valley and 65% of the aggregate valuation was attributable to Silicon Valley based companies, according to CB Insights.
Venture Capital Fundraising
Venture capital fundraising increased 9% in dollars in 4Q13 compared to 3Q13 but declined 10% in dollars from 2012 to 2013 according to VentureSource. Fourteen venture firms raised a majority of all funds raised in 2013.
Similarly, Thomson Reuters/NVCA reported that fundraising increased 20% from 3Q13 to 4Q13 ($4.1 billion to $4.9 billion) but declined 14% for the full year, from $19.5 billion in 2012 to $16.7 billion in 2013.
The increased concentration of venture resources was also evidenced by the Venture Capital Journal's report that while 360 U.S. venture capital funds invested over $4 million in 2007, only 221 did in 2013.
Corporate Venture Capital and Other Non Traditional VC Investments
Corporate venture capital ("CVC"), and hedge and mutual funds, continued to increase their investment in private technology companies, offsetting at least in part the decline in fundraising by venture firms.
Through the first nine months of 2013, CVCs participated in 17.3% of venture capital deals, the highest percentage since 2008, and provided 11.3% of all funding, the highest percentage since 2001, according to the MoneyTree Report . CVCs invested $3.1 billion during this nine month period, which when annualized to $4.6 billion, would be the largest amount invested by CVCs since 2001.
And the number of CVCs continues to increase, with Global Corporate Venturing tracking 1133 funds, an increase of 227 since 2010, and larger than the 841 traditional venture firms tracked by the NVCA, per a Venture Capital Journal report.
And perhaps surprisingly, Pitchbook reports that companies with corporate investors who have successful exits are purchased by such corporate investor in less than 3% of such exits. Companies with corporate investors are likely to wait longer for a liquidity event and have larger exits.
The five most active CVCs in 3Q13 were Google, Intel, Samsung, SAP and Cisco, according to CB Insights.
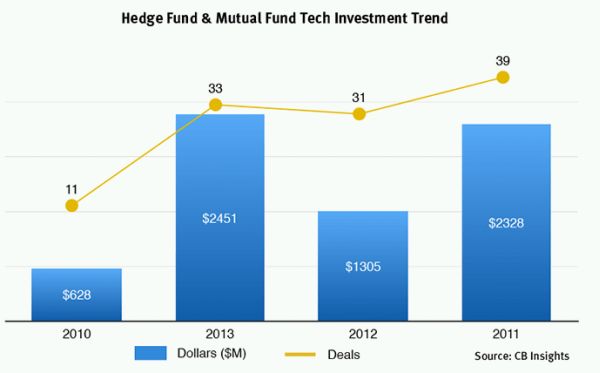
Hedge and mutual funds are also increasing their investments in private technology companies. CB Insights reported that hedge funds and mutual funds increased their private tech investment from $1.3 billion in 2012 to $2.5 billion in 2013.
Angel/Accelerator Financing
Despite ongoing concern about a "Series A Crunch," angel investing into U.S. based technology start-ups increased to $688 million in 2013 from $647 million in 2012, according to Techcrunch .
Consistent with the foregoing, the number of accelerators is projected to have increased to 170 worldwide in 2013, a significant jump from 138 in 2012, according to Techcrunch . However accelerator funding activities seem to have slowed down a bit in 2013, with the total number of start ups funded by accelerators expected to lag the number funded in 2012.

Given that only 27% of companies funded by an accelerator were able to secure VC funding within one year, according to Techcrunch, and only 36% of companies funded by accelerators since 2005 were able to obtain such funding at all, a leveling off in accelerator activity is perhaps warranted. Of course there is significant disparity in post graduation fundraising success among accelerators, with 72% of Y Combinator companies through 2012 having successfully raised funding post graduation.
A hot topic in angel financing is "crowdfunding", but to date the SEC has not promulgated regulations allowing companies to raise money in small amounts from a large number of unaccredited people over the internet, and the proposed regulations are burdensome. That said, it is estimated by Deloitte that companies raised over $700 million in 2013 through a crowdfunding structure in which "investors" are provided product or other rewards from a company, rather than stock or other securities, and accordingly are not subject to SEC regulation.
Secondary Markets
The limited liquidity options available for many venture backed companies over the past decade, and the decision of many of the companies that had liquidity options available to delay such events, has resulted in investors and employees holding their equity for longer periods than previously. Summit Strategies Group estimated as of 2012 that there was a worldwide inventory of 15,000 venture backed companies valued at over $100 billion, and that 73% of venture funds would not be able to liquidate their funds within the expected 10-12 year timeframe. This has spurred the growth of a venture capital secondary market.
The secondary market exchanges like SharesPost (a/k/a Nasdaq Private Market) and SecondMarket have largely morphed since the Facebook IPO (which caused them to lose much of their trading) into companies that help match institutional investors like mutual and hedge funds with companies that want to obtain liquidity for some of their investors and/or employees (VentureWire, Yuliya Chernova, 10/28/13). The other segment of the secondary market—dedicated funds that acquire existing interests in venture funds and venture backed companies—has also shown strength, as evidenced by Industry Ventures recent raise of $625 million in 2013 for these purposes.
Trend
The importance of high quality personnel to the tech industry, and the frequent shortage of such people, is often noted. Some recent news in this regard includes:
- A report in VentureBeat that Google Ventures has funneled over 1500 engineering candidates to its portfolio companies.
- AngelList has started an employer/employee matching service.
- The use of acqui-hires to obtain talent continues.
- The venture community continues to encourage increased H1-B and other visas for overseas tech employees
Venture Capital Sentiment
Investor and entrepreneur confidence in the venture capital environment is growing.
The Silicon Valley Venture Capitalists Confidence Index® by Professor Mark Cannice at the University of San Francisco reported that the confidence level of Silicon Valley venture capitalists rose to 3.94 on a 5 point scale, a slight increase from the 3.92 reported last quarter. The result was the sixth straight quarter of increasing confidence and the highest level since 3Q07.
The eighth annual Venture View survey by Deloitte and the NVCA of 300 venture capitalists and CEOs of venture backed company also showed positive results:
- 58% predict higher levels of VC investment in 2014
- 50% expect IPO volume to increase
- 70% expect M&A to increase
- 45% of VCs expect the fundraising market to continue to concentrate (more dollars but fewer funds), while 35% expect market expansion (more dollars, more funds), an increase from only 9% in 2013
- 62% of VCs and 84% of CEOs expect to see company valuations increase
Venture Capital Returns
Cambridge Associates reported that the value of its venture capital index increased by 6.46% in 3Q13 (4Q13 results have not been publicly released), which trailed the Nasdaq increase of 10.82%. Nasdaq also surpassed venture returns for the 1, 3 and 5 year periods, but for periods of longer than 10 years, venture returns substantially outpaced Nasdaq.
Nasdaq
Nasdaq increased 10.6% in 4Q13, but has decreased 1% in 1Q14 through February 10, 2014.
To read this Survey in full, please click here.
Footnote
1 When comparing current period results to prior period results based on third party data (e.g., amounts invested by venture capitalists, amount of M&A proceeds, etc.), we use the prior period results initially published by the third party for the period, not the results that have been updated with additional information over time, to provide better comparability with the current period published results. For example, when comparing fourth quarter results to third quarter results, we use the initially published third quarter results, typically provided in October, not the updated results that are typically provided in January of the following year. Such situations are set forth in our report with a parenthetical as to the date the information was initially reported.
The content of this article is intended to provide a general guide to the subject matter. Specialist advice should be sought about your specific circumstances.